* Corresponding author: E-mail: [email protected]
Received: June 4, 2015 Approved: November 13, 2015 How to cite: Santos AC, Pereira MG, Anjos LHC, Bernini TA, Cooper M. Genesis of Soils
Formed from Mafic Igneous
Rock in the Atlantic Forest Environment. Rev Bras Cienc Solo. 2016;40:e0150056.
Copyright: This is an open-access article distributed under the terms of the Creative Commons Attribution License, which permits unrestricted use, distribution, and reproduction in any medium, provided that the original author and source are credited.
Genesis of Soils Formed from
Mafic Igneous Rock in the Atlantic
Forest Environment
Adailde do Carmo Santos(1)
, Marcos Gervasio Pereira(2)*
, Lúcia Helena Cunha dos Anjos(2) , Thiago Andrade Bernini(3)
and Miguel Cooper(4)
(1)
Instituto Federal de Educação, Ciência e Tecnologia Baiano, Campus Valença, Bahia, Brasil. (2)
Universidade Federal Rural do Rio de Janeiro, Departamento de Solos, Seropédica, Rio de Janeiro, Brasil. (3)
Instituto Federal de Educação, Ciência e Tecnologia do Rio de Janeiro, Unidade Pinheiral, Pinheiral, Rio de Janeiro, Brasil.
(4)
Universidade de São Paulo, Escola Superior de Agricultura “Luiz de Queiroz”, Departamento de Ciência do Solo, Piracicaba, São Paulo, Brasil.
ABSTRACT: Different parent materials participate in the formation of soils in the hilly landscape of “Mar de Morros” in the Atlantic Forest environment. Those derived from mafic igneous rock (gabbro) frequently show erosion problems because of land use, which is aggravated by the mountainous relief and soil attributes. This study evaluated the main pedogenic processes of soils formed from mafic igneous rock (gabbro) in a toposequence in Pinheiral (RJ) by characterizing physical, chemical, mineralogical and micromorphological attributes. The profiles are located at different sections in the toposequence: summit (P1), shoulder (P2), backslope (P3) and footslope (P4).They were classified according to the Brazilian System of Soil Classification (SiBCS) and correlated to Soil Taxonomy. The soil morphology of profiles P2, P3 and P4 is expressed by a brownish-red color, blocky structure with high to moderate development, clay films and clay loam to clay texture, with a textural B horizon. P1 shows less development, with a shallow profile and the sequence of horizons A-C-Cr. The soils have a slightly low degree of weathering, identified by the presence of pyroxenes and feldspars in the sand fraction and montorillonite in the clay fraction; the sum of bases is from 15 to 24 cmolc kg
-1; and
cation exchange capacity (CEC) is from 12 to 22 cmolc kg -1
. A significant presence of clay skins was observed in the field and was confirmed by thin section analysis, which showed features such as argillans, ferriargillans and iron nodules. The soil profile at the summit (P1) was classified as Neossolo Regolítico Órtico (Typic Udorthents), and the other profiles as Chernossolo Argilúvicos Órticos (Typic Argiudolls).
Keywords: pedogenesis, SiBCS, soil weathering.
INTRODUCTION
Studies on soil genesis based on the petrological characterization of parent materials are valuable for soil classification and assessment of their distribution in a specific area. Knowledge about parent materials also provides information on the physical, chemical and mineralogical attributes of soils. In most studies, however, the relationships found between soil attributes and parent materials are generic, encompassing general groups of rocks and lacking petrological assessment. The relationship between soil classes and geomorphological units must be evaluated as well, given the important role of relief in pedogenesis (Lacerda et al., 2008).
A significant expression of igneous mafic and ultramafic rocks is observed in the southeastern and southern region of Brazil, where a number of studies have investigated soil attributes associated with the nature of these parent materials (Pinto and Kämpf, 1996; Cooper and Vidal-Torrado, 2000; Vidal-Torrado et al., 2006; Campos et al., 2007). In a study on ultramafic rocks in the subtropical area of Rio Grande do Sul state, Pinto and Kämpf (1996) described shallow soils, with pH close to neutral, high CEC and base saturation, in addition to a high content of easily weathered primary minerals, which indicates slow weathering of the soils. The small degree of pedogenesis was credited to soil rejuvenation by the addition of poorly weathered materials on the soil surface and buffering of soil solution by ions released from coarser soil fractions.
Soils in the Atlantic Forest environment and hilly landscape of “Mar de Morros” are mostly formed of acidic materials, such as granite and gneisses and the weathering products of these rocks, while soils formed from mafic rocks are less common, especially in Rio de Janeiro state (Embrapa, 1980; Projeto RadamBrasil, 1983). Owing to their less expressive occurrence, information on pedogenetic processes of soils developed from mafic materials in Rio de Janeiro is scarce.
The municipality of Pinheiral, RJ, exhibits a wide diversity of parent materials (Nummer, 2001), including mafic rocks that can produce soils with chernozemic horizons and Chernossolos (Mollisols), among others. According to Santos et al. (2013), Chernossolos (Mollisols) are composed of mineral materials with diagnostic characteristics such as high base saturation and a chernozemic horizon immediately above i) a textural B horizon or an incipient B horizon with high clay activity; or ii) a carbonatic C horizon or calcic or petrocalcic horizons; or iii) the rock, when carbonate calcium levels in the A horizon are high.
Soils formed from mafic materials such as gabbro in the Pinheiral region are frequently eroded. This results from anthropogenic activities from the historical use of these soils, and is aggravated by the hilly landscape and soil attributes. The erosion process contributes to reducing the thickness of soil surface horizons.
The Brazilian System of Soil Classification -SiBCS (Santos et al., 2013) uses diagnostic attributes, directly assessed or inferred from field observations of the soil profile, to classify soils into upper level categories (order or suborder). However, intense anthropogenic activity and/or soil erosion frequently compromise the analysis of macroscopic features and preclude soil classification, especially into lower level categories. In those cases, analyses such as soil micromorphology and mineralogy of sand and clay fractions become important tools for soil classification.
MATERIALS AND METHODS
Study area
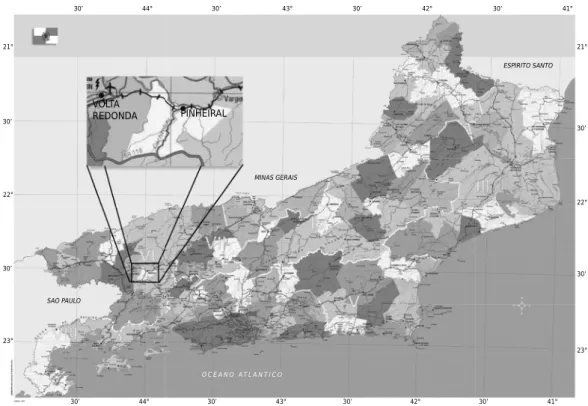
The soil profiles were located in Pinheiral – RJ in the central region of the Paraíba do Sul valley, in southwestern of Rio de Janeiro state (22° 29’ 03’’ to 22° 35’ 27’’ S; 43° 54’ 49’’ to 44° 04’ 05’’W) (Figure 1). The study area is located within the Ribeirão do Cachimbal microwatershed, which is part of the Paraíba do Sul river watershed. In according with Köppen classification, the climate type is Cwa, with dry winters and rainy summers, an annual rainfall of nearly 1,300 mm and a mean annual temperature of 20.9 °C. The area is mainly covered by secondary forest and Brachiaria spp pasture grass. The geomorphology is dominated by belts of folded and faulted rocks remobilized due to tectonic episodes. Colmated hills usually form the interface of the horst-graben complex that characterizes the Paraíba do Sul system. The morphostructure, with strongly waved relief, consists of numerous structural valleys that make up the drainage system. The geology consists of rocks with different degrees of metamorphism, a dominance of porphyroclastic gneiss, biotite gneiss, muscovite-biotite gneiss and intrusions of basic rocks (Projeto Radambrasil, 1983).
Morphological description and analytical characterization
The parent material of the toposequence is mafic rock (gabbro), which extends from 385-462 m altitude. The profiles sampled in the toposequence were located at the summit (P1), shoulder (P2), backslope (P3) and footslope (P4); the slope gradient was 28, 28, 42 and 43 %, respectively. After morphological examination of profile trenches (Santos et al., 2005), disturbed and undisturbed samples were collected (Bullock et al., 1985) for laboratory analysis.
Soil samples were air dried, crumbled and sieved through a 2 mm mesh to obtain air dried fine earth (ADFE). The samples collected with a soil sampling ring were oven-dried at 105-110 oC for 24h. The physical properties determined were particle
Figure 1. Study area in Pinheiral, Rio de Janeiro state. Source: CIDE – Center of Information and Data of Rio de Janeiro.
VOLTA
REDONDA PINHEIRAL
ESPIRITO SANTO
MINAS GERAIS
SAO PAULO
O C E A N O A T L A N T I C O
30’ 44° 30’ 43° 30’ 42° 30’ 41°
30’
23° 30’
22° 21°
30’ 44° 30’ 43° 30’ 42° 30’ 41°
30’
23° 30’
size, clay naturally dispersed in water (Cw), bulk density (Bd), particle density (Pd), and flocculation degree (FD). Silt/clay ratio and total porosity (TP) were calculated according to the method of Claessen (1997). Chemical analysis, including soil pH in water and KCl and Ca2+, Mg2+, K+, Na+, Al3+, H+Al, P and organic C were determined according to Claessen (1997). The sum of bases (SB), CEC, base saturation (V) and percentage of Al saturation (m) were calculated. Laboratory analysis was performed in triplicate.
Air dried fine earth samples were subjected to sulfuric acid digestion for extraction of Fe, Al, and Ti, and silica was then extracted from the residue by NaOH dissolution (Claessen, 1997). The components extracted were expressed as oxides (Fe2O3, Al2O3, TiO2 and SiO2). To compare the content of Fe oxides extracted by different methods, Fe2O3 was analyzed as: i) Fes, when extracted by sulfuric acid digestion; ii) Fed (iron dithionite), when extracted by the dithionite citrate bicarbonate method (Mehra and Jackson, 1960), and iii) Feo (iron oxalate), when obtained by acid ammonium oxalate extraction, as proposed by Schwertmann and Fechter (1984) and modified by Schulze (1984).
Total SiO2, Al2O3, Fe2O3, TiO2, CaO, MgO, K2O, Mn, P2O5 and Zr levels were determined by X ray fluorescence at the Center of Scientific Instrumentation of the University of Granada (Spain). To that end, 0.6 g samples of ADFE were pretreated with 5.4 g of lithium tetraborate and heated to 1,100 °C in a Philips PERL’X3 furnace until fused and then cast as beads. The beads were analyzed using a Philips Magi X PRO wavelength dispersive X ray fluorescence (WD-XRF) spectrometer (PW 2440) equipped with a Rh-anode X ray tube operating at 4 kW (Hallett and Kyle, 1993). Carbonate losses were calculated by combusting 1 g of soil sample at 1,000 °C in a muffle furnace for 1 h. The total levels of the components were quantified and expressed as percentages; quantitative and semi-quantitative data analyses were performed using IQ+ software.
The clay fraction minerals were identified by X ray diffraction (XRD) of the oriented mounted glass slides prepared with clay suspension (<2.0 μm) dispersed in 1 mol L-1 NaOH (preserving the Fe oxides; Claessen, 1997). To obtain a Fe oxide-rich fraction and better visualization of characteristic oxide reflection peaks, the clay fraction samples were treated with 5 mol of L-1 NaOH solution, according to Norrish and Taylor (1961) and modified by Kämpf and Schwertmann (1982).
The analyses were conducted using a Bruker AXS D8 Advance X ray diffractometer that emitted Cu Kα radiation (λ = 0.015405 nm) from a copper tube (40 kV and 40 mA), with a scanning range of 1° 2θ min-1 (0.04°/s). Heating pretreatments to 550 °C and saturation with ethylene glycol (EGL) and dimethyl sulfoxide (DS) followed by X-ray irradiation were applied to samples presumed to contain 2:1 minerals. The sand fraction samples were ground in a ball mill to obtain crystalline powder. Non-oriented powder mounts were analyzed by XRD, in the same equipment used to identify clay minerals. The diffractograms were analyzed to identify minerals using 2004.04.67 PROX powder software (available at http://www.xpowder.com).
Thin sections were produced from undisturbed samples previously impregnated with polyester resin, as proposed by Murphy (1986). The sections were observed under a Zeiss polarizing optical microscope equipped with a binocular Wild magnifier, under plane polarized light (PPL) and cross-polarized light (PXL). Micromorphogical descriptions were in accordance with Brewer (1976) and Bullock et al. (1985).
RESULTS AND DISCUSSION
Morphological attributes
Profile P1 is located at the summit (28 % slope), P2 corresponds to the shoulder, P3 to the backslope and P4 to the footslope (28, 42 and 43 % slope, respectively) of the same convex-shaped hillslope.
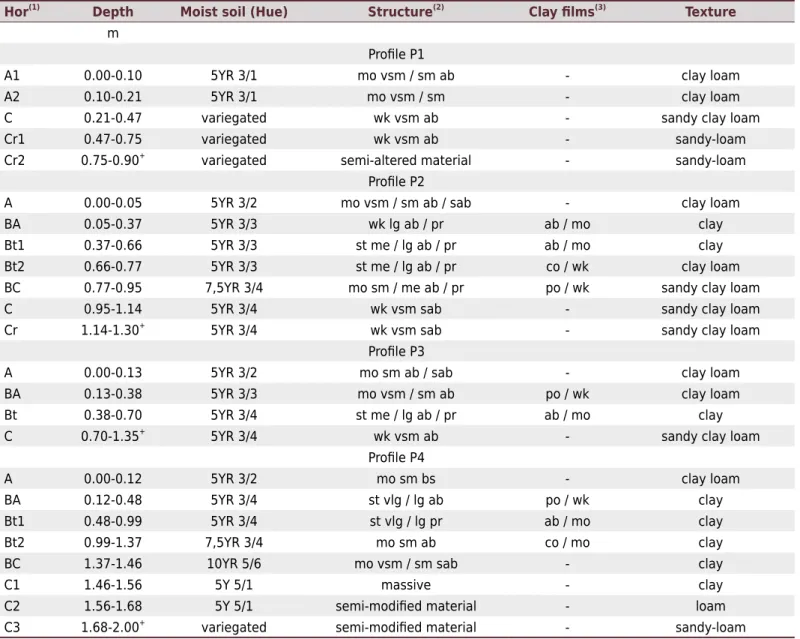
The morphological description of the soils (Table 1) indicates a predominance of brownish colors in both surface and subsurface horizons. According to Schwertmann (1971), red, yellow and brownish-red colors are determined by the different forms of Fe oxides in the soil. In a study about the influence of rock on soil, Lacerda et al. (2008) described a reddish color with hue of 2.5YR or even redder in the textural B horizon of a Chernossolo Argilúvico (Mollisol) derived from gabbro. The authors attributed this pattern to the parent material that favored hematite formation.
All the surface horizons contained aggregates shaped as angular and subangular blocks, with moderate development. In addition to blocky aggregates, the subsurface horizons of P2, P3 and P4 showed prismatic aggregates with strong to moderate development.
Table 1. Morphological attributes of soils in a toposequence in Pinheiral, RJ Hor(1)
Depth Moist soil (Hue) Structure(2)
Clay films(3)
Texture
m
Profile P1
A1 0.00-0.10 5YR 3/1 mo vsm / sm ab - clay loam
A2 0.10-0.21 5YR 3/1 mo vsm / sm - clay loam
C 0.21-0.47 variegated wk vsm ab - sandy clay loam
Cr1 0.47-0.75 variegated wk vsm ab - sandy-loam
Cr2 0.75-0.90+
variegated semi-altered material - sandy-loam
Profile P2
A 0.00-0.05 5YR 3/2 mo vsm / sm ab / sab - clay loam
BA 0.05-0.37 5YR 3/3 wk lg ab / pr ab / mo clay
Bt1 0.37-0.66 5YR 3/3 st me / lg ab / pr ab / mo clay
Bt2 0.66-0.77 5YR 3/3 st me / lg ab / pr co / wk clay loam
BC 0.77-0.95 7,5YR 3/4 mo sm / me ab / pr po / wk sandy clay loam
C 0.95-1.14 5YR 3/4 wk vsm sab - sandy clay loam
Cr 1.14-1.30+
5YR 3/4 wk vsm sab - sandy clay loam
Profile P3
A 0.00-0.13 5YR 3/2 mo sm ab / sab - clay loam
BA 0.13-0.38 5YR 3/3 mo vsm / sm ab po / wk clay loam
Bt 0.38-0.70 5YR 3/4 st me / lg ab / pr ab / mo clay
C 0.70-1.35+ 5YR 3/4 wk vsm ab - sandy clay loam
Profile P4
A 0.00-0.12 5YR 3/2 mo sm bs - clay loam
BA 0.12-0.48 5YR 3/4 st vlg / lg ab po / wk clay
Bt1 0.48-0.99 5YR 3/4 st vlg / lg pr ab / mo clay
Bt2 0.99-1.37 7,5YR 3/4 mo sm ab co / mo clay
BC 1.37-1.46 10YR 5/6 mo vsm / sm sab - clay
C1 1.46-1.56 5Y 5/1 massive - clay
C2 1.56-1.68 5Y 5/1 semi-modified material - loam
C3 1.68-2.00+ variegated semi-modified material - sandy-loam
(1)
Horizon (Hor). (2)
Only the C horizon showed poor aggregate development. Prismatic aggregates may be related to the presence of 2:1 clay minerals. According to Silva (1993), these prisms are formed when soil remains wet and expanded for a long period of time.
A clay loam texture was dominant in P1, and clay texture in the B horizons of P2, P3 and P4. In general, clay content was not very high, considering that the profiles derive from a mafic material (gabbro) with easy weathering. The mafic minerals contained in gabbro have a small particle size, as observed in petrographic thin sections (Santos, 2009), the texture reflecting the small degree of soil weathering.
Physical and chemical attributes
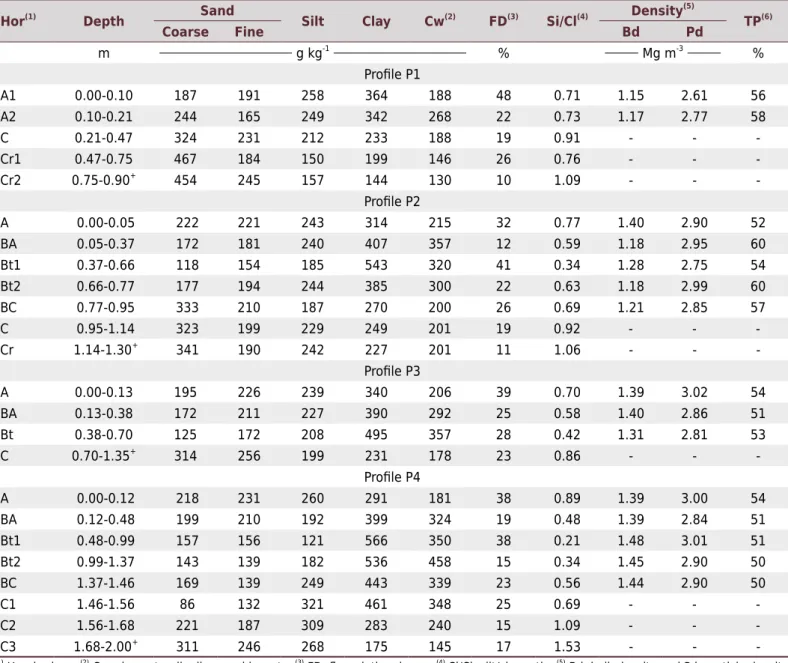
Particle density (Pd) ranged from 2.61-3.02 Mg m-3 (Table 2). According to Schwertmann and Taylor (1989), high Pd indicates the presence of high-density minerals such as hematite and goethite. In addition to these oxides, the soils in the toposequence showed minerals with Ti and Zr, which contribute to an increase in Pd due to their high specific weight. In profiles P2, P3 and P4, clay content increased with depth, characterizing a textural B horizon (Santos et al., 2013). An inverse pattern was observed in P1, with clay
Table 2. Physical attributes of soil profiles in a toposequence in Pinheiral, RJ
(1)
Hor: horizon. (2)
Cw: clay naturally dispersed in water.(3) FD: flocculation degree.(4)
Si/Cl: silt/clay ratio. (5)
Bd: bulk density and Pd: particle density. (6)
TP: total porosity. P1: summit; P2: shoulder; P3: backslope; P4: footslope.
Hor(1)
Depth Sand Silt Clay Cw(2)
FD(3)
Si/Cl(4) Density (5)
TP(6)
Coarse Fine Bd Pd
m g kg-1
% Mg m-3
%
Profile P1
A1 0.00-0.10 187 191 258 364 188 48 0.71 1.15 2.61 56
A2 0.10-0.21 244 165 249 342 268 22 0.73 1.17 2.77 58
C 0.21-0.47 324 231 212 233 188 19 0.91 - -
-Cr1 0.47-0.75 467 184 150 199 146 26 0.76 - -
-Cr2 0.75-0.90+
454 245 157 144 130 10 1.09 - -
-Profile P2
A 0.00-0.05 222 221 243 314 215 32 0.77 1.40 2.90 52
BA 0.05-0.37 172 181 240 407 357 12 0.59 1.18 2.95 60
Bt1 0.37-0.66 118 154 185 543 320 41 0.34 1.28 2.75 54
Bt2 0.66-0.77 177 194 244 385 300 22 0.63 1.18 2.99 60
BC 0.77-0.95 333 210 187 270 200 26 0.69 1.21 2.85 57
C 0.95-1.14 323 199 229 249 201 19 0.92 - -
-Cr 1.14-1.30+
341 190 242 227 201 11 1.06 - -
-Profile P3
A 0.00-0.13 195 226 239 340 206 39 0.70 1.39 3.02 54
BA 0.13-0.38 172 211 227 390 292 25 0.58 1.40 2.86 51
Bt 0.38-0.70 125 172 208 495 357 28 0.42 1.31 2.81 53
C 0.70-1.35+
314 256 199 231 178 23 0.86 - -
-Profile P4
A 0.00-0.12 218 231 260 291 181 38 0.89 1.39 3.00 54
BA 0.12-0.48 199 210 192 399 324 19 0.48 1.39 2.84 51
Bt1 0.48-0.99 157 156 121 566 350 38 0.21 1.48 3.01 51
Bt2 0.99-1.37 143 139 182 536 458 15 0.34 1.45 2.90 50
BC 1.37-1.46 169 139 249 443 339 23 0.56 1.44 2.90 50
C1 1.46-1.56 86 132 321 461 348 25 0.69 - -
-C2 1.56-1.68 221 187 309 283 240 15 1.09 - -
-C3 1.68-2.00+
-levels decreasing with depth. Because P1 corresponds to poorly developed soil, surface horizons are expected to exhibit higher clay levels, caused by alteration of the parent material, because they are more exposed to weathering.
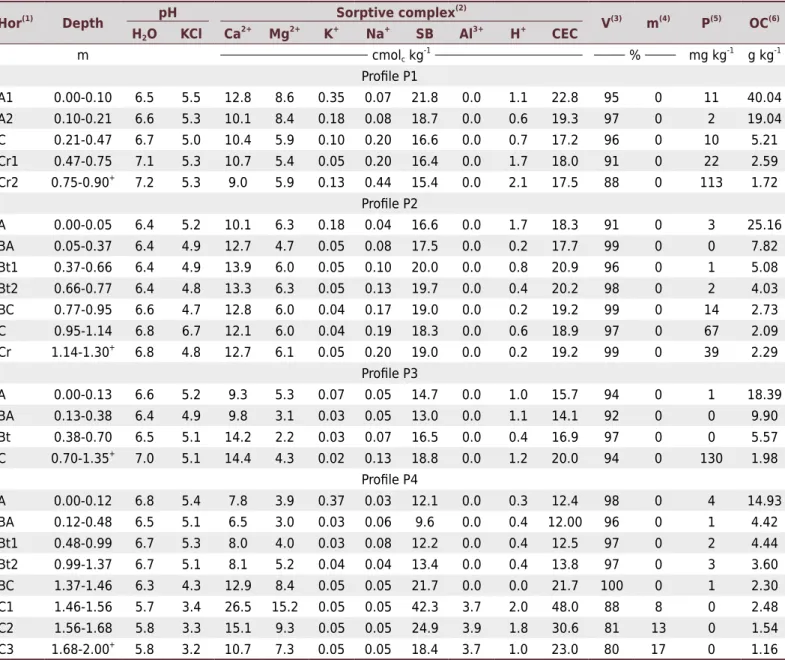
In all the profiles, the pH values in KCl solution were lower than those obtained in water, indicating a net negative charge (Table 3). Soil pH in water ranged from 5.7 to 7.2, base saturation was high and the main component of the sorptive complex was Ca followed by Mg. The high CEC values, ranging from 32 to 59 cmolc kg
-1 clay, characterize high-activity clay soils (CEC ≥7 cmolc kg-1 clay) (Santos et al., 2013). In P2, P3 and P4, high-activity clays explain morphological features such as cracking, the prismatic structure and some friction surfaces typical of soils with significant participation of 2:1 clay minerals. High-activity clay soils commonly contain high levels of exchangeable Ca and Mg, likely because they are present in the structure of vermiculites and montmorillonites (Kämpf and Curi, 2003). Ibraimo et al. (2004) observed that the CEC of a Luvissolo Crômico (Alfisol) showed Mg saturation ranging from 23 to 63 %, and suggested that the high ion levels result from destabilization of 2:1 clays under conditions that favor the displacement of Mg ions occupying the octahedral position. Similar to the toposequence studied,
Table 3. Chemical attributes of soil profiles in a toposequence in Pinheiral, RJ Hor(1) Depth pH Sorptive complex
(2)
V(3) m(4) P(5) OC(6) H2O KCl Ca
2+
Mg2+
K+
Na+
SB Al3+
H+
CEC
m cmolc kg
-1
% mg kg-1
g kg-1 Profile P1
A1 0.00-0.10 6.5 5.5 12.8 8.6 0.35 0.07 21.8 0.0 1.1 22.8 95 0 11 40.04 A2 0.10-0.21 6.6 5.3 10.1 8.4 0.18 0.08 18.7 0.0 0.6 19.3 97 0 2 19.04 C 0.21-0.47 6.7 5.0 10.4 5.9 0.10 0.20 16.6 0.0 0.7 17.2 96 0 10 5.21 Cr1 0.47-0.75 7.1 5.3 10.7 5.4 0.05 0.20 16.4 0.0 1.7 18.0 91 0 22 2.59 Cr2 0.75-0.90+
7.2 5.3 9.0 5.9 0.13 0.44 15.4 0.0 2.1 17.5 88 0 113 1.72
Profile P2
A 0.00-0.05 6.4 5.2 10.1 6.3 0.18 0.04 16.6 0.0 1.7 18.3 91 0 3 25.16 BA 0.05-0.37 6.4 4.9 12.7 4.7 0.05 0.08 17.5 0.0 0.2 17.7 99 0 0 7.82 Bt1 0.37-0.66 6.4 4.9 13.9 6.0 0.05 0.10 20.0 0.0 0.8 20.9 96 0 1 5.08 Bt2 0.66-0.77 6.4 4.8 13.3 6.3 0.05 0.13 19.7 0.0 0.4 20.2 98 0 2 4.03 BC 0.77-0.95 6.6 4.7 12.8 6.0 0.04 0.17 19.0 0.0 0.2 19.2 99 0 14 2.73 C 0.95-1.14 6.8 6.7 12.1 6.0 0.04 0.19 18.3 0.0 0.6 18.9 97 0 67 2.09 Cr 1.14-1.30+
6.8 4.8 12.7 6.1 0.05 0.20 19.0 0.0 0.2 19.2 99 0 39 2.29
Profile P3
A 0.00-0.13 6.6 5.2 9.3 5.3 0.07 0.05 14.7 0.0 1.0 15.7 94 0 1 18.39 BA 0.13-0.38 6.4 4.9 9.8 3.1 0.03 0.05 13.0 0.0 1.1 14.1 92 0 0 9.90 Bt 0.38-0.70 6.5 5.1 14.2 2.2 0.03 0.07 16.5 0.0 0.4 16.9 97 0 0 5.57 C 0.70-1.35+ 7.0 5.1 14.4 4.3 0.02 0.13 18.8 0.0 1.2 20.0 94 0 130 1.98
Profile P4
A 0.00-0.12 6.8 5.4 7.8 3.9 0.37 0.03 12.1 0.0 0.3 12.4 98 0 4 14.93 BA 0.12-0.48 6.5 5.1 6.5 3.0 0.03 0.06 9.6 0.0 0.4 12.00 96 0 1 4.42 Bt1 0.48-0.99 6.7 5.3 8.0 4.0 0.03 0.08 12.2 0.0 0.4 12.5 97 0 2 4.44 Bt2 0.99-1.37 6.7 5.1 8.1 5.2 0.04 0.04 13.4 0.0 0.4 13.8 97 0 3 3.60 BC 1.37-1.46 6.3 4.3 12.9 8.4 0.05 0.05 21.7 0.0 0.0 21.7 100 0 1 2.30 C1 1.46-1.56 5.7 3.4 26.5 15.2 0.05 0.05 42.3 3.7 2.0 48.0 88 8 0 2.48 C2 1.56-1.68 5.8 3.3 15.1 9.3 0.05 0.05 24.9 3.9 1.8 30.6 81 13 0 1.54 C3 1.68-2.00+ 5.8 3.2 10.7 7.3 0.05 0.05 18.4 3.7 1.0 23.0 80 17 0 1.16 (1)
Hor: horizon. (2) SB: sum of bases. CEC: cation exchange capacity at pH=7. (3)
V: base saturation. (4)
m: aluminum saturation. (5)
P: extractor Mehlich-1. (6)
Lacerda et al. (2008) found high base saturation (79 to 87 cmolc kg-1), CEC of 17-19.4 cmolc kg
-1, organic carbon of 21 g kg-1 and clay CEC of 37 cmol c kg
-1 in a Chernossolo
Argilúvico (Mollisol) derived from gabbro.
The profiles contained high organic C levels, decreasing with depth. In high clay activity soils, organic matter build up results from the very stable clay-humic complexes formed in a base-rich condition (Stevenson, 1994; Anjos et al., 1999). Here, base saturation was close to 100 %, whereas Al saturation (m) was nil, except for C horizon from P4.
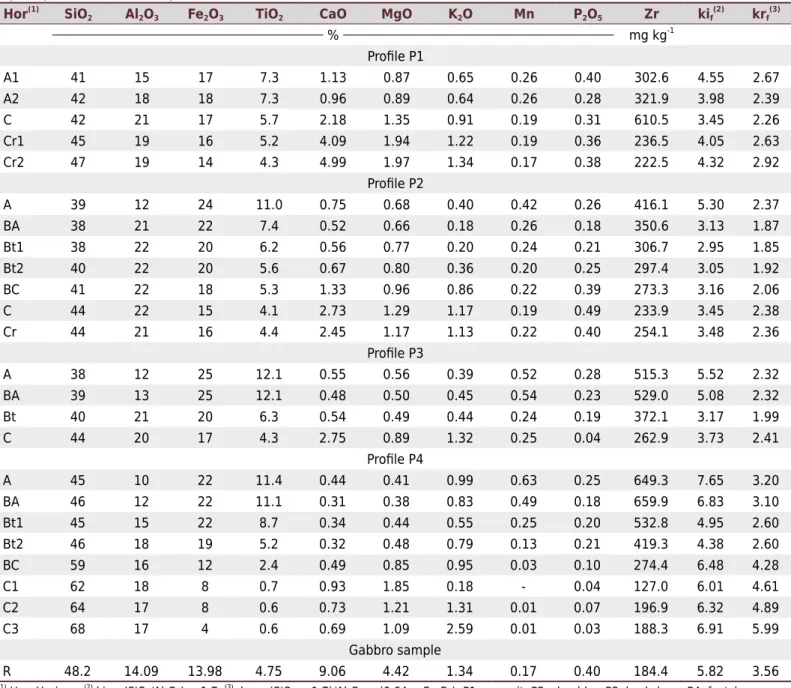
The proportion of SiO2 in the parent material (48.2 %) (Table 4) suggests a slight accumulation of this oxide during soil genesis, with silica variation at depth accompanying fluctuations in sand content (Table 4). Characterizing soils in a sequence in São Paulo state, Ibrahim (2002) detected the highest Si levels in surface horizons, finding that they were inversely proportional to clay content and directly proportional to sand and silt (related to the significant amount of quartz in these fractions).
Table 4. Elements expressed as oxides, detected by X ray fluorescence (f), and molecular relationships kif and krf of soils in a
toposequence in Pinheiral, RJ
(1)
Hor: Horizon. (2)
kif = (SiO2/Al2O3) × 1.7. (3)
krf = (SiO2 × 1.7)/Al2O3 + (0.64 × Fe2O3). P1: summit; P2: shoulder; P3: backslope; P4: footslope.
Hor(1)
SiO2 Al2O3 Fe2O3 TiO2 CaO MgO K2O Mn P2O5 Zr kif(2) krf(3)
% mg kg-1
Profile P1
A1 41 15 17 7.3 1.13 0.87 0.65 0.26 0.40 302.6 4.55 2.67
A2 42 18 18 7.3 0.96 0.89 0.64 0.26 0.28 321.9 3.98 2.39
C 42 21 17 5.7 2.18 1.35 0.91 0.19 0.31 610.5 3.45 2.26
Cr1 45 19 16 5.2 4.09 1.94 1.22 0.19 0.36 236.5 4.05 2.63
Cr2 47 19 14 4.3 4.99 1.97 1.34 0.17 0.38 222.5 4.32 2.92
Profile P2
A 39 12 24 11.0 0.75 0.68 0.40 0.42 0.26 416.1 5.30 2.37
BA 38 21 22 7.4 0.52 0.66 0.18 0.26 0.18 350.6 3.13 1.87
Bt1 38 22 20 6.2 0.56 0.77 0.20 0.24 0.21 306.7 2.95 1.85
Bt2 40 22 20 5.6 0.67 0.80 0.36 0.20 0.25 297.4 3.05 1.92
BC 41 22 18 5.3 1.33 0.96 0.86 0.22 0.39 273.3 3.16 2.06
C 44 22 15 4.1 2.73 1.29 1.17 0.19 0.49 233.9 3.45 2.38
Cr 44 21 16 4.4 2.45 1.17 1.13 0.22 0.40 254.1 3.48 2.36
Profile P3
A 38 12 25 12.1 0.55 0.56 0.39 0.52 0.28 515.3 5.52 2.32
BA 39 13 25 12.1 0.48 0.50 0.45 0.54 0.23 529.0 5.08 2.32
Bt 40 21 20 6.3 0.54 0.49 0.44 0.24 0.19 372.1 3.17 1.99
C 44 20 17 4.3 2.75 0.89 1.32 0.25 0.04 262.9 3.73 2.41
Profile P4
A 45 10 22 11.4 0.44 0.41 0.99 0.63 0.25 649.3 7.65 3.20
BA 46 12 22 11.1 0.31 0.38 0.83 0.49 0.18 659.9 6.83 3.10
Bt1 45 15 22 8.7 0.34 0.44 0.55 0.25 0.20 532.8 4.95 2.60
Bt2 46 18 19 5.2 0.32 0.48 0.79 0.13 0.21 419.3 4.38 2.60
BC 59 16 12 2.4 0.49 0.85 0.95 0.03 0.10 274.4 6.48 4.28
C1 62 18 8 0.7 0.93 1.85 0.18 - 0.04 127.0 6.01 4.61
C2 64 17 8 0.6 0.73 1.21 1.31 0.01 0.07 196.9 6.32 4.89
C3 68 17 4 0.6 0.69 1.09 2.59 0.01 0.03 188.3 6.91 5.99
Gabbro sample
Aluminum levels determined by the fluorescence method (Table 4) increased with depth and were slightly higher than those found in the parent rock (13.9 %). Fe levels, also determined by fluorescence, exhibited an inverse pattern, decreasing with depth (Table 4). Given that X ray fluorescence is not efficient in quantifying Fe in the crystalline structure of ilmenite, the pattern described can be attributed to the higher ilmenite content in subsurface horizons.
The contents of Ca, Mg and K were lower in the profiles studied than in the parent rock, and higher in the subsurface than in surface horizons, except in P1. In a study in Minas Gerais state, Albuquerque Filho et al. (2008) found that the chemical composition of the parent rock affected soil properties because the richness of the mafic mineral in saprolite increased the levels of exchangeable bases in subsurface horizons. However, Ca loss was higher than Mg, which suggests selective ion removal. In a study on the genesis of soils in Northern Minas Gerais, Oliveira (1999) also observed lower Mg mobility in relation to Ca.
The profiles showed a tendency of residual accumulation of Ti and Zr that decreased with depth (Table 4). According to Sivarajasingham et al. (1962), Ti can reach significant proportions in soil, representing a relative accumulation in relation to the parent material. Since Ti oxide is resistant to weathering, it can remain in the coarse fraction of soil, as a primary mineral (ilmenite and rutile), or even in the clay fraction, in the form of anatase or leucoxene (Fonseca, 1986). The P contents in the rock were low, similar to that described in Northern Minas Gerais (Oliveira, 1999).
The Mn levels determined by fluorescence were also higher in the profiles than in the parent rock (Table 4), which may be related to the significant occurrence of Ti oxides in the toposequence. Ilmenite is composed of Fe and Ti in crystalline form and can contain small amounts of Mn and Mg (Dana, 1969). The subsurface horizons of P4 exhibited lower Mn levels, possibly because the high humidity promoted by the slope position favors Mn reduction followed by its removal from soil. Soil Mn is usually bound to insoluble oxyhydroxides and/or oxyhydroxides chelated by organic matter (Sousa et al., 2004), but in high-humidity environments, manganese (VIII) oxide (Mn4+) is reduced to manganese (II) oxide (Mn2+), increasing its solubility (Ponnamperuma, 1972). Under high humidity, soil Mn levels tend to be lower than those of Fe. According to Resende et al. (2002), Mn declines faster than Fe, and its re-oxidation is slower.
Total elements and extractable Fe forms (Fef, Fed and Feo)
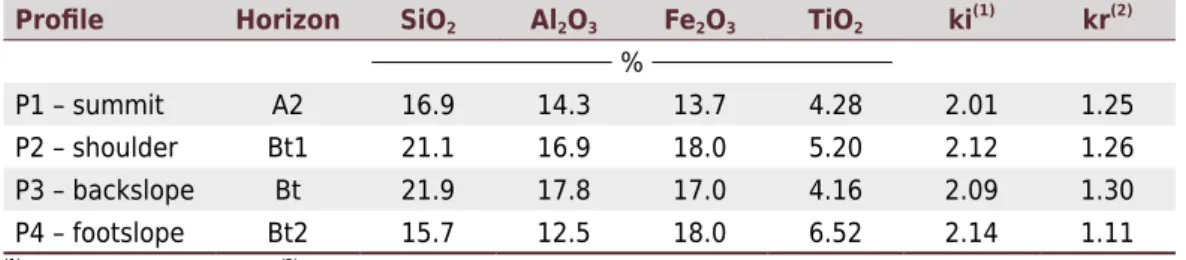
The soils studied showed ki above 2.0 (Table 5), likely because clay minerals of the profiles (and parent material) contained high Si levels associated with a low silica removal rate. This result is in line with a CEC clay value above 27 cmolc kg
-1
, confirming the occurrence of 2:1 clay and a small degree of soil weathering. Among the profiles of the toposequence, P4 (footslope) showed the highest ki. In a study in Itaguaí, RJ, Silva (1993) found higher ki in profiles from the lower portion of a slope, where the accumulation of silica-rich solutions promoted re-silification of clay minerals and neoformation of 2:1 clays. Here, kr values were also above 0.75.
Table 5. Element levels, expressed as oxides extracted by sulfuric acid digestion (1:1) and molecular
relationships ki and kr in soil horizons from a toposequence in Pinheiral, RJ
Profile Horizon SiO2 Al2O3 Fe2O3 TiO2 ki
(1)
kr(2)
%
P1 – summit A2 16.9 14.3 13.7 4.28 2.01 1.25
P2 – shoulder Bt1 21.1 16.9 18.0 5.20 2.12 1.26
P3 – backslope Bt 21.9 17.8 17.0 4.16 2.09 1.30
P4 – footslope Bt2 15.7 12.5 18.0 6.52 2.14 1.11 (1) ki = (SiO
2/Al2O3) × 1.7.
(2) kr = (SiO
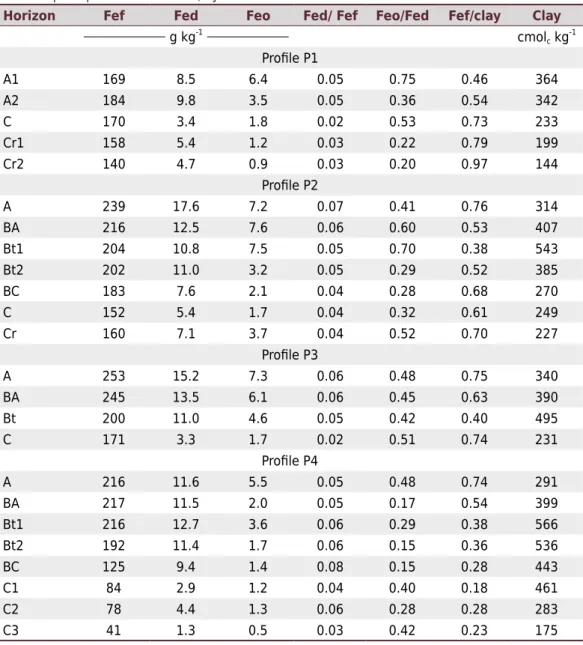
Surface and transitional horizons, which have higher C, showed higher levels of Feo (Table 6). They also exhibited higher Fed levels, except for P1. This result indicates the low degree of pedogenic evolution of these soils. In a study on the genesis of volcanic rocks in Ethiopia, Abayneh et al. (2006) observed high Feo values, ferrihydrite being one of the main oxide forms.
In accordance with data on a Neossolo (Entisol) studied by Campos et al. (2007) in Pereira Barreto, São Paulo state, the profiles studied contained a low Fed/Fef ratio, which decreased with depth. The low ratio suggests that Fe occurs mostly in the crystalline structure of the primary soil minerals, especially pyroxenes, feldspars and ilmenite. The Feo/Fed ratio, in turn, expresses oxides with low crystallinity. In a study with soils from different regions of Brazil, Valladares (2000) found that the Feo/Fed ratio in Chernossolos (Mollisols) was high in the superficial horizons, and decreased with depth.
The Fef/clay ratio in the profiles studied increased with depth, except for P4. The highest ratios were obtained in P1, reinforcing the relationship between Fe determination by X ray fluorescence and Fe content in primary minerals, sand and silt fractions. The high Fef/clay ratio and significant variation with depth suggests that the Fe content of diagnostic horizons is mainly associated with primary minerals inherited from parent
Table 6. Iron levels determined by X ray fluorescence (Fef), extracted with dithionite citrate
bicarbonate (Fed) and acid ammonium oxalate (Feo) and their relationship with clay in soil horizons
from a toposequence in Pinheiral, RJ
Horizon Fef Fed Feo Fed/ Fef Feo/Fed Fef/clay Clay
g kg-1
cmolc kg-1 Profile P1
A1 169 8.5 6.4 0.05 0.75 0.46 364
A2 184 9.8 3.5 0.05 0.36 0.54 342
C 170 3.4 1.8 0.02 0.53 0.73 233
Cr1 158 5.4 1.2 0.03 0.22 0.79 199
Cr2 140 4.7 0.9 0.03 0.20 0.97 144
Profile P2
A 239 17.6 7.2 0.07 0.41 0.76 314
BA 216 12.5 7.6 0.06 0.60 0.53 407
Bt1 204 10.8 7.5 0.05 0.70 0.38 543
Bt2 202 11.0 3.2 0.05 0.29 0.52 385
BC 183 7.6 2.1 0.04 0.28 0.68 270
C 152 5.4 1.7 0.04 0.32 0.61 249
Cr 160 7.1 3.7 0.04 0.52 0.70 227
Profile P3
A 253 15.2 7.3 0.06 0.48 0.75 340
BA 245 13.5 6.1 0.06 0.45 0.63 390
Bt 200 11.0 4.6 0.05 0.42 0.40 495
C 171 3.3 1.7 0.02 0.51 0.74 231
Profile P4
A 216 11.6 5.5 0.05 0.48 0.74 291
BA 217 11.5 2.0 0.05 0.17 0.54 399
Bt1 216 12.7 3.6 0.06 0.29 0.38 566
Bt2 192 11.4 1.7 0.06 0.15 0.36 536
BC 125 9.4 1.4 0.08 0.15 0.28 443
C1 84 2.9 1.2 0.04 0.40 0.18 461
C2 78 4.4 1.3 0.06 0.28 0.28 283
materials rather than the products of weathering and pedogenic Fe oxide formation. In a study on the role of Fe as an indicator of pedogenesis in a humid tropical area in Mérida, Venezuela, Ochoa et al. (2000) found a Fet/clay ratio close to 1.0, suggesting that the high Fe levels were related to its release due to changes in parent material and not to the migration of the Fe-clay complex.
Sand and clay fraction mineralogy and iron oxides
In all the profiles, XRD analyses identified quartz, feldspars (especially calcic), pyroxenes and small reflections of ilmenite inherited from the parent rock. The intensity of the feldspar and pyroxene reflections decreased from the upper to the lower portion of the slope, indicating higher alteration of soil minerals at the bottom of the slope.
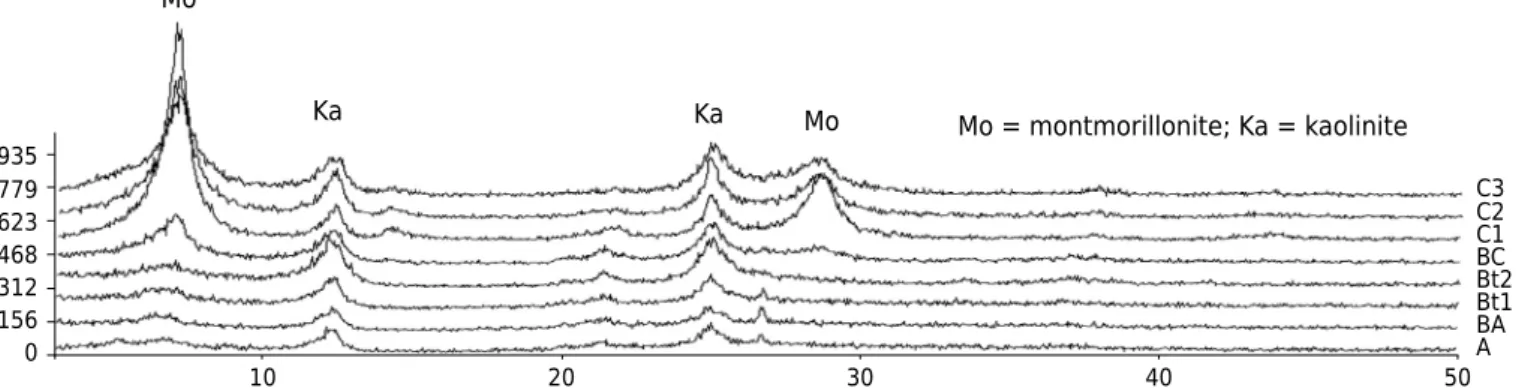
The clay fraction of the profiles exhibited a predominance of kaolinite, followed by 2:1 interstratified minerals (illite-montmorillonite). The characteristic reflections of the minerals were wide, suggesting slight crystallization or structural disorder. Soils from humid tropical areas usually contain kaolinite with low crystallinity or a high degree of structural disorder (Hughes and Brown, 1979).
The montmorillonite reflections observed in P4 (Figure 2) showed higher definition and intensity, indicating higher crystallinity in the footslope. In the toposequence studied, the occurrence of montmorillonite seemed to be related to mineral transformation in a poorly leached soil; that is, the mineral is preserved in a pedoenvironment rich in Si, Al, Mg and Fe. In addition, smectites can also be formed by neogenesis; that is, by Al, Si and bases released from weathering of silicate minerals (viz. magnesian olivine, hornblende and feldspar) associated with moderate silica leaching (Reid-Soukup and Ulrey, 2002).
Goethite was the predominant oxide in the profiles, indicated by the wide and narrow reflections, also exhibiting oxides with low crystallinity such as lepidocrocite and ferrihydrite (Figure 3). The diagnostic reflections with the highest intensity were observed at 0.418 nm (20.10° 2θ) and 0.245 nm (30.70° 2θ), reinforcing the relative abundance of goethite. Hematite was identified by low-intensity diagnostic reflections in the diffractogram region between 0.267 nm (30.30° 2θ), 0.251 nm (30.60° 2θ) and 0.169 nm (50.40° 2θ). Only P4 samples showed larger and more defined oxide reflections, indicating higher crystallinity. This soil also showed a lower Feo/Fed ratio than the others. Oxide crystallinity can be explained by the lower levels of organic matter in the profile, since the humic fraction inhibits the crystallization of Fe oxides. Another aspect to consider is the profile position on the footslope, which favors lateral water flow and Fe input from upper sections of the landscape.
Soil micromorphology
The morphological description of the horizons selected is summarized in table 7. The coarse fraction of the soils is composed of K feldspar (orthoclase) and Na-Ca feldspars (plagioclase)
Figure 2. X ray diffractogram of clay fractions from soil profile P4.
Mo
Mo
Ka Ka Mo = montmorillonite; Ka = kaolinite
C3 C2 C1 BC Bt2 Bt1 BA A 935
779 623 468 312 156 0
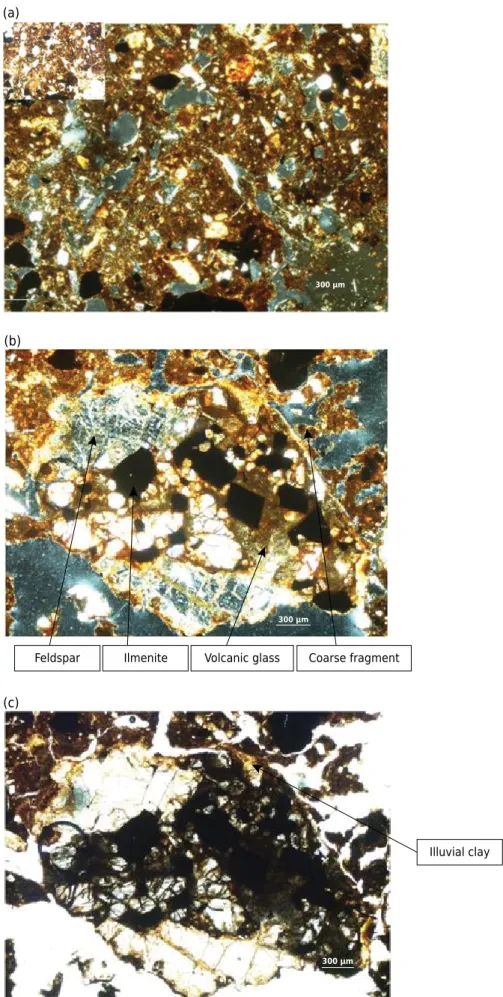
at different alteration stages and showing signs of dissolution processes (Figure 4). The ilmenite content was higher than that of magnetite. Pyroxenes occurred at low levels, as did quartz, except for P4 horizons. Volcanic glass, which was also observed, is likely inherited from the parent material, given that it was also found in the rock (Figure 4).
The relative distribution of fine and coarse particles in the matrix was mostly porphyric (i.e. predominantly single-spaced but also double-spaced). Only horizon A2 of P1 exhibited open porphyric distribution. Double-spaced porphyric distribution was observed in horizons BA and Bt of P2, but in deeper horizons the pattern opened to single-spaced porphyric (Figure 5). Granulometric analysis showed a higher clay content in horizons BA and Bt, which likely contributed to forming a denser distribution pattern.
The profiles exhibited low, frequent or dominant speckled and striated (mono-, poro- or granostriated) birefringence fabric (b-fabric, Table 7). Frequent and dominant speckled and striated b-fabric is usually associated with the presence of stress argillans (pressure argillans), which provide soil with the shining aspect observed in the field (clay skins). This feature was enhanced in the toposequence under study by the presence of 2:1 clay minerals in the soils.
The dominant microstructure of the profiles consisted of angular and subangular blocky aggregates (peds) with moderate to strong development. Porosity consisted of planar voids (fissures) with cavities produced by the dissolution of primary minerals. Asthis process intensifies, the cavities become connected, and the relative distribution develops to an open pattern. The dissolution process that produces the cavities, however, contributes to the illuviation process, which tends to increase and cover larger extensions of pore walls (Vidal-Torrado et al., 2006).
Illuviation features are characterized by a high occurrence of clay, silt and Fe coatings and infillings, and a lower frequency of Fe hypo-coatings. These pedofeatures, however, are more common in larger aggregates, composed of sand-sized minerals (Figure 6). Illuviation argillans are usually fragmented and deformed into papules, suggesting the strong action of 2:1 clay minerals on pedoturbation, by contraction/expansion cycles (Figure 6). As this process advances, both fragments of illuviated clay and stress-oriented clay (b-fabric) can be incorporated into the soil groundmass, destroying signs of illuviation.
Among the aggregates formed by larger particles, illuviation features were preserved in abundance because their components were not affected by contraction/expansion cycles. The Bi2 horizon of P2 exhibited three illuviation phases (Figure 6): a) clay illuviation (gray), b) migration of clay with low Fe content (orange), and c) clay illuviation with large Fe content (deep red). In a micromorphological characterization of Paleosols with Btg horizon from mid-Pleistocene times in Northern Italy, Kuhn et al. (2006) also identified three stages of clay illuviation, the first being clay illuviation associated with the silt
Figure 3. X ray diffractogram of oxide fractions from soil profile P4. Go: goethite, He: hematite, Il: ilmenite, Mg: maghemite, Mo:
montmorillonite, Mi: mica. Mo
Mi Go
Mi
Go
He
GoIl Il
Mg Il
Bt2 Bt1 BA 70
59
47 35 23 12
0
Table 7. Micromorphological description of the horizons selected from soils in the toposequence
Hor(1) Minerals in the coarse fraction(2)
Pattern of relative distribution
b-fabric(2)
Microstructure Pores Pedofeatures(3)
Profile P1 A2 Scarce: pyroxene, potassium
feldspar and quartz. Frequent: plagioclase feldspars, ilmenite and magnetite
Open porphyric Speckled with weak orientation; frequent Moderately developed angular and subangular blocks
Planar void Very abundant typic and crescent coatings of clay, numerous clay + Fe coatings, occasional typic hypo-coatings of Fe covering external particle surface, numerous dense clay-Fe infilling, abundant typic and concentric nodules of Fe and occasional pseudomorphic nodules of feldspars,
chalcedony and quartz, abundant papules Profile P2
BA Scarce: pyroxene, potassium feldspar and quartz
Frequent: plagioclase feldspars, ilmenite and magnetite Double-spaced porphyric Speckled and parallel striated with strong orientation; frequent Strongly developed angular blocks Planar void and a few cavities
Numerous typic coatings of clay and Fe, occasional external typic hypo-coatings of Fe covering external pore and particle surface, numerous dense infillings of clay+silt+Fe, numerous typic Fe nodules and pseudomorphic nodules of magnetite, abundant papules Bt1 Scarce: potassium feldspar
and quartz Frequent: plagioclase feldspars, ilmenite and magnetite
Double-spaced porphyric Speckled and parallel striated with weak orientation; frequent Strongly developed angular blocks Planar void and a few cavities
Numerous typic coatings de clay and Fe, occasional typic hypo-coatings hypo-coatings of Fe covering external pore and particle surface, numerous dense infillings of clay+silt+Fe, abundant typic Fe nodules and pseudomorphic nodules of magnetite and ilmenite, abundant papules Bt2 Scarce: potassium feldspar
and quartz. Frequent: plagioclase feldspars and ilmenite. Common: magnetite Single-spaced porphyric Speckled and parallel striated with strong orientation; very dominant Strongly developed angular blocks Planar void and a few cavities
Abundant typic and crescent coatings of clay and Fe, occasional typic hypo-coatings of Fe, numerous dense infillings of clay+silt+Fe, abundant typic Fe nodules and pseudomorphic nodules of magnetite and ilmenite, abundant papules BC Scarce: potassium feldspar
and quartz. Frequent: plagioclase feldspars. Common: ilmenite and magnetite Single-spaced porphyric Speckled and parallel striated with strong orientation; dominant Moderately developed angular blocks Planar void and a few cavities
Numerous typic and crescent coatings of clay and Fe covering the particles, occasional typic hypo-coatings of Fe, numerous dense infillings of clay+silt+Fe, abundant typic Fe nodules and pseudomorphic nodules of magnetite and ilmenite, occasional papules Profile P3
A Scarce: pyroxene, potassium feldspar and quartz
Frequent: sodium-calcium plagioclase, ilmenite and magnetite Single-spaced porphyric Speckled with weak orientation; very scarce Moderately developed angular blocks Planar void and a few cavities
Abundant typic and nodules of Fe, pseudomorphic nodules of magnetite and ilmenite, occasional ellipsoidal excrements and papules
BA Very scarce: pyroxene Scarce: potassium feldspar and quartz
Frequent: plagioclase feldspars, ilmenite and magnetite Single-spaced porphyric Speckled and mono striated with weak orientation; scarce Moderately developed angular blocks Planar void and a few cavities
fraction. Therefore, fractions with larger particle size decrease with soil evolution; only clay remains in the second illuviation stage. In the third stage, Fe and clay hypo-coatings are formed due to wetting and drying cycles, without a clear sign of the coarse material.
Iron hypo-coatings were observed in P1, P2 and P3 (Table 7). According to Brewer (1976), they result from the in situ reorganization or plastic deformation of the fabric induced by wetting/drying cycles. The frequency of Fe compounds in the form of crystalline nodules, mainly amorphous, was high (Table 7). Since the soils exhibit little weathering, the Fe content derives from the transformation of primary materials associated with low acidity and the preservation of bases in a soil solution. These conditions lead to the preservation of Fe in the system and precipitation, forming coatings, hypo-coatings, infillings and nodules (Figures 5 and 6).
Thus, lateral water flow associated with the convex shape of the toposequence and mineralogy of 2:1 clays in the profiles has a strong effect on the illuviation process and formation of stress argillans by the wetting/drying cycles.
The micromorphological description of the horizons in the toposequence under study shows: a) the minor alteration of the primary minerals; b) Fe release from weathering of the minerals; and c) frequent illuviation processes. The common occurrence of illuviation argillans indicates that these pedofeatures are identified as clay skins in field descriptions of the profiles. In horizons Ap from P3 and A2 from P1, micromorphological Continuation
Bt Scarce: feldspar and quartz Frequent: ilmenite and magnetite Single-spaced porphyric Speckled and mono striated with strong orientation; frequent Moderately developed angular blocks Planar void and a few cavities
Numerous typic coatings of clay and Fe, occasional typic hypo-coatings of Fe, dense infillings of clay+silt+Fe, abundant typic Fe nodules and pseudomorphic nodules of chalcedony, magnetite and ilmenite, numerous papules Profile P4
BA Scarce: feldspar and quartz Frequent: ilmenite and magnetite Single-spaced porphyric Speckled with weakorientation; scarce Moderately developed angular blocks Planar void and cavities
Occasional typic and crescent coatings of clay and Fe, rare dense infillings of clay+silt+Fe, abundant typic Fe nodules and pseudomorphs of magnetite and ilmenite
Bt1 Scarce: feldspar Common: ilmenite and magnetite Dominant: quartz Single-spaced porphyric Speckled with moderate orientation; frequent Moderately developed angular blocks Planar void and cavities
Abundant typic and crescent coatings of clay and Fe, numerous dense infillings of clay+silt+Fe, abundant typic Fe nodules and pseudomorphic nodules of chalcedony and magnetite Bt2 Frequent: feldspar
Common: ilmenite, magnetite and quartz
Double-spaced porphyric Porostriated, granostriated and speckled mosaic, with strong orientation; dominant Moderately developed angular blocks Planar void and cavities
Numerous typic and crescent coatings of clay and Fe, rare dense infillings of clay+silt+Fe, abundant typic Fe nodules and pseudomorphic nodules of chalcedony, magnetite and ilmenite, numerous papules BC Frequent: feldspar and
quartz
Common: ilmenite and magnetite Double-spaced porphyric Porostriated, granostriated and speckled mosaic, with strong orientation; dominant Strongly developed angular blocks Planar void and cavities
Occasional typic and crescent coatings of clay and Fe, occasional dense infillings of clay+silt+Fe, abundant typic Fe nodules and pseudomorphic nodules of feldspars,
chalcedony, magnetite and ilmenite, numerous papules (1)
Figure 4. Photomicrographs of horizon A2 of soil profile P1, under plane-polarized light (PPL);
(a) groundmass of horizon A2 with open-porphyric fabric, under cross-polarized light (XPL); (b) coarse fragment formed by primary minerals under XPL; (c) coarse fragment with illuvial clay preserved under PPL.
(a)
300 μm
Feldspar Ilmenite Volcanic glass Coarse fragment (b)
300 μm
Illuvial clay (c)
Figure 5. Photomicrographs of horizons Bt1, Bt2 and BC of soil profile P2, under cross-polarized
light (XPL); (a) groundmass of horizon Bt1 with double-spaced porphyric fabric; (b) groundmass of horizon Bt2 with double-spaced porphyric fabric; (c) groundmass of horizon BC with single-spaced porphyric fabric.
Double-spaced porphyric pattern
Cavity
Single-spaced porphyric pattern
300 μm 300 μm
300 μm (a)
(b)
Figure 6. Photomicrographs of horizon Bt2 of soil profile P2, under plane-polarized light (PPL); (a)
aggregate formed by primary minerals; (b) illustration of distinct illuviation phases; (c) illustration of an iron nodule with hematite and goethite formation.
Aggregate formed by the coarse fraction
Distinct illuviation phases
Clay with iron traces
Clay
Iron-rich clay
Hematite
Goethite 300 μm
300 μm
100 μm
(a)
(b)
analysis indicated features such as illuviation argillans, stress argillans and papules associated with subsurface horizons. This result confirms the effects of intense erosion observed in the field, which removed a significant part of the original surface horizons in all toposequence profiles.
Soil classification
Based on the SiBCS criteria (Santos et al., 2013), the surface horizons of P1, P2 and P3 showed attributes that characterize them as chernozemic horizons similar to mollic epipedon, with a moderately developed blocky and prismatic structure, high base saturation (>65 %) dominated by Ca and Mg, organic C content above 6 g kg-1 and hue of 5YR to 7.5YR, value of 3 and chroma of 2, although the soils did not meet the thickness requirement for this classification. However, because the area has been subjected to extensive agricultural use during its history, the thin horizon thickness likely results from intense erosion, which was observed in the field and confirmed by micromorphological analyses of horizon A. Therefore, considering that erosion made a significant contribution to decreasing soil thickness below the minimum required for surface diagnostic horizon (i.e. 0.25 m), profiles P1, P2 and P3 were identified as having a chernozemic A horizon, but with an “eroded phase”.
Profile P1 was classified as Neossolo Regolítico Eutrófico típico, since it lacks a subsurface diagnostic horizon and displays the A horizon directly above the C horizon and a high degree of base saturation. The micromorphological results indicate that horizon A2 exhibits an abundance of illuviation cutans and frequent stress cutans, suggesting an elutriation pedogenic process, but other attributes such as variation in clay content did not confirm the occurrence of a textural B horizon, or a diagnostic subsurface horizon.
The main criteria used to classify profiles P2, P3 and P4 were the occurrence of an eroded chernozemic horizon associated with high values of base saturation, and clay CEC above 27 cmolc kg
-1
. The diagnostic subsurface horizon of these profiles met one of the requirements for a textural B horizon in the SiBCS; namely, the occurrence of abundant and moderate (or common and moderate) clay skins, identified in the field and confirmed by micromorphological analyses. Given these properties, the profiles can be classified as Chernossolos Argilúvicos Órticos típicos (Mollisols), provided that the full thickness of horizon A was not considered for classification purposes due to the severe erosion caused by the hilly landscape known as Mar de Morros (Sea of Hills) and the intense land use in the region of Pinheiral (RJ).
The rationale for the identification of profiles P2, P3 and P4 is that, according to the SiBCS, taxonomy is based on soil genetics, which is indicated by key pedogenic processes. Thus, the classification of profiles P2, P3 and P4 into orders other than Chernossolos is incorrect.
These profiles cannot be classified as Argissolos because the soils exhibit significant ferralitization and monosialitization processes, and are defined as (text from the SiBCS): “a group of soils with textural B horizon, low- or high-activity clay conjugated with low base saturation or alitic character”. On the other hand, although the profiles have some attributes of Luvissolos, such as – “a group of soils with textural B horizon, high activity clay and high base saturation”, they do not exhibit the diagnostic features of this class, which are “clear differentiation between horizons A and Bt because of contrasts of texture, color and/or structure. The transition to textural B horizon is clear or abrupt, and most soils from this class exhibit abrupt textural change.” (SiBCS; Santos et al., 2013).
significant occurrence of abundant and moderate (or common and moderate) clay skins. The clay skins observed in soil micromorphology indicate migration/translocation of clay, suggesting a noticeable pedogenic process that differs from that of the base definition of Cambissolos (text from the SiBCS), namely “poorly advanced pedogenesis, characterized by the development of soil structure, modification in parent material shown by the almost total absence of rock structure or sediment stratification, higher chroma, redder hue or higher clay content than the subjacent horizons”.
Thus, to be consistent with the SiBCS statement that “separation of classes in the first level category is based on marks left on soil by the action of a set of pedogenic processes that are considered dominant in soil development”, we propose the inclusion of the criterion “eroded phase” in taxon identification, in addition to a mapping unit, particularly in areas significantly affected by agricultural use and erosion. Thus, the classification of profiles such as the Chernossolos Argilúvicos Órticos típicos fase erodida (eroded phase) would be possible, as long as there are distinct attributes indicating pedogenesis, and given that surrounding landscapes show signs of similar soils, with sufficient surface diagnostic horizon thickness to sustain their classification as A chernozêmico.
In accordance with Soil Taxonomy (USDA, 2014), the profiles were classified as Typic Udorthents (P1) and Typic Argiudolls (P2, P3 and P4). However, some of the criteria and methods are different in the SiBCS and Soil Taxonomy, resulting in an approximation of soil taxa.
CONCLUSIONS
The soil morphology of profiles P2, P3 and P4 is expressed by a brownish-red color, blocky structure with high to moderate development, clay films and clay loam to clay texture, and the presence of a textural B diagnostic horizon. P1 shows less development, with a shallow profile and sequence of horizons A-C-Cr. Chemical and mineralogical properties indicate that the soils are less weathered than other soils in the Atlantic Forest Mar de Morros environment, which is related to the high relief and parent material (i.e. gabbro).
The soils in the toposequence under study exhibited evidence of following pedogenetic processes: a) alteration of easily weathered primary minerals; b) illuviation of clay and iron released from the alteration of primary minerals; c) fersialitization, which is silica release with the formation of 2:1 clay minerals and significant release of iron, which is impregnated in the soil matrix and concentrated in nodules; d) intense pedoturbation, characterized by deformation and fragmentation of illuviation cutans, resulting from soil contraction, expansion cycles and the expansive nature of montmorillonite.
REFERENCES
Abayneh E, Zauyah S, Hanafi MM, Rosenani AB. Genesis and classification of sesquioxidic soils
from volcanic rocks in sub-humid tropical highlands of Ethiopia. Geoderma. 2006;136:682-95. doi:10.1016/j.geoderma.2006.05.006
Albuquerque Filho MR, Muggler CC, Schaefer CEGR, Ker JC, Santos FC. Solos com
morfologia latossólica e caráter câmbico na região de Governador Valadares, Médio Rio Doce, Minas Gerais: gênese e micromorfologia. Rev Bras Cienc Solo. 2008;32:259-70. doi:10.1590/S0100-06832008000100025
Anjos LHC, Pereira MG, Ramos DP. Matéria orgânica e pedogênese. In: Santos GA, Camargo FAO, editores. Fundamentos da matéria orgânica do solo: ecossistemas tropicais e subtropicais. São Paulo: Genesis; 1999.
Brewer R. Fabric and mineral analysis of soil. New York: Robert Krieger; 1976.
Bullock P, Fedoroff N, Jonguerius A, Stoops G, Tursina T. Handbook of soil thin section
Campos MCC, Marques Júnior J, Pereira GT, Montanari R, Camargo LA. Relações solo-paisagem em uma litossequência arenito-basalto na região de Pereira Barreto, São Paulo. Rev Bras Cienc
Solo. 2007;31:519-29. doi:10.1590/S0100-06832007000300012
Claessen MEC, organizador. Manual de métodos de análise de solo. 2ª ed. Rio de Janeiro: Centro
Nacional de Pesquisa de Solos; 1997.
Cooper M, Vidal-Torrado P. Gênese de ferri-argilãs em horizontes B texturais de uma
sequência de solos sobre diabásio em Piracicaba (SP). Sci Agric. 2000;57:745-50.
doi:10.1590/S0103-90162000000400024
Dana JD. Manual de mineralogia. Rio de Janeiro: Livro Técnico e Científico; 1969.
Empresa Brasileira de Pesquisa Agropecuária – Embrapa. Levantamento semidetalhado e
aptidão agrícola dos solos do município do Rio de Janeiro, RJ. Rio de Janeiro: 1980.
Fonseca OOM. Caracterização e classificação de solos Latossólicos e Podzólicos desenvolvidos
nos sedimentos do terciário no litoral Brasileiro [dissertação]. Itaguaí: Universidade Federal Rural do Rio de Janeiro; 1986.
Hallett RB, Kyle PR. XRF and INAA determinations of major and trace elements in
geological survey of Japan igneous and sedimentary rock standards. Geostandard Newslett. 1993;17:127-33. doi:10.1111/j.1751-908X.1993.tb00128.x
Hughes JC, Brown G. A crystallinity index for soil kaolins and its relation to parent rock, climate and soil nature. J Soil Sci. 1979;30:557-63.
Ibrahim L. Caracterização física, química, mineralógica e morfológica de uma sequência de
solos em Lins, São Paulo [dissertação]. Piracicaba: Universidade de São Paulo/ESALQ; 2002.
Ibraimo MM, Schaefer CEGR, Ker JC, Lani JL, Rolim-Neto FC, Albuquerque MA, Miranda VJ. Gênese e micromorfologia de solos sob vegetação xeromórfica (Caatinga) na Região dos Lagos
(RJ). Rev Bras Cienc Solo. 2004;28:695-712. doi:10.1590/S0100-06832004000400011
Kämpf N, Curi N. Argilominerais em solos brasileiros. Tópicos Cienc Solo. 2003;3:1-54.
Kämpf N, Schwertmann U. The 5 M NaOH concentration treatment for iron oxides in soils. Clays Clay Miner. 1982;30:400-8. doi:10.1346/CCMN.1982.0300601
Kuhn P, Terhorst B, Ottner F. Micromorphology of middle Pleistocene Paleosols in northern Italy.
Quaternary Int. 2006;156-157:156-66. doi:10.1016/j.quaint.2006.05.026
Lacerda MPC, Queménéur JJG, Andrade, H, Alves HM, Vieira TGC. Estudo da relação
pedomorfogeológica na distribuição de solos com horizontes B textural e B nítico na paisagem de Lavras (MG). Rev Bras Cienc Solo. 2008;32:271-84. doi:10.1590/S0100-06832008000100026
Mehra OP, Jackson ML. Iron oxide removal from soil and clays by dithionite – citrate system
buffered with sodium bicarbonate. Clays Clay Miner. 1960;5:317-27.
Murphy CP. Thin section preparation of soils and sediments. Berkhamsted: Academic Publishers; 1986.
Norrish K, Taylor M. The isomorphous replacement of iron by aluminium in soil goethites. J Soil Sci. 1961;12:294-306.
Nummer AR. Geometria e cinemática de alojamento do maciço granítico de Arrozal Sudoeste do Estado do Rio de Janeiro [tese]. São Paulo: Universidade de São Paulo; 2001.
Ochoa G, Bracho H, Oballos SJ. Significación pedología del hierro en una secuencia de la
estación experimental San Eusebio. Agron Trop. 2000;50:589-613.
Oliveira CV. Atributos químicos, mineralógicos e micromorfológicos, gênese e uso de solos do
Projeto Jaíba, Norte de Minas Gerais [tese]. Viçosa, MG: Universidade Federal de Viçosa; 1999.
Pinto LFS, Kämpf N. Solos derivados de rochas ultrabásicas no ambiente subtropical do Rio Grande do Sul. Rev Bras Cienc Solo. 1996;20:447-58.
Projeto RADAMBRASIL. Folhas SF. 23/24, Levantamento de recursos naturais. Rio de Janeiro: 1983. mapas. v.32.
Reid-Soukup D, Ulrey AL. Smectites. In: Dixon JB, Schulze, DG. Soil mineralogy with environmental applications. Madison: Soil Science Society of America; 2002. p.467-99.
Resende M, Curi N, Rezende SB, Corrêa GF. Pedologia: base para distinção de ambientes.
4ª. ed. Viçosa, MG: Núcleo de Estudo de Planejamento de Uso da Terra; 2002.
Santos AC. Pedogênese e alterações geoquímicas em topolitossequências na Bacia do Ribeirão
do Cachimbal na Região do Médio Vale do Paraíba, RJ [tese]. Seropédica: Universidade Federal Rural do Rio de Janeiro; 2009.
Santos HG, Jacomine PKT, Anjos LHC, Oliveira VA, Oliveira JB, Coelho MR, Lumbreras JF, Cunha
TJF. Sistema brasileiro de classificação de solos. 3ª. ed. Rio de Janeiro: Embrapa Solos; 2013.
Santos RD, Lemos RC, Santos HG, Ker JC, Anjos, LHC. Manual de descrição e coletas de solos no campo. 5ª. ed. Viçosa, MG: Sociedade Brasileira de Ciência do Solo, 2005.
Schulze DG. The influence of aluminum on iron oxides. VII. Unit-cell dimensions of
Al-substituted goethites and estimation of Al from them. Clays Clay Miner. 1984;32:27-39.
Schwertmann U, Fechter H. The influence of aluminum on iron oxides. XI- Aluminum
substituted maghemite in soils and its formation. Soil Sci Soc Am J. 1984;48:1462-3. doi:10.2136/sssaj1984.03615995004800060054x
Schwertmann U, Taylor RM. Iron oxides. In: Dixon JB, Weed SB, editors. Minerals in soil
environments. 2nd. ed. Madison: Soil Science Society of America; 1989. p.379-438. (Book Serie, 1).
Schwertmann U. Transformation of hematite to goethite in soils. Nature. 1971;232:64-5. doi:10.1038/232624a0
Silva MB. Caracterização dos solos em uma topossequência no Campus da UFRRJ [dissertação]. Seropédica: Universidade Federal Rural do Rio de Janeiro; 1993.
Sivarajasingham S, Alexander LT, Cady, JG, Cline MG. Laterite. Adv Agron. 1962;14:1-60.
Sousa R, Camargo FAO, Vahl LC. Solos alagados. In: Meurer EJ, editor. Fundamentos de química
do solo. 2ª. ed. Porto Alegre: Genesis; 2004.
Stevenson FJ. Humus chemistry: genesis, composition, reactions. 2nd. ed. New York: John Wiley & Sons; 1994.
United States Department of Agriculture – USDA. Keys to soil taxonomy. 12th
. ed. Washington, DC: USDA-NRCS; 2014.
Valladares GS. Formas de ferro como índices de pedogênese e adsorção de fósforo [dissertação] Seropédica: Universidade Federal Rural do Rio de Janeiro; 2000.
Vidal-Torrado P, Macias F, Calvo R, Carvalho SG, Silva, AC. Gênese de solos derivados de
rochas ultramáficas serpentinizadas no sudoeste de Minas Gerais. Rev Bras Cienc Solo.