Metabolic evaluation of dairy cows submitted to three different
strategies to decrease the effects of negative energy balance in
early postpartum
1Alejandra M.B. García2*, Felipe C. Cardoso3, Rómulo Campos4, Diego X. Thedy5
and Félix H.D. González2
ABSTRACT.- García A.M.B., Cardoso F.C., Campos R., Thedy X.D. & González, F.H.D. 2011.
Metabolic evaluation of dairy cows submitted to three different strategies to dimin-ish the effects of negative energy balance in early postpartum. Pesquisa Veterinária Brasileira 31(Supl.1):11-17. Departamento de Patologia Clínica Veterinária, Faculdade de
Veterinária, Universidade Federal do Rio Grande do Sul, Av. Bento Gonçalves 9090, Porto Alegre, RS 91540-000, Brazil. E-mail: [email protected]
In early lactation dairy cattle suffer metabolic alterations caused by negative energy ba-lance, which predisposes to fatty liver and ketosis. The aim of this study was to evaluate the metabolic condition of high yielding dairy cows subjected to three treatments for preven-ting severe lipomobilization and ketosis in early lactation. Fifty four multiparous Holstein cows yielding >30 L/day were divided into four groups: control (CN= no treatment), glucose precursor (PG= propylene-glycol), hepatic protector (Mp= Mercepton®), and energy supple-ment with salts of linolenic and linoleic faty acids (Mg-E= Megalac-E®). Treatsupple-ments were administrated randomly at moment of calving until 8 weeks postpartum. Blood samples were collected on days 1, 7, 14, 21, 28, 35, 42 and 49 postpartum. Body condition score (BCS) was
evaluated at the same periods and milk yield was recorded at 2nd, 4th, 5th, 6th, 7th, and 8th weeks
of lactation. Concentrations of non-esteriied fatty acids (NEFA), albumin, AST, ß-hydroxy-butyrate (BHBA), cholesterol, glucose, total protein, urea and triglycerides were analyzed in blood samples. Cut-off points for subclinical ketosis were deined when BHBA ≥1.4 mmol/L and NEFA ≥0.7 mmol/L. General occurrence of subclinical ketosis was 24% during the
pe-riod. An ascendant curve of cholesterol and glucose was observed from the 1st to the 8th week
of lactation, while any tendency was observed with BHBA and NEFA, although differences
among treatments were detected (p≤0.05). BCS decreased from a mean of 3.85 at 1st week
to 2.53 at 8th week of lactation (p=0.001). Milk yield was higher in the Mg-E group compared
with the other treatment groups (p≤0.05) Compared with the CN group, the treatments with Mp and PG did not show signiicant differences in blood biochemistry and milk yield. Cows receiving PG and Mg-E showed higher values of BHBA and NEFA (P<0.05), indicating accen-tuated lipomobilization. Supplementation with Mg-E also resulted in signiicant higher con-centrations of cholesterol, BHBA, urea, AST and lower values of glycemia. This performance may be explained by the highest milk yield observed with this treatment. Treatments with PG and Mp did not improve milk yield, compared with control cows, but did not show meta-bolic evidence of ketosis, fat mobilization or fatty liver. These results suggest that treatment with Mg-E improves milk production but induces a higher negative energy balance leading to moderated lipomobilization and ketone bodies production, increasing the risk of fatty liver.
INDEX THERMS: Fatty liver, ketosis, biochemical indicators, early lactation, transition period.
1 Received on August 21, 2011.
Accepted for publication on October 31, 2011.
2 Departamento de Patologia Clínica Veterinária, Faculdade de
Veteriná-ria, Universidade Federal do Rio Grande do Sul (UFRGS), Av. Bento Gon-çalves 9090, Porto Alegre, RS 95320-000, Brazil. * Corresponding author: [email protected]
3 Department of Animal Sciences, University of Illinois, 1207 W. Gregory
Dr., Urbana, IL 61801, USA.
4 Departamento de Ciencia Animal, Universidad Nacional de Colombia,
Campus Palmira, Carrera 32 No.12-00, Colombia.
5 Departamento de Medicina Animal, Faculdade de Veterinária, (UFRGS),
RESUMO.- [Avaliação metabólica de vacas leiteiras sub-metidas a três estratégias para diminuir os efeitos do balanço energético negativo no pós-parto inicial.] Du-rante o início da lactação as vacas leiteiras sofrem trans-tornos metabólicos causados pelo balanço energético ne-gativo, o que predispõe a iniltração gordurosa hepática e cetose. O objetivo deste estudo foi avaliar o status metabó-lico de vacas leiteiras de alta produção submetidas a três tratamentos para prevenir severa lipomobilização e cetose no início da lactação. Cinquenta e quatro vacas de raça Ho-landesa multíparas produzindo >30 L/dia foram divididas em quatro grupos: controle (CN= sem tratamento), pre-cursor de glicose (PG= propileno-glicol), protetor hepático (Mp= Mercepton®) e suplementação com sais de ácidos linolênico e linoléico (Mg-E= Megalac-E®). Amostras de sangue foram coletadas nos dias 1, 7, 14, 21, 28, 35, 42 e 49 do pós-parto. A condição corporal foi avaliada nos mes-mos períodos e a produção de leite foi registrada nas sema-nas 2, 4, 5, 6, 7 e 8 de lactação. As concentrações de ácidos graxos não esteriicados (AGNE), albumina, AST, ß-hidro-xibutirato (BHB), colesterol, glicose, proteína total, uréia e triglicerídeos foram determinadas nas amostras de sangue. Pontos de corte para diagnosticar cetose subclínica foram deinidos quando BHB ≥1,4mmol/L e AGNE ≥0,7mmol/L. A ocorrência geral de cetose subclínica foi de 24% durante o período. Uma curva ascendente de colesterol e de glicose foi observada desde a 1ª até a 8ª semana de lactação, en-quanto que nenhuma tendência foi observada com BHB e AGNE, embora diferenças entre os tratamentos foram de-tectadas (p≤0,05). A condição corporal diminuiu de uma media de 3,85 na 1ª semana até 2,53 na 8ª semana de lacta-ção (p=0,001). A produlacta-ção de leite foi superior no grupo de Mg-E comparado com os demais tratamentos. Comparado com o grupo CN, os tratamentos de Mp e PG não mostraram diferenças signiicativas na bioquímica sanguínea nem na produção de leite (p≤0,05) As vacas que receberam PG e Mg-E mostraram maiores valores de AGNE, indicando uma acentuada lipomobilização. A suplementação com Mg-E também resultou em maiores concentrações de colesterol, BHB, uréia, AST e menores valores de glicemia. Este resul-tado pode ser explicado pela maior produção de leite ob-servada com este tratamento. Os tratamentos com PG e Mp não melhoraram a produção de leite, comparados ao grupo CN, mas também não mostraram evidências metabólicas de cetose, alta lipomobilização nem iniltração gordurosa he-pática. Os resultados sugerem que o tratamento com Mg-E melhora a produção de leite, mas induz um balance ener-gético negativo maior levando a moderada lipomobilização e produção de corpos cetônicos, aumentando o risco de í-gado gorduroso.
TERMOS DE INDEXAÇÃO: Lipidose hepática, indicadores bioquí-micos, início da lactação, período de transição.
INTRODUCTION
During early lactation dairy cows experience a negative energy balance (NEB), which causes lipid mobilization from adipose tissue (Campos et al. 2005). When the lipid mobilization is intense, and persevere for a long time, the
glycogen reserves in the liver can be depleted, compromi-sing the gluconeogenesis that lead the animal to a high risk in developing ketosis (Drackley 1999). Fatty liver and ke-tosis are metabolic disorders that usually develop between the second and seventh week after calving (Herdt 2000). Prevention of metabolic disorders in dairy cattle is neces-sary to maintain optimal hepatic function (Bertics & Grum-mer 1999).
Excessive lipid mobilization can be prevented with di-fferent strategies such as the reduction of blood levels of non-esteriied fatty acids (NEFA), increase in the complete oxidation of NEFA in extra-hepatic tissues, and increment of the liver exportation rate through very low density lipo-proteins (VLDL) (Grummer 2008). The prophylactic use of additives that can increase ruminal propionate concentra-tion, such as propylene glycol, have been associated with insulin stimulation, decrease in lipolysis resulting in a bet-ter energetic status in dairy cows (Studer et al. 1993, Grum-mer et al. 1994, Christensen et al. 1997, Dufield 2000).
Feed additives have been studied in order to allevia-te the NEB experienced by dairy cattle through increased energy density of the diet. Some of these additives are known as protected fat or “by-pass” fat (Grummer & Carol 1991, Bertics & Grummer 1999, Pickett et al. 2003). This nutritional strategy consists in the utilization of fatty acids, originated from the diet that could positively inluence the energetic status in the early post-partum by offering high energy in a period where depression of dry matter intake (DMI) is eminent. The fatty acids originated from the diet are utilized by extra-hepatic tissues, differently than NEFA that are metabolized in the liver (Bertics & Grummer 1999, Pickett et al. 2003). Therefore, the lipid mobilization would be less intense and would have less negative effect on liver metabolism (Drackley 1999, Picket et al. 2003).
Another strategy used to prevent the lipid mobilization effects is the administration of precursors necessary for very low density lipoproteins (VLDL) synthesis, that what represents a challenge in ruminants because of the low ex-portation rate of these lipoproteins (Grummer 1995). Rela-tively little information is available on the effectiveness of lipotropic agents to enhance hepatic VLDL secretion in ru-minants (Bertics & Grummer 1999). The utilization of he-patic protectors with components such as methionine and choline are an alternative to increase the eficiency of VLDL secretion in ruminants. In southern Brazil, Rio Grande do Sul, it is a common practice the utilization of liver protec-tors during the early postpartum in dairy cows. However, the information regarding the advantages and disadvanta-ges of such practice on the metabolic status of dairy cows is limited. Tedesco et al. (2004) have shown the potential use of silimarina; i.e. human liver protector, in dairy cows during the transition period. The effect of this substance is due to the ant-oxidant effects of the lavolignans extracted
from the Silybum marianum plant. The utilization of
strate-gies applied during the irst thirty days postpartum to pre-vent NEB in dairy cows. Metabolic indicators were used from plasma and urine in the irst eight weeks postpartum, under commercial dairy production characteristics in Rio Grande do Sul, Brazil.
MATERIALS AND METHODS Animals
Fifty four multiparous Holstein cows yielding more than 30L/ cow/day were used. All animals were part of the same herd in a commercial dairy farm in the Taquari region, Teutonia county, Rio Grande do Sul (latitude 29°S, longitude 51°W). The herd consisted of 75 milking Holstein cows managed in a semi-coninement sys-tem. One week before the expected calving date, a clinical exam was performed in each cow to check for health problems. In addi-tion, it was recorded each cows health history, register, age, pre-vious lactation milk production, parity and body condition score (BCS). For the total period of experiment the BCS determination followed the methodology proposed by Edmonson et al. (1989) where a scale of 5 points is used (1 - extremely skin; 5 - extreme-ly obese). BCS evaluations were recorded weekextreme-ly from the irst trough the eighth week postpartum. Evaluations were made by the same person in order to reduce variation of this index.
Treatments
Treatments were randomly assigned to each cow at calving in one of the following groups:
Control group (CN, n=15), received the basic farm diet. Propylene glycol group (PG, n=14), besides the basic farm diet, received 300mL propylene glycol (Nuclear Laboratory), orally, every 48 hours during the irst 30 days postpartum. A total of 15 applications were performed always at 19:00 (Grummer et al. 1994, Christensen et al. 1997).
Mercepton group (Mp, n=15), besides the basic farm diet, re-ceived 20 mL Mercepton® (Bravet), intramuscular injection (IM), every 48 hours during the irst 30 days postpartum. A total of 10 applications were performed always at 19:00. Dose was adjusted following fabricant recommendations.
Megalac-E group (Mg-E, n=10), besides the basic farm diet, received 250 g/cow/day Megalac-E®6 (Arm & Hammer) mixed in the ration and administered daily at 19:00, during the irst 30 days postpartum. Dose was administered following fabricant re-commendations.
Besides the treatments, each cow received daily, in a dry mat-ter basis: 0.6 kg of mineral supplement, 0.89 kg of wheat bran, 5.7 kg of ground corn 4 kg of soybean meal, 0.2 kg of sodium bicarbo-nate (buffer) and 8.05 kg of corn silage. The nutritional values of the diet followed the NRC (National Research Council, 2001) re-commendations to Holstein cows with 570 Kg of body weight and 33 L of milk production with 3.5% of milk fat and 3.2% of milk protein. The diet was formulated using the software CPM Dairy Cornell-Penn-Miner Version 3.0.10.
In the beginning of the study cow’s average age and previous lactation milking production (L/day) were: 5.53±1.96 years and 33.8±3.84 L; 5.86±1.75 years and 33.43±3.08 L; 5.40±1.30 ye-ars and 32.53±4.14 L; 4.50±0.97 yeye-ars and 33.49±3.13 L for the groups CN, PG, Mp and Mg-E respectively.
Samples
Blood and urine samples were collected on days 1, 7, 14, 21, 28, 35, 42, and 49 after calving, always before the evening milking
(16:30), before feeding and treatment administration. Blood sam-ples were collected in two aliquots through puncture of the coccy-geal vein or artery in sterile vacuum tubes (Vacutainer, Becton Di-ckinson) 10mL without coagulant and 4mL with EDTAK2 (7.2mg). Plasma was separated immediately after collection (3mL), never after the period of ten minutes. The samples without coagulant were maintained at room temperature for 2 hours and then cen-trifuged (980g for 15 minutes). The serum was extracted and fractioned in several aliquots of 600 μL in 1.5mL Eppendorf tubs identiied and kept under refrigeration until its transport to the laboratory where they were stored at -20°C until the moment of the biochemical analysis.
Urine samples were collected through induction by perine-al massage. The irst jets of urine were despised. A minimum of 200mL was collected in sterilized recipients. The samples were put under refrigeration and were analyzed before 24 hours after the collection. Urine analysis made in the ield were pH determi-nation using a digital pHmeter (pHTEK model pH100), and the presence of ketone bodies through reagent strips (Multistix 10SG [MTX], Bayer Corp., USA) sensitive to acetoacetate and ketone.
Laboratorial analysis
The following metabolites were determined by spectrophoto-metric methods: Non-esteriied fatty acids (NEFA), albumin, as-partate-aminotransferase (AST), beta-hydroxybutyrate (BHBA), cholesterol, glucose, total protein, urea and triacylglycerol. All the analysis were performed through automatic equipment (Metrolab D-1600), using diagnostic commercial kits (Randox, for NEFA and BHBA and Labtest for the others). Globulin values were obtained by the difference between total protein concentration and albu-min. All the samples were determined in duplicates. Samples with coeficient of variation (CV) greater than 10% were re-analyzed and discrepant values were discarded.
Statistical analysis
The experiment was developed as a complete random de-sign (CRD) with four treatments and repeated measures in time (collection periods). For each one of the variables to be analyzed (metabolites or clinical status of the metabolic disease) the ANO-VA method was used with a multivariate model using the option (GLM, general linear model), for different sample size between treatments. When a minimal signiicant difference between the means was identiied, Duncan test used.
The Duncan test is a dynamic test and allows comparisons of treatments in system-all versus all. Previously, descriptive analy-sis was done by treatment, period and variable. Using the Pear-son correlation, possible mathematical correlations were tested among the analyzed metabolites. A probability of 95% (p≤0.05) was considered signiicant in the statistical analysis. The software SPSS-PASW 18 for Windows (Chicago) was used for the statistical analysis.
RESULTS
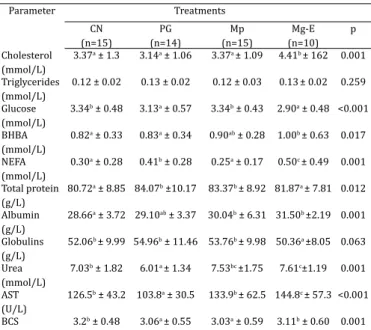
In the present multivariate model, statistical signiicance was not identiied in the principal effects group (treat-ment), week of collection, and the interaction (treatment by week). The results regarding the determinations of cho-lesterol, trilglycerides, glucose, BHBA, NEFA, total protein, albumin, globulins, urea, body condition score (BCS) are presented in table 1 by week, and table 2 by treatment and milk yield are presented in table 3. Individual results are not shown due to its non signiicance in the univariable analysis.
The BCS at calving was similar in all studied population, but during the following seven weeks there was a
signii-cant loss ending in the 8th week with a BCS difference of 1.3,
parturition affected BCS changes during the experimental period, and statistical differences were found (p=0.001) (Table 2).
During the experimental period data relative to milk
production was recorded during the 2nd, 4th, 5th, 6th, 7th, and
8th weeks. For the analyzed period the averages for milk
production (L/day) were 32±6.8, 30.3±6.9, 31.2±8.4 and 38.5±4.9 for the CN group, PG, Mp and Mg-E, respectively. Mg-E group showed higher (p≤0.05) milk production when compared with the other groups (Table 3).
The least square mean value for glucose in the popu-lation studied was at calving (2.83±0.61mmol/L), with continuous increment in the next 7 weeks. The mean
con-centration of cholesterol showed a gradual increase with increasing days in milk ranging from 2.29±0.90mmol/L in the irst week to 4.43±1.26mmol/L in the eighth week (Table 2). There was no signiicant difference for TG be-tween treatments (p=0.259) or weeks (p=0.300) (Table 1 and 2).
BHBA values greater than 1.2mmol/L were used as a cut--off value for risk factor of a cow develop ketosis (Dufield et al. 2009). It was established as a diagnostic parameter of subclinical ketosis BHBA values greater than 1.4mmol/L (Oetzel 2004) together with NEFA concentrations greater
than 0.7mmol/L (Whitaker 2004). The 2nd week was the
period with the greater number of samples with BHBA and NEFA concentrations compatibles with subclinical keto-sis (17.9%; n=19). From a total of 428 samples, 196 had high concentration of NEFA (52) and BHBA (54), leading to a 24.76% prevalence of subclinical ketosis. These results are related with the appearance of ketone bodies in urine, since 102 samples were positive, resulting in 23.87% pre-valence of subclinical ketosis. It was observed 52 samples (12.1%) with NEFA concentration ≥0.7mmol/L, from whi-ch 39 (75%) had trilglycerides concentration (TG) betwe-en 0.04 and 0.1mmol/L, being 25 (64.10%) with high AST concentration (ranging from 100 to 322 U/L). NEFA con-centration ranged from 0.7 to 2.67mmol/L in the irst four weeks of lactation, reducing through the end of the experi-ment demonstrating the severity of NEB in the beginning of the lactation.
DISCUSSION
The results presented in this study are the relection of ex-pected physiologic adaptations of the energy metabolism
Table 2. Average, standard deviation, probability values (p) for blood metabolites in dairy cows analyzed during the ϐirst eight weeks of lactation
Parameter Weeks postpartum
1 2 3 4 5 6 7 8 p
Triglycerides (mmol/L) 0.13 ± 0.03 0.13 ± 0.03 0.13 ± 0.02 0.13 ± 0.03 0.14 ± 0.07 0.13 ± 0.03 0.14 ± 0.02 0.13 ± 0.03 0.300 Cholesterol (mmol/L) 2.29a ± 0.90 2.71b ± 0.88 3.20c ± 1.08 3.54cd ± 1.12 3.78de ± 1.20 3.95de ± 1.15 4.19ef ± 1.03 4.43f ± 1.26 0.001 Glucose (mmol/L) 2.83a ± 0.61 3.09b ± 0.53 3.21b ± 0.55 3.24b ± 0.54 3.15b ± 0.48 3.30bc ± 0.40 3.47c ± 0.34 3.29bc ± 0.62 <0.001 BHBA (mmol/L) 0.82 ± 0.26 0.96 ± 0.54 0.95 ± 0.74 0.89 ± 0.30 0.85 ± 0.28 0.87 ± 0.29 0.83 ± 0.25 0.90 ± 0.29 0.533 NEFA (mmol/L) 0.39 ± 0.29 0.43 ± 0.44 0.38 ± 0.36 0.34 ± 0.41 0.33 ± 0.24 0.34 ± 0.25 0.36 ± 0.36 0.31 ± 0.29 0.597 AST U/L 116.45 ±54.2 124.70 ±53.09 121.02 ± 6.45 118.49 ±47.64 140.77 ±77.42 131.16 ±41.23 128.72 ±35.75 120.17 ±42.74 0.234 Total protein (g/L) 75.22a ± 6.94 78.28a ± 6.60 81.79b ± 6.94 83.85bc ± 8.37 85.27d ± 9.46 84.79bc ± 8.62 85.57d ± 10.6 85.51d ± 9.21 0.001 Albumin (g/L) 30.72 ± 8.08 28.85 ± 3.36 28.94 ± 3.23 29.58 ± 3.55 30.24 ± 3.52 29.51 ± 3.87 20.73 ± 3.77 29.8 ± 3.76 0.5361 Globulins (g/L) 45.34 a ± 8.26 49.43b ± 6.87 52.85bc ± 8.13 54.27c ± 9.85 55.03c ± 0.52 55.27c ± 0.05 55.84c ±11.71 55.64c ±10.83 0.001 Urea (mmol/L) 6.58 ± 1.58 6.89 ± 1.84 6.91 ± 1.84 6.82 ± 1.66 7.04 ± 1.68 7.18 ± 1.53 7.38 ± 1.41 7.29 ± 1.75 0.187 BCS 3.85f ± 0.25 3.65e ± 0.28 3.33cd ± 0.27 3.13c ± 0.30 2.96c ± 0.39 2.71ab ± 0.34 2.60ab ± 0.39 2.53a ± 0.37 0.001
BCS = Body condition score (1-5). Different values between means are indicated by different letters in the Duncan test (p≤0.001).
Table 3. Average and standard deviationfor milk yield from dairy cows in each treatment group (average for eight weeks).
Treatments Milk yield (L/day)
CN 32.00a ± 6.8
Mg-E 38.50b ± 4.9
Mp 31.20 a ± 8.4
PG 30.30 a ± 6.9
CN = Control group, Mg-E = Megalac-E group, Mp = Mercepton group, PG = propylene-glycol group. Different values between groups are indicated by different letters (P≤0.05).
Table 1. Average, standard deviation, probability values (p)
for blood metabolites analyzed in each treatment group (average for eight weeks)
Parameter Treatments
CN (n=15)
PG (n=14)
Mp (n=15)
Mg-E (n=10)
p
Cholesterol (mmol/L)
3.37a ± 1.3 3.14a ± 1.06 3.37a ± 1.09 4.41b ± 162 0.001
Triglycerides (mmol/L)
0.12 ± 0.02 0.13 ± 0.02 0.12 ± 0.03 0.13± 0.02 0.259
Glucose (mmol/L)
3.34b ± 0.48 3.13a ± 0.57 3.34b ± 0.43 2.90a ± 0.48 <0.001
BHBA (mmol/L)
0.82a ± 0.33 0.83a ± 0.34 0.90ab ± 0.28 1.00b ± 0.63 0.017
NEFA (mmol/L)
0.30a ± 0.28 0.41b ± 0.28 0.25a ± 0.17 0.50c ± 0.49 0.001
Total protein (g/L)
80.72a ± 8.85 84.07b ±10.17 83.37b ± 8.92 81.87a ± 7.81 0.012
Albumin (g/L)
28.66a ± 3.72 29.10ab ± 3.37 30.04b ± 6.31 31.50b ±2.19 0.001
Globulins (g/L)
52.06b ± 9.99 54.96b ± 11.46 53.76b ± 9.98 50.36a ±8.05 0.063
Urea (mmol/L)
7.03b ± 1.82 6.01a ± 1.34 7.53bc ±1.75 7.61c±1.19 0.001
AST (U/L)
126.5b ± 43.2 103.8a ± 30.5 133.9b ± 62.5 144.8c ± 57.3 <0.001
BCS 3.2b ± 0.48 3.06a ± 0.55 3.03a ± 0.59 3.11b ± 0.60 0.001
of dairy cows in the early postpartum. In this period, there is an energy deicit that propitiates lipid mobilization from body adipose tissue and, consequently increases in blood concentration of NEFA and ketone bodies (Ingvarsten & Andersen 2000). High concentration of NEFA and ketone bodies can result in subclinical ketosis or clinical ketosis (Dufield 2000, Dufield et al. 2009).
Body condition scores provide an indication of the ener-gy status of dairy cattle (Smith et al. 1997). Treatments did not inluence BCS, which decreased through the lactation, as expected (Wang et al. 2009). The CN group had the least decrease in BCS, which can be associated with the stress level that each group experienced. That group received less intervention due to simpler feeding management, what could be responsible for a smaller negative effect in dry matter intake (DMI). There are controversial information about the relationship between BCS and ketosis suscep-tibility. Busato et al. (2002) stated that higher BCS before parturition and the maintenance of this condition in con-junction with optimal feed intake in the early post-partum period by cows can decrease their risk of ketosis. Therefo-re, cows would be better metabolically adjusted to increa-sed energy requirements early postpartum. On the other hand, Edmonson et al. (1989) reported that higher BCS can increase the risk of ketosis. The increased risk could be explained by the excessive mobilization of body energy reserves, relecting the longer negative energy balance in these animals and the consequently development of fatty liver and ketosis.
Urine pH values were in between the reference values for the bovine specie (Kaneko et al. 2008). The Pearson correlation test was highly signiicant between BHBA se-rum levels and urine ketone bodies (p<0.001). However, did not have any correlation with urine pH. This result is in agree with data shown by Campos et al. (2005) where no statistical relationship was found between serum levels of BHBA and urine ketone bodies with urine pH. Therefore, one could suggest that in the process of subclinical ketosis urine pH can be dismissed.
The cholesterol mean concentration had a gradual incre-ase as the lactation developed, with some variation within groups (Table 2). The present study agrees with the results found by Souza & Junior (2009) that stated a continuous in-crease as days from calving inin-creased. The crescent serum cholesterol concentration levels can be physiologic during the lactation (Cavestany et al. 2005) as a result of mobili-zation of fatty acids in consequence of glucagon secretion and increase of plasma lipoproteins concentration. Higher serum cholesterol concentration values in the Mg-E group can be a result from the supplementation of essential fatty acids from the diet (Table 1). Cholesterol concentration is in between of the reference values for Holstein cows in Rio Grande do Sul (González 2000). Lower serum cholesterol concentrations in the irst weeks postpartum have been re-lated with fatty liver (Steen 2001, Van den Top et al. 2005). There was no signiicant difference in serum TG con-centrations between groups. The values were in the same range reported for this region (González 2000, González et al. 2009). Data reported by Van den Top et al. (2005),
sug-gested a continuous plasma TG concentration decrease pos-tpartum, being lower concentration values related to cows with fatty liver. In the present study, it was not observed this tendency. González et al. (2009) reported a lower serum TG concentration in cows with high concentrations of BHBA and NEFA. This founding can be related to the fatty acids excess that is mobilized to the liver to be used as energy source. As a result of the limited liver capacity to export TG as VLDL, the liver storage of TG in the interior of the hepatocytes ends up decreasing the serum concentrations of TG.
Glucose values reported in this study are in agreement with the indings of other Brazilian researchers (González 2000, Campos et al. 2007, Cardoso et al. 2008, González et al. 2009, Souza & Junior 2009). The lowest concentration of serum glucose was at calving. Glucose serum concentration increased in the following seven weeks after calving. Mg-E group presented the lowest glucose serum concentration (Table 1). This result can be explained by the probable se-vere NEB experienced by the cows in this group that produ-ced more milk during the studied period. The PG treatment seems not to have an effect in the gluconeogenesis when compared to the CN group. This data is in disagreement with the data presented by Studer et al. (1993), Grummer et al. (1994) and Christensen et al. (1997), where the ad-ministration of propylene glycol induced higher glycemic levels. The Mp group had glycemic levels similar to the CN group (Table 1).
A 24% prevalence of subclinical ketosis was found in the present study. As a cut off point for subclinical ketosis BHBA serum concentrations ≥1.4 mmol/L were considered (Dufield 2000, Oetzel 2004, Dufield et al. 2009). BHBA concentrations between 1.2-1.39mmol/L were conside-red by Dufield et al. (2009) as indicators of high ketone levels associated with the risk to develop ketosis. Accor-ding to Oetzel (2004), BHBA concentrations ≥2.6mmol/L and NEFA ≥0.7mmol/L can be used to deine subclinical ketosis. In the present study, only two animals were found in this condition, however, since they did not have clinical signs they were classiied as with subclinical ketosis. The highest BHBA value and lowest glycemic value were ob-served in the Mg-E group. This result is in agreement with the suggestion that this group experienced the most seve-re NEB and also was moseve-re prone to develop ketosis, when compared with the other groups.
The sensibility of the fatty liver diagnose by the AST in-dex is 94% (Bruss 2008). Grummer (1993) and Stojević et al. (2005) found that higher concentrations of AST in dairy cattle are associated with fatty liver syndrome, lower dry matter intake and ketosis signs. In the present study, Mg-E group presented higher serum concentration of AST when compared with the other groups. A tendency for increasing concentration of AST trough the lactation was observed for all groups. This result is in agreement with the ones repor-ted by Dann et al. (2005), Stojević et al. (2005), and Gon-zález et al. (2009). The highest serum AST concentration values can be an indicative of liver lesions mainly found in the Mg-E and Mp groups. The result also suggests that the supplementation with propylene glycol can have a liver protection action against lipid mobilization.
In conclusion, the results from this study suggest that the supplementation with protected fatty acids lead to a higher milk production, therefore increasing the NEB nega-tive effect in dairy cows. In addition, the supplementation with protected fatty acids can result in liver dysfunction and predisposition to metabolic disorders such as ketosis. Propylene glycol supplementation may have a liver protec-tion effect.
Acknowledgements.-The authors thank the Conselho Nacional de De-senvolvimento Cientíico e Tecnológico (CNPq) for the scholarship grant to the irst author.
REFERENCES
Adewuyi A.A., Roelofs J.B., Gruys E., Toussaint M.J.M. & Van Eerdenburg F.J.C.M. 2006. Relationsship of plasma nonesterified fatty acids and walking activity in postpartum dairy cows. J. Dairy Sci. 89:2977-2979.
Bertics J. & Grummer R.R. 1999. Effects of fat methionine hidroxy analog on prevention or alleviation of fatty liver induced by feed restriction. J. Dairy Sci. 82:2731-2736.
Bruss L.M. 2008. Lipids and ketones, p.81-115. In: Kaneko J.J., Harvey, W.J. & Bruss L.M. (Eds), Clinical Biochemistry of Domestic Animals. 6th ed.
Academic Press, San Diego, California.
Busato A., Faissler D., Küpfer U. & Blum J.W. 2002. Body Condition Scores in Dairy Cows: Associations with metabolic and endocrine changes in healthy dairy cows. J. Vet. Med. 49:455-460.
Campos G.R., González F., Coldebella A. & Lacerda L. 2005. Determinação de corpos cetônicos na urina como ferramenta para o diagnóstico rá-pido de cetose subclínica bovina e relação com a composição do leite. Archs Vet. Sci. 10:49-54.
Campos G.R., Cubillos C. & Rodas Á.G. 2007. Indicadores metabólicos en razas lecheras especializadas en condiciones tropicales en Colombia. Acta Agron.56:85-92.
Cardoso F.C., Esteves V.S., Oliveira S.T., Lasta C.S., Valle S.F., Campos R. & González F.H.D. 2008. Hematological, biochemical and ruminant pa-rameters for diagnosis of left displacement of the abomasum in dairy cows from Southern Brazil. Pesq. Agropec. Bras. 43:141-147.
Canield R W. & Butler W.R. 1991. Energy balance, irst ovulation and the effects of naloxone on LH secretion in early postpartum dairy cows. J. Anim. Sci. 69:740-746.
Cavestany D.; Blanc J.E., Kulcsar M., Uriarte G., Chilibroste P., Meikle A., Fe-bel H., Ferraris A. & Krall E. 2005. Studies of the Transition Cow Under a Pasture-based Milk Production System: Metabolic Proiles. J. Vet. Med. A 52:1-7.
Christensen J.O., Grummer R.R., Rasmussen F.E. & Bertics S.J. 1997. Effect of method of delivery of propylene glycol on plasma metabolites of feed--restricted cattle. J. Dairy Sci. 80:563-568.
Dann H.M., Morin D.E., Bollero G.A., Muphy M.R. & Drackley J.K. 2005. Prepartum intake, postpartum induction of ketosis and preparturient disorders affect the metabolic status of dairy cows. J. Dairy Sci. 88:3249-3264.
Drackley J.K. 1999. Biology of dairy cows during the transition period: the inal frontier? J. Dairy Sci. 82:2259-2273.
Dufield T. 2000. Subclinical ketosis in lactating dairy cattle. Vet. Clin. Nor-th Am., Food Anim Pract. 16:231-253.
Dufield T.F., Lissemore K.D., McBride B.W. & Leslie K.E. 2009. Impact of hyperketomia in early lactation dairy cows on health and production. J. Dairy Sci. 92:571-580.
Edmonson A.J., Lean I.J., Weaver L.D., Farver T. & Webster G. 1989. A body condition scoring chart for Holstein dairy cows. J. Dairy Sci. 72:68-78. González F.H.D. 2000. Uso do peril metabólico no diagnóstico de doenças
metabólico-nutricionais em ruminantes, p.89-106. In: González F.H.D., Barcellos J.O., Ospina H. & Ribeiro L.A.O. (Eds), Peril Metabólico em Ruminantes: seu uso em nutrição e doenças nutricionais. Universidade Federal do Rio Grande do Sul, Porto Alegre.
González F., Muiño R., Pereira V., Campos R. & Castellote J.L.B.2009. Indi-cadores sanguíneos de lipomobilização e função hepática no início da lactação em vacas leiteiras de alta produção. Ciênc. Anim. Bras. 1:64. (Resumo)
Grummer R. R. 1993. Etiology of lipid-related metabolic disorders in peri-parturient dairy cows. J. Dairy Sci. 76:3882-3896.
Grummer R.R. 1995. Impact of changes in organic nutrient metabolism on feeding the transition dairy cow. J. Anim. Sci. 73:2820-2833.
Grummer R.R. 2008. Nutritional and management strategies for the pre-vention of fatty liver in dairy cattle. Vet. Journal176:10-20.
Grummer R. & Carrol D. 1991. Effects of dietary fat on metabolic disor-ders and reproductive performance of dairy cattle. J. Anim. Sci. 69:3838-3852.
Grummer R.R., Winkler J.C., Bertics S.J.,Vaughn A. & Studer V.A. 1994. Effect of propylene glycol dosage during feed restriction on metabolites in blood of prepartum holstein heifers. J. Dairy Sci. 77:3618-3623. Herdt T.H. 2000. Ruminant adaptation to negative energy balance.
Inluen-ces on the etiology of ketosis and fatty liver. Vet. Clin. North Am., Food Anim. Pract. 16:15-230.
Ingvartsen K.L. & Andersen J.B. 2000. Integration of metabolism and in-take regulation: a review focusing on periparturient animals. J. Dairy Sci. 83:1573-1597.
Kaneko J.J., Harvey J.W. & Bruss M.L. 2008. Blood analyte reference values in large animals, p.882-888. In: Ibid. (Eds), Clinical Biochemistry of Do-mestic Animals.6th ed. Academic Press. San Diego, California.
Oetzel G. 2004. Monitoring and testing dairy herds for metabolic disease. Vet. Clin. North Am., Food Anim. Pract. 20:651-674.
Pickett M.M., Pipenbrink M.S. & Overton T.R. 2003. Effects of propyle-no glycol or fat drench on plasma metabolites, liver composition, and production of dairy cows during the periparturient period. J. Dairy Sci. 86:113-121.
Smith T.R., Hippen A.R., Beitz D.C. & Young, J.W. 1997. Metabolic characte-ristics of induced ketosis in normal and obese dairy cows. J. Dairy Sci. 80:1569-1581.
Souza R.M. & Junior E.H.B. 2009. Inluência do puerperio e da fase pós--puerperal no lipidograma de vacas da raça holandesa criadas no Estado de São Paulo. Braz. J. Vet. Res. Anim. Sci. 46:5-10.
Steen A.2001. Field study of dairy cows with reduced apetite in early lac-tation: clinical examinations, blood and rumen luid analyses. Acta Vet. Scand. 42:219-228.
Stojević Z., Piršljin J., Milinković-tur S., Zdelar-tuk M. & Ljubić B.B. 2005. Activities of AST, ALT and GGT in clinically healthy dairy cows during lactation and in the dry period. Veterinarski Arhiv 75:67-73.
Tedesco D., Tava A., Galleti S., Tameni M., Varisco G., Costa A. & Steidler S. 2004. Effects of silymarin, a natural hepatoprotetor, in periparturient dairy cows. J. Dairy Sci. 87:2239-2247.
Van den Top A.M., Van Tol A., Jansen H., Geelen M.J.H.& Beynen A.C. 2005. Fatty liver in dairy cows post partum is associated with decreased con-centration of plasma triacylglycerols and decreased activity of lipopro-tein lipase in adipocytes. J. Dairy Res. 72:129-137.
Wang C., Liu Q., Yang W.Z., Dong Q., Yang X.M., HE D.C., Dong K.H. & Huang Y.X. 2009. Effects of malic acid on feed intake, milk yield, milk compo-nents and metabolites in early lactation Holtein dairy cows. Livest. Sci. 124:182-188.