http://dx.doi.org/10.1590/1806-9061-2017-0555
Author(s)
Cui CI Ye FI Li YI Yin HI Ye MI He LI Zhao XI Xu HI Li DI Qiu MII Zhu QI Wang YI
I Farm Animal Genetic Resource Exploration and Innovation key Laboratory of Sichuan Province, Sichuan Agricultural University, Chengdu Campus, Chengdu 611130, China.
II Sichuan Animal Science Academy, Animal Breeding and Genetics Key Laboratory of Sichuan Province, Chengdu 610066, China
Mail Address
Corresponding author e-mail address Dr. Yan Wang
College of Animal science and technology, Sichuan Agriculture University, Huiming Road 211#, Chengdu, Sichuan Province, P. R. China. 625014.
Tel: 0086-28-86291010 Email: [email protected]
Keywords
BMP6 gene; Bone traits; Carcass traits; Chicken; Polymorphisms.
Submitted: 30/May/2017 Approved: 15/August/2017
ABSTRACT
BMP6, a member of the subfamilies of the morphogenetic proteins (BMPs), plays a crucial role in osteogenic and chondrocyte differentiation in vitro and stimulates chondrogenesis, making chondrocytes differen-tiate on their terminal stage. The objective of this study is to explore the relationship between polymorphism of BMP6 gene and slaughter traits in chicken respectively. We screened the exonic and intronic regions of BMP6 gene by DNA pool construction and amplified DNA fragment by PCR, and finally, we got nine SNPs. Association analysis revealed that BMP6 had no significant association among all slaughter traits in Yellow bantam chicken. However, BMP6 had a significant difference with femur weight, tibia weight, femur length (p<0.05), and was extremely significant with tibia length (p<0.01) in Avian chicken. Moreover, femur perimeter also had significant correlation with BMP6 in Avian chicken. These results provide useful information for further investigation on the function of chicken BMP6 gene.
INTODUCTION
BMP6 is a member of the subfamilies of the morphogenetic proteins
(BMPs) which belongs to the transforming growth factor-β (TGF-β)
superfamily of cytokine (Mehler et al., 1997). In 1965, the BMPs was derived from demineralized bone extract to induce endochondral osteogenesis in vivo (Urist, 1965), and its protein-coding regions were sequenced in 1990s (Celeste et al., 1990). The Vg1 gene in Xenopus is a candidate for primary axis formation (Weeks and Melton, 1987) and BMP6 was isolated with Vg1 gene by low-stringency (Lyons et al., 1989). BMP6 plays crucial roles in osteogenic and chondrocyte differentiation in vitro (Sato et al., 1999). Solloway et al. had suggested that mutations in both BMP5 and BMP6 have synergistic effects of the sternum development (Solloway et al., 1998). In particular, BMP6 stimulates chondrogenesis and makes chondrocytes differentiate on
their terminal stage(Grimsrud et al., 1999). In recent years, more and
In addition, other studies have previously reported that BMP6 gene is associated with juiciness and tenderness of the meat in pig (Fonseca et al., 2003), while there is few research combing BMP6 with chicken slaughter performance so far. We compared slaughter performance between two absolute different kinds of chicken, the Avian and the Bantam yellow, for the first one is fast-growing broilers and the second is local variety in China.
MATERIALS AND METHODS
Ethics Statement
This study was performed with the approval of the Committee on Experimental Animal Management of Sichuan Agricultural University, permit number 2014-18.
Chicken populations and the collection of data
A total of 140 animals including Avian chicken (n=70) and Yellow bantam chicken (n=70) were randomly selected from commercial populations and used in the association analysis. All chickens involved in this study were raised in an experimental farm for poultry breeding at the Sichuan Agricultural University (Ya’an, China). The Avian chicken grow fast and have large bone and heavy body weight, but the Yellow bantam chicken with yellow plumage, short shanks and normal body weight. During the growth period, all birds had free access to food and water ad libitum under the same temperature and lighting conditions. The chicken were slaughtered at 70 days of age following a 12 hour fasting. Cervical dislocation was manually applied before bleeding of the neck. Blood samples
were collected during bleeding and the genomic DNA was isolated by the standard phenol/chloroform method. The purity and concentration of them
were assessed by a NanoVue PlusTM
spectrophotometer (Thermo Scientific, Wilmington, DE, USA). Based on the machine reading of the concentrated stocks, TE buffer was added to DNA samples extracted from blood to produce a target concentration of
100 ng/mL. The DNA samples were
stored at -20ºC until use.
Fifteen traits related to performance, carcass composition and bone integrity were evaluated.
At 70d of age, living weight (BW) was obtained on chickens after a 12 hour food withdrawal. After bleeding, the chicken were scalded in a hot water bath (80-90ºC for 40 s) and the feathers removed mechanically, then, carcass weight (CW), eviscerated weight (EW), semi-eviscerated weight (SEW), breast muscle weight (BMW), leg muscle weight (LMW), abdominal fat weight (AW), liver weight (LW), tibia weight (TW), femur weight (FW), tibia length (TL), femur length (FL), tibia diameter (TD), femur diameter (FD), tibia perimeter (TP) and femur perimeter(FP) were obtained. All of these performance traits were determined as described in “The Poultry Production Performance Terms and Measurement Statistics Method” (NY/T823-2004).
BMP6 gene amplification and genotyping
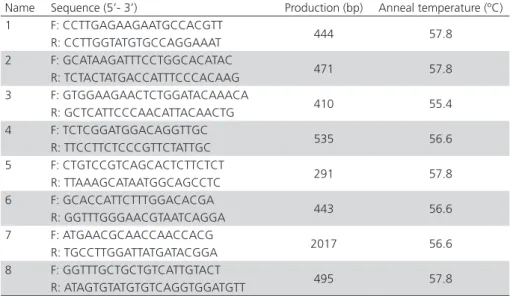
Eight pairs of primers (Table 1) were designed to amplify 300-550 bp of exonic and intronic regions based on the chicken BMP6 gene sequence (EMBL ID: ENSGALG00000012787). Primers were synthesized by Shanghai Yingjun Biotechnology Co. Ltd. (Shanghai, China). Sequences were obtained from Avian and Yellow bantam chicken DNA pool (30 random chicken DNA samples in the each DNA pool). To amplify DNA fragment of BMP6 gene, a PCR reaction was performed in 25 μL containing 2 μL of pooled DNA, 1.25 μL (10 pmol/μL) of each primer, 12.5 μL 2×Master mix
(including Mg2+, dNTPs, Taq DNA polymerase; Beijing
TIAN WEI Biology Technique Corporation, Beijing, China), and finally adjusting the volume to 25 μL by adding ultrapure water. The PCR reactions were carried out in EasyCycler 96 PCR detection system (Analytik Jena, Germany). We used a PCR protocol under the following condition: denaturing at 95°C for 5 min;
Table 1 – BMP6 primer sequence
Name Sequence (5’- 3’) Production (bp) Anneal temperature (ºC) 1 F: CCTTGAGAAGAATGCCACGTT
444 57.8
R: CCTTGGTATGTGCCAGGAAAT 2 F: GCATAAGATTTCCTGGCACATAC
471 57.8
R: TCTACTATGACCATTTCCCACAAG 3 F: GTGGAAGAACTCTGGATACAAACA
410 55.4
R: GCTCATTCCCAACATTACAACTG 4 F: TCTCGGATGGACAGGTTGC
535 56.6
R: TTCCTTCTCCCGTTCTATTGC 5 F: CTGTCCGTCAGCACTCTTCTCT
291 57.8
R: TTAAAGCATAATGGCAGCCTC 6 F: GCACCATTCTTTGGACACGA
443 56.6
R: GGTTTGGGAACGTAATCAGGA
7 F: ATGAACGCAACCAACCACG
2017 56.6
R: TGCCTTGGATTATGATACGGA 8 F: GGTTTGCTGCTGTCATTGTACT
495 57.8
followed by 35 cycles of denaturing at 95°C for 40 s, annealing at 55°C (or other apt annealing temperature as shown in Table 1) for 35 s, and extension at 72°C for 45 s. The final extension was performed at 72°C for 7 min. PCR products were purified with a gel extraction kit (Takara, Dalian, China) and sequenced on an ABI 377 DNA sequence (Shanghai Sangon Biological Engineering Technology, Shanghai, China). Sequences were analyzed with the DNASTAR software and the CodonCode Aligner software (http: //www. codoncode.com/aligner).
Based on the sequencing of the two DNA pools, polymorphisms were identified with four of the primer pairs. Genotyping was performed using DNA samples extracted from blood samples collected from the 140 chickens. To analyze the mutations, PCR was performed as described above. Amplified products were electrophoresed and purified with a gel extraction kit (Takara, Dalian, China) and sequenced by Shanghai Sangon Biology Technique Corporation.
Data analysis
Genotypic and allelic frequencies were calculated by counting the genotypes and alleles for each SNP
and Hardy-Weinberg equilibrium was established with chi-square test at 5% significance level. The linkage
disequilibrium (LD) structure as measured by D’ and r2
were performed with the Haploview software (Version 3.32) (Barrett et al., 2005).
The general linear model (GLM) procedure of JMP 10 was used to test associations between the genotyped markers and carcass traits. The model is as follows:
Yijk= μ+S i
+G j
+B k
+G
j×Si×Bk+eijk
where Yis the trait measured on chickens, μ is
the population mean, Si is the fixed effect of sex, Gj
is the fixed effect of genotype, Bk is the fixed effect
of breed, Gj×Si×Bk is the interaction among genotype,
sex and breed, and e is the random error. The values were presented as least square means±se. Statistical significance was evaluated using Duncan’s test. Differences were considered significant at p<0.05.
Haplotypes were constructed using the Haploview program (version 3.32, http://www.broad.mit.edu/ mpg/haploview/). Haplotypes were analyzed using the model applied for the single marker association test with consideration for animals having 0, 1, or 2 copies of the haplotype in question. The PROC REG
Table 2 – Genotypic and allele frequencies of four single nucleotide polymorphisms of BMP6 gene among Avian populations.
SNP Frequency
Genotype Number Genotype Allele P χ2
64487388A>G
AA (A) 37 0.544 0.757
0.186 1.748
AG 29 0.426
-GG (G) 2 0.03 0.243
64475440C>T
CC (C) 16 0.235 0.471
0.647 0.209
CT 32 0.471
-TT (T) 20 0.294 0.529
64474334G>C
GG (G) 5 0.074 0.463
p<0.01 21.884
GC 53 0.779
-CC (C) 10 0.147 0.537
64487436A>C
AA (A) 39 0.574 0.773
0.29 1.116
AC 27 0.397
-CC (C) 2 0.029 0.227
64487410G>A
GG (G) 36 0.529 0.765
0.01 6.438
GA 32 0.471
-AA (A) 0 0 0.235
64474352T>C
TT (T) 44 0.647 0.816
0.294 1.1
TC 23 0.338
-CC (C) 1 0.015 0.184
64474300C>T
CC (C) 37 0.544 0.75
0.418 0.654
CT 28 0.412
-TT (T) 3 0.044 0.25
64474290C>G
CC (C) 37 0.544 0.757
0.186 1.748
CG 29 0.426
-GG (G) 2 0.03 0.243
64463906T>C
TT (T) 4 0.059 0.309
0.158 1.994
TC 34 0.5
procedure of SAS (version 6.12, SAS Institute Inc.) was used to perform the analysis. Significant associations were declared at p<0.05.
RESULTS
Identification of SNPs in the chicken BMP6 gene
We sequenced the individuals of the random population genotypes and found nine mutations, including a A/G mutation (g.64487388A>G), a C/T mutation (g.64475440C>T), a G/C mutation (g.64474334G>C), a A/C mutation (g. 64487436A>C), a G/A mutation (g.64487410G>A), a T/C mutation (g.64474352T>C), a C/T mutation (g.64474300C>T), a C/G mutation (g.64474290C>G) and a T/C mutation (g.64463906 T>C). Table 2 and Table 3 show the Genotypic and allelic frequencies of nine single
nucleotide polymorphisms of BMP6 gene among the two different strains of populations.
Allele and Genotype Frequency of the Mutated sites
The Chi-squared test was conducted to compare the allele and genotypes frequency in the BMP6 gene of all 7 SNPs between Avian and Yellow bantam populations and the results were shown in Table 2 and Table 3. The data indicates that the homozygous genotype were dominant compared with heterozygotes genotype in both Avian and Yellow bantam populations of SNP1, SNP4, SNP5, SNP6, SNP7, SNP8, therefore, the homozygous GG genotype were dominant compared with homozygous AA genotype in SNP1, SNP5, and the homozygous AA genotype predominated in SNP4, the homozygous TT genotype predominated in SNP6, the homozygous CC genotype predominated in SNP7
Table 3 – Genotypic and allele frequencies of four single nucleotide polymorphisms of BMP6 gene among Yellow bantam populations.
SNP Frequency
Genotype Number Genotype Allele P χ2
64487388A>G
AA(A) 47 0.671 0.807
0.284 1.149
AG 19 0.271
-GG(G) 4 0.058 0.193
64475440C>T
CC(C) 38 0.543 0.736
0.945 0.005
CT 27 0.386
-TT(T) 5 0.071 0.264
64474334G>C
GG(G) 14 0.2 0.429
0.577 0.311
GC 32 0.457
CC(C) 24 0.343 0.571
64487436A>C
AA(A) 47 0.671 0.814
0.643 0.214
AC 20 0.286
CC(C) 3 0.043 0.186
64487410G>A
GG(G) 36 0.514 0.729
0.484 0.489
GA 30 0.429
AA(A) 4 0.057 0.271
64474352T>C
TT(T) 48 0.686 0.8
0.017 5.714
TC 16 0.229
CC(C) 6 0.085 0.2
64474300C>T
CC(C) 44 0.629 0.765
0.039 4.259
CT 19 0.271
TT(T) 7 0.1 0.235
64474290C>G
CC(C) 40 0.571 0.728
0.086 2.952
CG 22 0.314
GG(G) 8 0.115 0.272
64463906T>C
TT(T) 21 0.3 0.564
0.531 0.392
TC 37 0.529
and SNP8 in both populations. For SNP3, SNP9, the heterozygotes were advantageous compared with homozygous. As for SNP2, CT genotypes predominated in the Avian population and T was the advantageous allele while in the Yellow bantam population, C was the advantageous allele and CC were dominant.
The Hardy-Weinberg Equilibrium
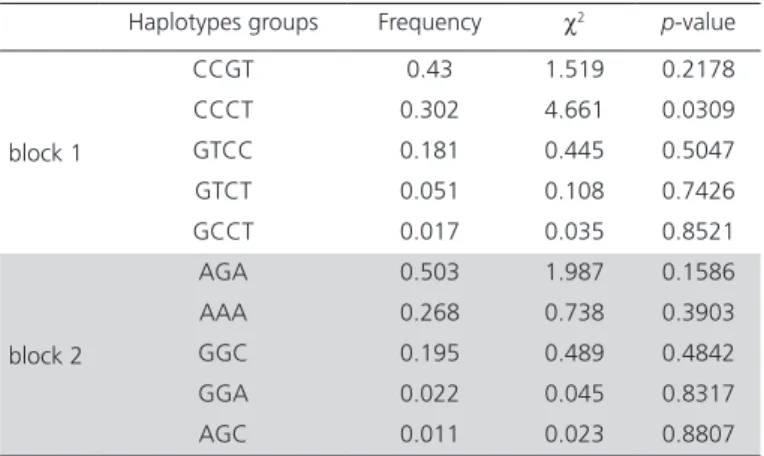
Figure 1 indicates that the degree of the linkage disequilibrium (LD) revealed the correlation between polymorphic variants at different positions of BMP6 gene. Obviously, the SNPs of block 1 (SNP3, SNP6, SNP7 and SNP8) and block 2 (SNP1, SNP4 and SNP5) are of high D’ respectively according to 2 blocks in dark red in the D’. Nevertheless, SNP2 and SNP9 were in equilibrium and independent in both blocks. Haplotype analysis showed (Table 4) that the haplotype
groups CCGT (χ2=1.519, p=0.2178), CCCT (χ2=4.661,
p=0.0309), GTCC (χ2=0.445, p=0.5047), GTCT
(χ2=0.108, p=0.7426), GCCT (χ2=0.035, p=0.8521) in
block1 and groups AGA (χ2=1.987, p=0.1586), AAA
(χ2=0.738, p=0.3903), GGC (χ2=0.489, p=0.4842),
GGA (χ2=0.045, p=0.8317), AGC (χ2=0.023,
p=0.8807). The Hardy-Weinberg equilibrium tests of the 9 SNPs were shown in Table 4. The heterozygosity of all SNPs were observed as expected and most of SNPs fit the assumption of the Hardy-Weinberg equilibrium except SNP2 (g.64475440C>T) and SNP9 (g.64463906 T>C)(D’<0.75). While the minor allele frequencies (MAF) of all the mutations were more than 0.01. (SNP1: 0.217, SNP2: 0.395, SNP3: 0.438, SNP4: 0.207, SNP5: 0.268, SNP6: 0.192, SNP7: 0.236, SNP8: 0.261, SNP9: 0.435).
Figure 1 – LD value within each diamond represents the correlation between pairs of SNPs (measured as D’) in the introns and exons of BMP6 gene. The diamond without a number means complete LD (D’=1). Darker red of the diamonds indicates higher D’, while white indicates lower D’.
Table 4 – The haplotype analysis of 7 BMP6 SNPs. Haplotypes groups Frequency χ2 p-value
block 1
CCGT 0.43 1.519 0.2178
CCCT 0.302 4.661 0.0309
GTCC 0.181 0.445 0.5047
GTCT 0.051 0.108 0.7426
GCCT 0.017 0.035 0.8521
block 2
AGA 0.503 1.987 0.1586
AAA 0.268 0.738 0.3903
GGC 0.195 0.489 0.4842
GGA 0.022 0.045 0.8317
AGC 0.011 0.023 0.8807
Correlation analysis of the SNPs in BMP6 gene and carcass traits
According to the results of the least-squares analysis (Table 5), we could find that all the SNPs had no significant correlation with all carcass traits in both populations of chicken, which means BMP6 gene affected little in carcass traits in Avian and Yellow bantam chicken. To find if BMP6 gene was expressed in the tissues of carcass traits or not, further study is required.
Correlation analysis of the SNPs in BMP6 gene and skeleton traits
In Table 6, the results indicated that SNP5 showed significant difference among FW, TW, FL (p<0.05) and extremely significant difference with TL (p<0.01) in the Avian population. In addition, SNP1, SNP4 both had significant correlation with FP (p<0.01) in the Avian population. However, there were no significant differences between SNPs and skeleton traits in the Yellow bantam population.
Correlation analysis of the BMP6 haplotypes and carcass traits
678
, Y
in H, Y
e M,
ang Y
Detection of SNPs in the BMP6 Gene and Their
Association with Carcass and Bone T
raits in Chicken
SNP1(64487388A>G)
Avian AG 3023.52±79.34 2008.62±60.38 3514.31±684.10 297.00±11.91 261.42±8.62 19.38±2.92 52.96±2.03 GG 2750.00±302.11 1850.00±229.92 2267.50±2602.96 296.55±45.35 219.10±32.84 9.25±11.14 45.95±7.74
Yellow bantam
AA 1629.89±57.10 960.67±34.91 1243±48.69 80.32±3.03 110.84±5.76 25.00±2.54 33.63±1.46 AG 1663.16±87.87 991.53±53.73 1270±74.94 83.36±4.67 115.09±8.86 31.11±3.91 34.79±2.24 GG 1587.50±191.51 953.75±117.11 1274±163.32 89.06±10.17 110.91±13.92 28.61±8.53 30.50±4.88
SNP2(64474334G>C)
Avian
CC 3097.50±133.31 2070.00±101.71 2523.50±1175.37 308.53±20.24 258.24±14.60 28.74±4.92 55.03±3.45 CG 2983.93±57.37 2003.24±43.77 2997.22±505.80 285.35±8.71 262.17±6.28 19.02±2.12 53.57±1.49 GG 2733.33±172.11 1841.67±131.31 2163.25±1517.39 272.41±26.13 231.73±18.85 21.31±6.35 48.54±4.46
Yellow bantam
CC 1720.83±77.02 1001.25±47.49 1308.54±65.95 84.73±4.15 118.51±7.82 30.59±3.48 35.32±1.98 CG 1570.16±67.78 936.74±41.79 1200.48±58.03 79.57±3.65 106.77±6.88 25.06±3.06 32.07±1.74 GG 1636.54±104.65 985.77±64.53 1263.46±89.60 81.08±5.64 112.60±10.62 24.60±4.73 34.96±2.69
SNP3(64487436A>C)
Avian
AA 2265.12±84.28 1458.49±63.34 1799.59±194.33 176.02±12.34 182.65±9.14 23.86±1.80 43.31±1.53 AC 2449.62±114.01 1577.11±85.68 2605.11±398.14 206.63±16.56 198.66±12.37 23.35±2.44 45.23±2.07 CC 1965.00±349.55 1251.00±262.69 1581.00±1220.67 166.70±50.76 140.67±37.94 24.78±7.48 36.07±6.35
Yellow bantam
AA 1621.67±56.58 957.89±34.58 1240.11±48.41 80.13±3.03 110.95±5.69 25.61±2.55 33.61±1.45 AC 1697.5±84.87 1011.2±51.86 1293.5±129.35 85.40±4.55 118.02±8.54 28.65±3.83 34.76±2.18 CC 1697.5±219.13 851.67±133.91 1123.33±112.33 80.13±11.74 88.38±22.05 35.14±9.89 29.49±5.63
SNP4(64487410G>A)
Avian
AA 1568.75±388.95 896.25±291.03 1900.00±1373.71 79.83±56.41 105.37±42.20 16.60±8.32 16.60±7.10 AG 2373.86±95.75 1538.18±71.64 1905.45±337.19 195.35±13.89 192.12±10.39 25.20±2.05 25.20±1.75 GG 2306.99±94.33 1480.94±70.59 2273.38±333.17 183.39±13.68 185.98±10.24 22.71±2.02 22.71±1.72
Yellow bantam
AA 1683.33±220.62 958.33±135.47 1283.33±188.68 84.97±11.81 116.83±22.32 12.14±9.78 36.92±5.65 AG 1599.14±70.96 971.03±43.57 1248.79±60.68 80.77±3.80 112.17±7.18 28.70±3.15 33.47±1.82 GG 1661.81±63.69 968.03±39.11 1249.44±54.47 82.14±3.41 112.17±6.44 26.72±2.82 33.74±1.63
SNP5(64474352T>C)
Avian
CC 1841.67±318.90 1189.17±239.60 1490.83±1124.09 124.41±46.10 138.22±34.64 20.29±6.81 37.41±5.81 CT 2419.23±125.08 1570.03±93.98 1948.60±440.91 209.79±18.08 196.86±13.59 25.80±2.67 43.31±2.28 TT 2304.91±81.00 1477.88±60.86 2152.36±285.52 180.16±11.71 185.39±8.80 23.07±1.73 44.27±1.48
Yellow bantam
CC 1675.00±170.97 1063.00±103.67 1350.00±144.90 90.27±9.08 119.62±17.26 24.07±7.53 36.25±4.35 CT 1582.80±95.57 919.10±58.96 1186.60±81.00 79.33±5.08 108.59±9.65 33.85±4.21 31.71±2.43 TT 1650.00±55.76 975.80±33.81 1261.90±47.26 81.56±2.96 112.40±5.63 24.87±2.45 34.20±1.42
SNP6(64474300C>T)
Avian
CC 2268.53±87.18 1459.98±65.45 2180.43±307.79 175.64±12.55 182.90±9.49 23.49±1.86 43.92±1.60 CT 2464.89±113.74 1593.32±85.39 1974.26±401.56 214.41±16.37 199.44±12.38 25.21±2.43 44.04±2.08 TT 2038.64±235.11 1284.09±176.51 1625.91±830.05 141.35±33.85 158.39±25.59 19.00±5.02 40.67±4.31
Yellow bantam
CC 1629.27±59.10 969.22±35.96 1247.68±50.10 80.63±3.15 110.29±5.97 26.42±2.65 33.51±1.48 CT 1584.21±86.82 922.68±52.82 1191.84±73.58 80.05±4.63 108.98±8.76 30.90±3.89 31.59±2.17 TT 1793.75±133.80 1076.88±81.40 1405.63±113.40 90.94±7.14 128.20±13.51 20.06±6.00 40.29±3.35
SNP7(64474290C>G)
Avian
CC 2287.43±89.03 1475.33±66.77 2211.49±313.55 179.16±12.84 184.97±9.68 23.03±1.90 44.31±1.63 CG 2426.47±109.39 1565.96±82.04 1940.98±385.27 207.28±15.78 195.74±11.89 25.57±2.33 43.38±2.00 GG 1987.50±247.04 1234.50±185.28 1583.50±870.06 131.63±35.63 152.26±26.86 19.58±5.26 40.70±4.52
Yellow bantam
679
, Y
in H, Y
e M,
ang Y
Detection of SNPs in the BMP6 Gene and Their
Association with Carcass and Bone T
raits in Chicken
SNP1(64487388A>G)
Avian AG 20.78±0.81 30.92±1.45 10.07±0.22 9.47±0.37 9.22±0.12 12.38±0.13 4.87±0.08a 4.58±0.12
GG 17.70±3.08 29.55±5.54 10.03±0.85 8.58±1.42 9.24±0.45 12.15±0.51 4.00±0.43b 3.95±0.47
Yellow bantam
AA 13.00±0.68 17.57±1.11 9.00±0.26 7.47±0.19 7.93±0.14 10.92±0.23 4.53±0.05 4.08±0.06 AG 12.13±1.04 16.35±1.70 8.79±0.39 7.50±0.30 7.89±0.22 10.96±0.36 4.47±0.08 4.05±0.10 GG 14.77±2.27 15.81±3.72 8.81±0.86 7.75±0.64 7.93±0.47 10.61±0.78 4.65±0.17 4.23±0.22
SNP2(64474334G>C)
Avian
CC 20.04±1.38 29.37±2.46 10.01±0.38 9.13±0.63 9.28±0.20 12.32±0.22 4.53±0.14 4.32±0.21 CG 20.54±1.60 30.97±1.06 10.12±0.16 9.43±0.27 9.16±0.09 12.34±0.10 4.78±0.06 4.58±0.10 GG 19.36±1.79 27.69±3.17 9.817±0.49 8.28±0.81 8.81±0.26 11.79±0.29 4.95±0.19 4.83±0.27
Yellow bantam
CC 13.63±0.92 17.89±1.52 9.12±0.35 7.82±0.26 8.03±0.19 11.17±0.31 4.58±0.07 4.18±0.09 CG 12.17±0.81 16.74±1.34 8.78±0.31 7.29±0.23 7.83±0.17 10.66±0.28 4.50±0.06 4.05±0.08 GG 13.08±1.25 16.64±2.07 8.78±0.47 7.37±0.35 7.93±0.26 11.07±0.43 4.47±0.09 3.96±0.12
SNP3(64487436A>C)
Avian
AA 20.25±0.68 30.30±1.22 10.06±0.19 9.15±0.31 9.11±0.10 12.25±0.11 4.73±0.07a 4.55±0.10
AC 20.76±0.84 30.76±1.51 10.11±0.23 9.56±0.39 9.20±0.12 12.36±0.14 4.83±0.09a 4.62±0.13
CC 17.70±3.08 29.55±5.54 10.03±0.85 8.58±1.42 9.24±0.45 12.15±0.51 4.00±0.43b 3.95±0.47
Yellow bantam
AA 12.63±0.68 17.01±1.11 8.90±0.26 7.43±0.19 7.92±0.14 10.95±0.23 4.54±0.05 4.08±0.06 AC 13.34±1.02 17.86±1.66 8.93±0.38 7.67±0.29 7.93±0.21 10.90±0.35 4.49±0.08 4.08±0.10 CC 13.08±2.63 14.03±4.29 8.67±0.99 7.30±0.74 7.83±0.54 10.60±0.90 4.50±0.20 4.00±0.25
SNP4(64487410G>A)
Avian
AA 9.85±4.18b 7.21±7.16b 8.00±1.16 5.25±1.96 7.13±0.59b 9.38±0.63B 4.70±0.49 4.00±0.64
AG 20.14±0.69a 29.50±1.18a 10.00±0.19 9.21±0.32 9.15±0.10b 12.26±0.10B 4.72±0.08 4.42±0.11
GG 20.96±0.74a 29.50±1.19a 10.28±0.20 9.51±0.35 9.21±0.10a 12.42±0.11A 4.80±0.08 4.75±0.11
Yellow bantam
AA 14.25±2.63 18.51±4.31 9.38±0.97 7.93±0.74 8.26±0.54 11.17±0.90 4.73±0.19 4.10±0.25 AG 12.81±0.85 16.97±1.39 9.21±0.31 7.50±0.24 7.95±0.17 11.03±0.29 4.50±0.06 4.06±0.08 GG 12.78±0.76 17.14±1.24 8.61±0.28 7.45±0.21 7.87±0.16 10.81±0.26 4.52±0.06 4.09±0.07
SNP5(64474352T>C)
Avian
CC 18.90±4.39 35.00±7.82 10.25±1.19 9.25±2.01 9.35±0.63 12.46±0.72 4.10±0.46 3.80±0.66 CT 20.48±0.91 30.67±1.63 10.17±0.25 9.55±0.42 9.27±0.13 12.39±0.15 4.78±0.10 4.53±0.14 TT 20.35±0.65 30.25±1.15 10.03±0.18 9.16±0.30 9.09±0.09 12.24±0.11 4.76±0.09 4.59±0.10
Yellow bantam
CC 15.15±2.00 19.22±3.28 9.90±0.75 7.95±0.57 8.33±0.42 11.54±0.68 4.66±0.15 4.18±0.19 CT 11.44±1.12 14.74±1.83 8.48±0.42 7.40±0.32 7.73±0.23 10.48±0.38 4.47±0.08 4.12±0.11 TT 13.10±0.65 17.72±1.07 8.93±0.25 7.48±0.19 7.94±0.14 11.00± 0.22 4.53±0.05 4.05±0.06
SNP6(64474300C>T)
Avian
CC 20.55±0.69 30.55±1.24 9.98±0.19 9.17±0.32 9.05±0.10 12.18±0.11 4.78±0.07 4.59±0.11 CT 20.50±0.82 30.90±1.46 10.29±0.22 9.48±0.38 9.33±0.12 12.48±0.13 4.75±0.09 4.54±0.13 TT 16.80±2.50 25.10±4.78 9.32±0.68 0.90±1.16 8.78±0.36 11.99±0.41 4.57±0.27 4.30±0.38
Yellow bantam
CC 12.92±0.70 17.46±1.14 8.90±0.26 7.41±0.02 7.85±0.14 10.88±0.24 4.50±0.05 4.03±0.07 CT 11.67±1.02 14.97±1.67 8.39±0.38 7.33±0.03 7.84±0.21 10.58±0.35 4.48±0.08 4.09±0.10 TT 15.38±1.57 20.54±2.57 10.01±0.58 8.28±0.04 8.47±0.32 11.88±0.53 4.70±0.12 4.26±0.15
SNP7(64474290C>G)
Avian
CC 20.55±0.70 30.55±1.25 9.98±0.19 9.17±0.32 9.05±0.10 9.05±0.11 4.78±0.08 4.59±0.11 CG 20.31±0.81 30.52±1.45 10.22±0.22 9.42±0.37 9.31±0.12 9.31±0.13 4.75±0.09 4.53±0.12 GG 17.75±3.09 27.65±5.53 9.75±0.84 9.63±1.43 8.84±0.44 8.84±0.50 4.55±0.33 4.30±0.47
Yellow bantam
680
, Y
in H, Y
e M,
ang Y
Detection of SNPs in the BMP6 Gene and Their
Association with Carcass and Bone T
raits in Chicken
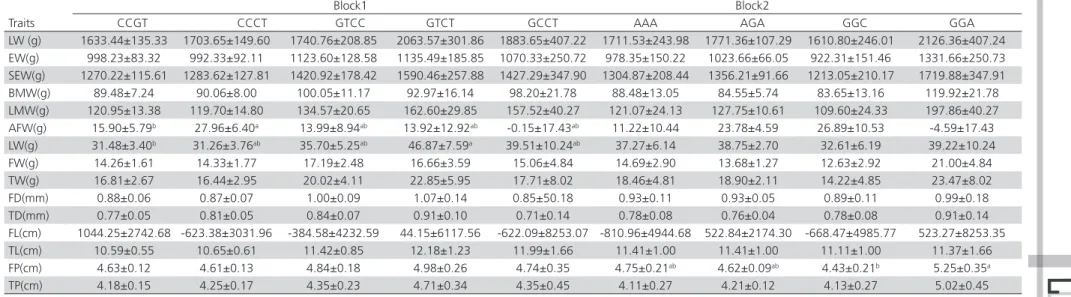
EW(g) 998.23±83.32 992.33±92.11 1123.60±128.58 1135.49±185.85 1070.33±250.72 978.35±150.22 1023.66±66.05 922.31±151.46 1331.66±250.73 SEW(g) 1270.22±115.61 1283.62±127.81 1420.92±178.42 1590.46±257.88 1427.29±347.90 1304.87±208.44 1356.21±91.66 1213.05±210.17 1719.88±347.91 BMW(g) 89.48±7.24 90.06±8.00 100.05±11.17 92.97±16.14 98.20±21.78 88.48±13.05 84.55±5.74 83.65±13.16 119.92±21.78 LMW(g) 120.95±13.38 119.70±14.80 134.57±20.65 162.60±29.85 157.52±40.27 121.07±24.13 127.75±10.61 109.60±24.33 197.86±40.27 AFW(g) 15.90±5.79b 27.96±6.40a 13.99±8.94ab 13.92±12.92ab -0.15±17.43ab 11.22±10.44 23.78±4.59 26.89±10.53 -4.59±17.43
LW(g) 31.48±3.40b 31.26±3.76ab 35.70±5.25ab 46.87±7.59a 39.51±10.24ab 37.27±6.14 38.75±2.70 32.61±6.19 39.22±10.24
FW(g) 14.26±1.61 14.33±1.77 17.19±2.48 16.66±3.59 15.06±4.84 14.69±2.90 13.68±1.27 12.63±2.92 21.00±4.84 TW(g) 16.81±2.67 16.44±2.95 20.02±4.11 22.85±5.95 17.71±8.02 18.46±4.81 18.90±2.11 14.22±4.85 23.47±8.02 FD(mm) 0.88±0.06 0.87±0.07 1.00±0.09 1.07±0.14 0.85±50.18 0.93±0.11 0.93±0.05 0.89±0.11 0.99±0.18 TD(mm) 0.77±0.05 0.81±0.05 0.84±0.07 0.91±0.10 0.71±0.14 0.78±0.08 0.76±0.04 0.78±0.08 0.91±0.14 FL(cm) 1044.25±2742.68 -623.38±3031.96 -384.58±4232.59 44.15±6117.56 -622.09±8253.07 -810.96±4944.68 522.84±2174.30 -668.47±4985.77 523.27±8253.35 TL(cm) 10.59±0.55 10.65±0.61 11.42±0.85 12.18±1.23 11.99±1.66 11.41±1.00 11.41±1.00 11.11±1.00 11.37±1.66 FP(cm) 4.63±0.12 4.61±0.13 4.84±0.18 4.98±0.26 4.74±0.35 4.75±0.21ab 4.62±0.09ab 4.43±0.21b 5.25±0.35a
TP(cm) 4.18±0.15 4.25±0.17 4.35±0.23 4.71±0.34 4.35±0.45 4.11±0.27 4.21±0.12 4.13±0.27 5.02±0.45
Note: The different lowercase letters on the same line indicate significant difference (p< 0.05).
Table 8 – Association of the haplotypes of BMP6 gene with bone traits and carcass traits in the Avian populations
Block1 Block2
Traits CCGT CCCT GTCC GTCT AAA AGA GGC
LW (g) 2354.36±176.65 2413.51±217.95 2204.36±465.61 2316.29±413.79 1192.77±408.50 2980.84±166.39 2792.77±311.90 EW(g) 1538.67±136.65 1553.79±168.60 1478.66±360.17 1547.68±320.08 701.04±315.99B 2017.02±128.71A 1871.04±241.26A
SEW(g) 2081.75±1812.38 1579.83±2236.02 1936.75±4776.90 1546.49±4245.28 614.45±4191.02B 2699.71±1707.08A 2044.45±3199.90A
BMW(g) 217.48±28.23 227.28±34.83 214.58±74.41 238.07±66.13 71.30±65.28B 296.89±26.59A 304.87±49.84A
LMW(g) 180.79±19.49 175.23±175.23 204.99±51.37 167.61±45.66 72.35±45.07B 265.75±18.36A 208.36±34.41A
AFW(g) 22.17±7.49 31.39±9.24 6.47±19.74 33.33±17.54 31.14±17.32 20.61±7.05 18.27±13.22 LW(g) 42.12±4.89 42.80±6.03 36.62±12.88 33.19±11.45 19.90±11.30b 50.89±4.60a 45.26±8.63ab
FW(g) 15.71±1.99 15.50±2.45 18.11±5.24 11.53±4.66 9.35±4.60b 20.29±1.87a 16.00±3.51ab
TW(g) 20.94±3.39 18.48±4.18 31.84±8.93 9.74±7.94 6.52±7.83b 30.81±3.19a 23.41±5.98ab
FD(mm) 0.93±0.06 0.91±0.07 0.98±0.15 0.84±0.13 0.78±0.13 1.00±0.05 0.96±0.10 TD(mm) 0.75±0.09 0.70±0.12 0.89±0.25 0.81±0.22 0.56±0.22b 0.98±0.09a 0.82±0.17ab
FL(cm) 8.47±0.28 8.73±0.34 8.70±0.73 7.64±0.65 7.64±0.65b 9.08±0.26a 9.04±0.49a
TL(cm) 11.19±0.30 11.28±0.37 11.80±0.80 10.39±0.71 9.35±0.70B 12.32±0.29A 11.82±0.54A
FP(cm) 4.73±0.22 4.51±0.27 4.13±0.59 4.93±0.52 4.54±0.51 4.64±0.21 4.54±0.39 TP(cm) 4.24±0.32 4.00±0.39 3.94±0.83 4.42±0.74 3.91±0.73 4.53±0.30 4.01±0.56
haplotypes in block 1 (CCGT, CCCT, GTCC, GTCT) had no significant differences among characters while block 2 (AAA, AGA, GGC) were significantly correlated among most of the characteristics. There into, AAA haplotype individuals were significantly correlated in AGA and GGC haplotype individuals among EW, SEW, BMW, LMW, TL (p<0.01) respectively. AAA haplotype individuals were also significantly different with AGA haplotype individuals among LW, FW, TW, TD respectively (p<0.05). AGA and GGC haplotype individuals had significant differences with AAA haplotype individuals in FL (p<0.05).
DISCUSSION
Multiple genes have controlled carcass traits and skeleton traits separately (Fontanesi et al., 2008;
Bolormaa et al., 2011). Analyzing the association
between candidate genes and productive traits is an advisable way to understand whether specific genes are correlated with specific traits in economic animals and we can take advantage of DNA tests in animal breeding as selection tools (De Vries, et al., 1998).
Although several studies indicated that the SNPs of the BMP6 gene is involved in peripheral bone mineral density (Choi et al., 2006), avascular necrosis (Ulug et al., 2009), sickle cell osteonecrosis of human (Baldwin et al., 2005). At present, studies of BMP6 showed that it is more focused on human disease such as hepatic fibrosis, iron overload disease (Kleven et al., 2016), prostate cancer-associated disease (Turner and Edwards, 2016) and so on. Nevertheless, BMP6 was chose to be a candidate of meat quality (Lee et al., 2014).
In this study, the different variant PCR products were sequenced. Due to the rate of recombination, selection and foreign blood imported in the chicken population, the alleles and genotypes of loci 64475440C>T and loci 64463906T>C were unsuitable and were removed from statistic analysis because the Hardy-Weinberg equilibrium is impacted by many factors such as the rate of mutation, the rate of recombination, selection, genetic drift, the system of mating, population structure, and genetic linkage (Liu et al., 2015).
Then we explored the correlation between SNPs and carcass, skeletal traits. In carcass traits, there were no significant differences with any carcass traits among SNPs. A previous report indicated that mice fed with high-fat diet caused reduction of BMP6 gene expression in visceral adipose tissue (Gotarod et al., 2013), whereas there were no reports showing detailed mechanism of BMP6 gene in abdominal fat and it needs further research. In contrast to other BMPs
(BMP2, BMP4, BMP9), BMP6 is a key endogenous regulator of hepcidin expression and iron metabolism
(Andriopoulos et al., 2009). Lacking of the BMP6
induces massive iron overload in the liver of BMP6-deficient mice (Meynard et al., 2009). However, no researches showed if BMP6 is related to liver weight directly or not. As for the skeletal traits, Kugimiya et al., initially investigated the size of the growth plate
of proximal tibias in the BMP2+/-BMP6-/-
compound-deficient mouse which were significantly smaller than
the wild types(Kugimiya et al., 2005), and our studies
that SNP3 in Avian was significant associated with FW, TW, FL (p<0.05), and TL(p<0.01) were consistent with it. Recently, a research disclosed that exogenous heparin reduced the BMP6 osteogenic activity by using μCT analysis of femur in the mice with osteoporotic
(Brkljacic et al., 2013). Both SNP1 and SNP3 had
significant correlation with FP (p<0.05). While there is no other research focused on the association between the skeletal traits and BMP6 in economic animals. Our experiment dates indicated that it seems to be no relevance between SNPs between skeleton traits in the Bantam yellow. The reasons for this phenomenon and expression pattern in these two different kinds of strains are still waiting for for discovery. All this adds up to the result that the single locus of SNPs of BMP6 has no direct correlation to carcass traits in these two chicken populations, but was relevant to skeleton traits in the Avian population.
advantageous genotypes which promote carcass and skeletal traits of chicken. In Yellow bantam population, block 2 only correlated with FP significantly (p<0.05).
It can be concluded that there is difference between the Avian and Bantam yellow in various aspects. However, based on our experiment, the polymorphism in BMP6 gene in chicken causes little difference. Analyzing the reasons of all results, first, we sequenced partially of BMP6 sequence and BMP6 gene may have controlled growth and development of chicken in other ways. As a gene serves as bone morphogenetic, we may study BMP6 gene from a new angle of view to find its distinguished function in chicken.
ACKNOWLEDGEMENTS
We thank Yao Zhang and Ling Ye for their help in sample collection. This work was financially supported by Scientific research fund of Sichuan Provincial education department (15ZA0025), the Thirteenth Five Year Plan for Breeding Program in Sichuan (2016NYZ0050) and the China Agriculture Research System (CARS-41).
REFERENCE
Andriopoulos B Jr, Corradini E, Xia Y, Faasse SA, Chen S, Grgurevic L, et al.
BMP6 is a key endogenous regulator of hepcidin expression and iron metabolism. Nature Genetics 2009;41(4):482-487.
Baldwin C, Nolan VG, Wyszynski DF, Ma QL, Sebastiani P, Embury SH, et al.
Association of klotho, bone morphogenic protein 6, and annexin A2 polymorphisms with sickle cell osteonecrosis. Blood 2005;106(1):372-375.
Bolormaa S, Neto LR, Zhang YD, Bunch RJ, Harrison BE, Goddard ME,
et al. A genome-wide association study of meat and carcass traits in Australian cattle. Journal of Animal Science 2011;89(8):2297-2309.
Brkljacic J, Pauk M, Erjavec I, Cipcic A, Grgurevic L, Zadro R, et al. Exogenous heparin binds and inhibits bone morphogenetic protein 6 biological activity. International Orthopaedics 2013;37(3):529-541.
Camaschella C. BMP6 orchestrates iron metabolism. Nature Genetics 2009;41(4):386-8.
Celeste AJ, Iannazzi JA, Taylor RC, Hewick RM, Rosen V, Wang EA, et al.
Identification of transforming growth factor beta family members present in bone-inductive protein purified from bovine bone. Proceedings of the National Academy of Sciences of the United States of America 1990;87(24):9843-9847.
Corradini E, Meynard D, Wu Q, Chen S, Ventura P, Pietrangelo A, et al.
Serum and liver iron differently regulate the bone morphogenetic protein 6 (BMP6)-SMAD signaling pathway in mice. Hepatology 2011;54(1):273-284.
Choi JY, Shin CS, Hong YC, Kang D. Single-nucleotide polymorphisms and haplotypes of bone morphogenetic protein genes and peripheral bone mineral density in young Korean men and women. Calcified Tissue International 2006;78(4):203-211.
Daher R, Kannengiesser C, Houamel D, Lefebvre T, Bardou-Jacquet E, Ducrot N, et al. Heterozygous mutations in bmp6 pro-peptide lead to inappropriate hepcidin synthesis and moderate iron overload in humans. Gastroenterology 2016;150(3):672-683.
De Vries AG, Sosnicki A, Garnier JP, Plastow GS. The role of major genes and DNA technology in selection for meat quality in pigs. Meat Science 1998;49:S245-S55.
Fonseca S, Wilson IJ, Horgan GW, Maltin CA. Slow fiber cluster pattern in pig longissimus thoracis muscle:implications for myogenesis. Journal of Animal Science 2003;81(4):973-983.
Fontanesi L, Davoli R, Nanni Costa L, Beretti F, Scotti E, Tazzoli M, et al.
Investigation of candidate genes for glycolytic potential of porcine skeletal muscle: association with meat quality and production traits in Italian Large White pigs. Meat Science 2008;80(3):780-787.
Gotardo ÉM, dos Santos AN, Miyashiro RA, Gambero S, Rocha T, Ribeiro ML, et al. Mice that are fed a high-fat diet display increased hepcidin expression in adipose tissue. Journal of Nutritional Science and Vitaminology 2013;59(5):454-461.
Grimsrud CD, Romano PR, D’souza M, Puzas JE, Reynolds PR, Rosier RN,
et al. BMP-6 is an autocrine stimulator of chondrocyte differentiation. Journal of Bone and Mineral Research 1999;14(4):475-482.
Huang HJ, Wu JC, Su P, Zhirnov O, Miller WL. A novel role for bone morphogenetic proteins in the synthesis of follicle-stimulating hormone. Endocrinology 2001;142(6):2275-2283.
Kleven MD, Enns CA, Zhang AS. Bone Morphogenetic Protein-6 Mutations Take Their Place in Iron Overload Diseases. Gastroenterology 2016;150(3):556-559.
Kugimiya F, Kawaguchi H, Kamekura S, Chikuda H, Ohba S, Yano F, et al. Involvement of endogenous bone morphogenetic protein (BMP) 2 and BMP6 in bone formation. Journal of Biological Chemistry 2005;280(42):35704-35712.
Lee T, Shin DH, Cho S, Kang HS, Kim SH, Lee HK, et al. Genome-wide association study of integrated meat quality-related traits of the Duroc pig breed. Asian-Australasian Journal of Animal Science 2014;27(3):303-309.
Liu XQ, Wang F, Jin J, Zhou YG, Ran JS, Feng ZQ, et al. MyD88 polymorphisms and association with susceptibility to salmonella pullorum. BioMed Research International 2015;2015:692973.
Lyons KM, Pelton RW, Hogan BLM. Patterns of expression of murine Vgr-1 and BMP-2a RNA suggest that transforming growth factor-beta-like genes coordinately regulate aspects of embryonic development. Genes and Development 1989;3(11):1657-1668.
Mehler MF, Mabie PC, Zhang D, Kessler JA. Bone morphogenetic proteins in the nervous system. Trends NeuroSciences 1997;20(7):309-317. Meynard D, Kautz L, Darnaud V, Canonne-Hergaux F, Coppin H, Roth MP.
Lack of the bone morphogenetic protein BMP6 induces massive iron overload. Nature Genetics 2009;41(4):478-481.
Sato M, Ochi T, Nakase T, Hirota S, Kitamura Y, Nomura S, et al. Mechanical tension-stress induces expression of bone morphogenetic protein (BMP)-2 and BMP-4, but Not BMP-6, BMP-7, and GDF-5 mRNA, during distraction osteogenesis. Journal of Bone and Mineral Research 1999;14(7):1084-1-95.
Solloway MJ, Dudley AT, Bikoff EK, Lyons KM, Hogan BL, Robertson EJ. Mice lacking BMP6 function. Developmental Genetics 1998;22(4):321-339.
Sugiura K, Su YQ, Eppig JJ. Does bone morphogenetic protein 6 (BMP6) affect female fertility in the mouse? Biology of Reproduction 2010;83(6):997-1004.
Turner CJ, Edwards CM. The role of the microenvironment in prostate cancer-associated bone disease. Current Osteoporosis Reports 2016;14(5):170-177.
Ulug P, Vasavda N, Awogbade M, Cunningham J, Menzel S, Thein SL. Association of sickle avascular necrosis with bone morphogenic protein 6. Annals of Hematology 2009;88(8):803-805.
Urist MR. Bone: formation by autoinduction. Science 1965;150(3698):893-899.