Performance and carcass characteristics of dairy steers fed diets containing
crude glycerin
Raylon Pereira Maciel1, José Neuman Miranda Neiva2, João Restle2, Fabrícia Rocha Chaves Miotto2, Luciano Fernandes Sousa2, Odislei Fagner Ribeiro Cunha3, Sandro Estevan Moron2,
Ranniere Rodrigues Pereira Parente4 1 Universidade Federal Rural da Amazônia, Campus de Parauapebas, PA, Brazil.
2 Universidade Federal do Tocantins, Araguaína, TO, Brazil. 3 Cargill® Animal Nutrition, Araguaína, TO, Brazil. 4 DSM│Tortuga, Palmas, TO, Brazil.
ABSTRACT - The objective of the study was to assess the effects of including 0, 79.8, 159.8, and 240.0 g kg–1 crude
glycerin in the total diet dry matter on the 84 days feedlot performance, nutrient digestibility, blood parameters, and carcass characteristics of crossbred dairy steers. Experimental diets were composed of 98.5 g kg–1 of sorghum silage and 901.5 g kg–1
of concentrate. Twenty-four crossbred dairy steers (337.3±39.8 kg body weight and 15 months of age) were distributed in a completely randomized design with four treatments and six replicates. The intake and digestibility of the dry matter and nutrients were not altered by including crude glycerin in the diet. Crude glycerol levels did not affect the final weight (430.2 kg), daily weight gain (1.38 kg day–1), total weight gain (97.2 kg), hot carcass weight (218.9 kg), cold carcass weight
(215.2 kg), hot carcass yield (0.50 kg 100 kg–1 BW), longissimus dorsi area (62.86 cm²), subcutaneous fat thickness (4.05 mm),
and carcass physical composition. Concentrations of serum glucose, triglycerides, total cholesterol, high-density lipoprotein cholesterol, and creatinine were not altered by including crude glycerin in the diet. Crude glycerin can be added to high concentrate diet up to 240 g kg–1 without changing the animal performance, apparent digestibility of nutrients, the main carcass
characteristics, and blood parameters of finishing crossbred dairy steers.
Key Words: biodiesel, byproducts, carcass yield, dairy males, weight gain
ISSN 1806-9290
www.sbz.org.br R. Bras. Zootec., 45(11):677-685, 2016
Received October 18, 2015 and accepted August 12, 2016. Corresponding author: raylonmaciel@gmail.com http://dx.doi.org/10.1590/S1806-92902016001100006
Copyright © 2016 Sociedade Brasileira de Zootecnia. This is an Open Access article distributed under the terms of the Creative Commons Attribution License (http://creativecommons.org/licenses/by/4.0/), which permits unrestricted use, distribution, and reproduction in any medium, provided the original work is properly cited.
Introduction
The Brazilian meat production is based manly on beef cattle. However, with the increase in milk production in recent years, the production of dairy-origin males emerges as an option of meat production. Finishing dairy-origin males in the feedlot is an alternative to make meat production from these animals more attractive for producers, reduce slaughter age, and improve the quality of meat. Nevertheless, high-concentrate feedlot diets may result in significant increase in the feed cost (Missio et al., 2009). Thus, the use of alternative feedstuff sources can enable the production of dairy-origin males in feedlot.
Currently, with the expansion of the biodiesel industry, crude glycerin has raised interest because of its availability and potential as an energetic ingredient in ruminant feed
(Parsons et al., 2009; Mach et al., 2009; Van Cleef et al., 2014). The conversion of triglycerides into methyl esters in the transesterification process, approximately 100 g kg–1 of the weight of the oil going into the process, will end up with crude glycerin as a byproduct at the completion of the reaction (Plá, 2002). This availability may result in reduction of the cost of feed energy source when compared with traditional feed.
In this sense, crude glycerin is potentially a large alternative source of energy available to replace corn in high concentrate diet of the finishing dairy-origin males. Therefore, information of the effects of the use of crude glycerin in diet on performance, carcass characteristics, blood parameters, and nutrient digestibility of dairy-origin males is required. The objective of the present study was to assess diets containing levels of crude glycerin to crossbred dairy steer finished in feedlot.
Material and Methods
The study was carried out in Araguaína, TO, Brazil. Four experimental diets were assessed containing 0, 79.8, 159.8, or 240 g kg–1 crude glycerin in the dry matter (DM). We used twenty-four 15-month-old dairy crossbred (Holstein × Zebu) steers, with an initial average body weight of 337.3±39.8 kg. The experimental design was completely randomized with four treatments (levels of crude glycerin in the diets) and six replicates (animals). Previously to the feedlot, the animals were kept grazing Mombaça grass during four months, supplemented with concentrate with the same levels of crude glycerin (treatments) used in the feedlot diets. During this period, the amount of supplement given to the animals was equivalent to 750 g 100 kg–1 of the body weight.
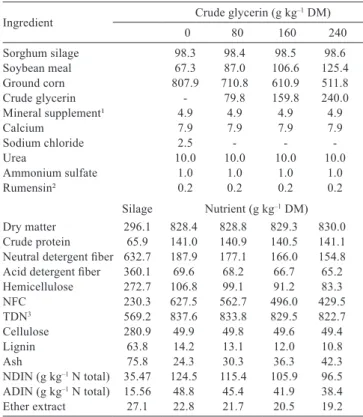
The diets were formulated to maintain the ratio of 100 g kg–1 sorghum silage and meet the requirements for average daily gain of 1.28 kg day–1, according to NRC (1996) (Table 1). According to the manufacturer’s data, the crude glycerin used (GENPA® 80 - Nutritional Energetic Glycerol for Animal Feeding) had 899.8 g kg–1 DM; 11.9 g ether extract kg–1 DM; 78.6 g mineral matter kg–1 DM; 803.5 g glycerol kg–1 DM; <0.001 g methanol kg–1 DM; and 74.7 g chloride kg–1 DM.
The animals were fed once a day at 09.00 h ad libitum, i.e., adjusted to provide 100 g kg–1 as orts of the offered feed (DM basis). To obtain the average feed intake, feed and orts were weighed daily. Previously, the animals received a vermifuge (1% moxidectin), injectable ADE vitamin complex, and vaccination against clostridioses. Animals were weighed at the start of the experiment and then housed in individual pens (12 m²), with a beaten earth floor, provided with covered individual troughs and one drinker for every two pens. Animal performance was measured for 84 days, which consisted of 14 days of adaptation to diet and stalls and 70 days of data collection divided into two sub periods of 21 days and one period of 28 days. At the beginning and end of each experimental sub period, the animals were weighed in the morning, before feed supply.
Apparent digestibility of nutrients was determined in three consecutive days of the experimental period (days 67-70). Feces collection (300 g) was performed manually, after spontaneous defecation and before the fecal bolus reached the floor of the pen, with animals monitored from 06.00 h until the collection of the sample from the last animal. From the three samples, a composite sample was made and stored in plastic bags and frozen at −20 °C. Samples were pre-dried in a forced-air oven at 55 ºC for 72 h and ground in a 2-mm sieve. Fecal dry matter excretion was estimated using indigestible neutral detergent fiber (iNDF) according to the methodology of Cochran et al. (1986). The
iNDF contents of the samples of feces, feed (roughage and ingredients of the concentrate), and orts were obtained after
in situ rumen incubation for 240 h. The fecal output was
calculated as: kg of DM day–1 = intake of iNDF/iNDF in feces. The digestibility was calculated by the expression: apparent digestibility of nutrients = (nutrient intake – nutrient excreted/nutrient intake).
Samples of concentrate, silage, and orts were collected weekly. All samples were pre-dried in a forced-air oven at 55 ºC for 72 h and ground in a 1-mm sieve. Standard procedures of AOAC (2005) were adopted to obtain the following components from the feed, orts, and fecal samples: DM, ash (method 942.05), and crude protein (CP) (method 984.13). The organic matter (OM) was calculated as the difference between DM and ash contents. Neutral detergent fiber (NDF), acid detergent fiber (ADF), ether extract (EE), neutral detergent insoluble nitrogen, acid detergent insoluble nitrogen, and lignin were determined according to the methodology described and recommended by the manufacturer of the ANKON apparatus. For NDF analysis, samples were treated with thermo-stable
alpha-Ingredient Crude glycerin (g kg–1 DM)
0 80 160 240
Sorghum silage 98.3 98.4 98.5 98.6
Soybean meal 67.3 87.0 106.6 125.4
Ground corn 807.9 710.8 610.9 511.8
Crude glycerin - 79.8 159.8 240.0
Mineral supplement¹ 4.9 4.9 4.9 4.9
Calcium 7.9 7.9 7.9 7.9
Sodium chloride 2.5 - -
-Urea 10.0 10.0 10.0 10.0
Ammonium sulfate 1.0 1.0 1.0 1.0
Rumensin² 0.2 0.2 0.2 0.2
Silage Nutrient (g kg–1 DM)
Dry matter 296.1 828.4 828.8 829.3 830.0
Crude protein 65.9 141.0 140.9 140.5 141.1 Neutral detergent fiber 632.7 187.9 177.1 166.0 154.8 Acid detergent fiber 360.1 69.6 68.2 66.7 65.2
Hemicellulose 272.7 106.8 99.1 91.2 83.3
NFC 230.3 627.5 562.7 496.0 429.5
TDN3 569.2 837.6 833.8 829.5 822.7
Cellulose 280.9 49.9 49.8 49.6 49.4
Lignin 63.8 14.2 13.1 12.0 10.8
Ash 75.8 24.3 30.3 36.3 42.3
NDIN (g kg–1 N total) 35.47 124.5 115.4 105.9 96.5 ADIN (g kg–1 N total) 15.56 48.8 45.4 41.9 38.4
Ether extract 27.1 22.8 21.7 20.5 19.2
DM - dry matter; NFC - non-fibrous carbohydrates; TDN - total digestible nutrients; NDIN - neutral detergent insoluble nitrogen; ADIN - acid detergent insoluble nitrogen.
1 Composition: Ca (max), 269 g kg–1; Ca (min), 220 g kg–1; P (min), 160 g kg–1; Mg,
10 g kg–1; S, 15 g kg–1; Zn, 5472 mg kg–1; Fe, 2610 mg kg–1; Cu, 2100 g kg–1; Mn,
992 mg kg–1; Co, 200 mg kg–1; I, 124 mg kg–1; Se, 45 mg kg–1; F (max), 1476 mg;
Sol. phosphorus/AC Citric 2% (max), 90%.
2 10 g 100 g–1 monensin.
3 Estimated by the equations of the NRC (2001).
amylase without sodium sulfite according to Van Soest et al. (1991). The non-fibrous carbohydrates were calculated by the equation (Hall, 2000): NFC = 100 – [(% CP – % CPfromurea + % urea) + NDFap + %EE + % ash], in which NDFap = neutral detergent fiber corrected for ash and protein. The total digestible nutrient values were estimated for the different diets by the equation: TDN = DCP + (DEE × 2.25) + DNDF + DNFC (Sniffen et al., 1992), in which DCP = digestible crude protein; DEE = digestible ether extract; DNDF = digestible neutral detergent fiber; and DNFC = digestible non-fibrous carbohydrates. The TDN content was calculated by the equation (Sniffen et al., 1992): TDN = TDN intake/DM intake.
Two blood samples (one tube containing sodium fluoride and another with potassium EDTA) were collected from every animal at the start of the experiment and at the end of each experimental sub period, totaling four collections, by puncturing the jugular vein using vacuum tube (Vacutainer®). The blood samples were centrifuged at 2000 × g for 20 min to obtain the serum. Next, the serum was separated by aspiration, divided into aliquots, placed in plastic tubes with a lid (Eppendorf®), identified, and frozen in a freezer at –20 °C until biochemical analyses. The biochemical analysis parameters of serum (triglycerides, total cholesterol total, high-density lipoprotein (HDL), urea, albumin, creatinine, aminotransferase aspartate, alanine transaminase, and glucose) were carried out at 37 °C, using commercial reagents (Labtest Diagnóstica S.A.®, Lagoa Santa, MG). The samples from the tubes containing sodium fluoride were used to determine the glucose concentration. An automatic biochemical analyzer, a Bioplus® model Bio-2000 IL–A spectrophotometer, was used to read the reactions.
After the experimental period, the animals were weighed (slaughter weight - SW) and transported to a commercial slaughterhouse with Federal Inspection Service. After slaughter, carcasses were washed, sawn in half, and weighed; in the cleaning process, the fat trimmings were collected from the half carcasses, so hot carcass weight (HCW), individually, and the weight of the fat trimmings were determined. Whole carcass weight (WCW) was obtained by adding the hot carcass weight with the respective weights of the fat trimmings. Afterwards, the carcasses were cooled in a cold room at 0 to 2 ºC for 24 h. After this period, they were weighed again, so the cold carcass weight (CCW) was determined and then used to determine the cold carcass yield (CCY) and cooling loss (CL), as follows: CCY = (CCW/SW), and CL = [(HCW – CCW)/HCW] × 100. The hot carcass yield and whole hot carcass yield were obtained by using the
formulas HCY = (HCW/SW) and WHCY = (WHCW/SW), respectively.
A cut was made on the right half of the carcass between the 12th and 13th ribs to expose the longissimus dorsi
muscle and the outline of the area of this muscle was drawn on paper. After using the ImageJ® program, the longissimus
dorsi area (LDA) was measured and expressed in cm². The
subcutaneous fat thickness (SFT) was determined as the mean of two readings around the longissimus dorsi muscle. Further on, the exposed surface of the longissimus dorsi
muscle, after a 30-min exposure to air, underwent subjective evaluations of the intramuscular fat (marbling), color, and texture of the meat (Müller, 1987). The carcass physical composition was estimated following the methodology by Hankins and Howe (1946).
The left half of the carcass was separated into the three primary cuts: forequarter, pistol cut, and short ribs. The cuts were weighed to obtain their yield in relation to the cold carcass weight. The pistol cut was separated into ten commercial or secondary cuts, carried out following the slaughterhouse routine (rump cap, tail of rump, rump uk trim, topside, silverside, shank, tenderloin, striploin, knuckle, eye of round, cuberoll, and thin flank); then, each piece was weighed to assess the meat yield of the pistol cut and the weight of the individual commercial cuts. The edible portion included the secondary commercial cuts and meat trimmings were intended for human consumption.
Before the statistical analysis, the assumptions of normal distribution and homoscedasticity for all the variables were verified. The initial weight was utilized as a co-variable, and when not significant, it was withdrawn from the model; in all quantitative and normal variables, variance (F test) and regression analysis were performed.
statistical analysis was conducted using SAS (Statistical Analysis System, version 9.1).
Results
Inclusion of crude glycerin in the diet did not affect dry matter (DM) intake and apparent digestibility of CP, NDF, NFC, EE, and the TDN values (Tables 2 and 3). In addition, inclusion of crude glycerin in diet did not change the average daily weight gain, total weight gain, final weight, and the feed conversion of the animals (Table 2).
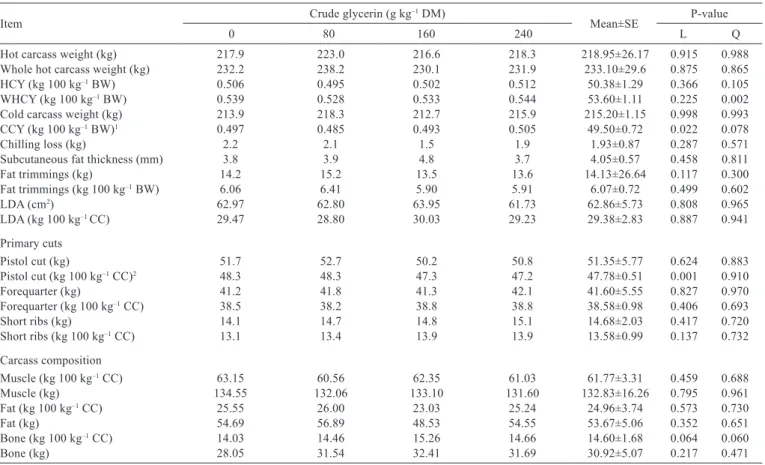
The HCW, WHCW, CCW, hot carcass yield (HCY), WHCY, fat trimmings, chilling loss, and SFT (Table 4) were not altered with the inclusion of crude glycerin in the diet. However, CCY increased linearly with inclusion of crude glycerin.
Inclusion of crude glycerin had no effect on the weight of carcass primary cuts (pistol cut, forequarter, and short ribs) and the proportion of the forequarter and the short ribs in relation to the CCW (Table 4). However, the proportion of pistol cut (kg 100 kg–1 cold carcass) decreased linearly as the crude glycerin level increased. The physical composition of the carcasses was not altered with inclusion of crude glycerin in the diet (Table 6). Similarly,
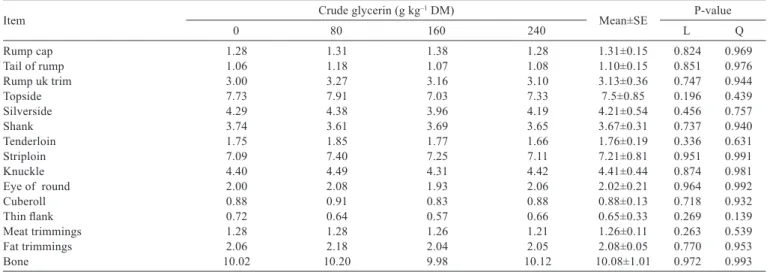
no significant effect of dietary treatments was observed on LDA (62.86 cm2), LDA 100 kg–1 (29.28 cm2 100 kg–1 cold carcass), and conformation. The characteristics that assessed the meat quality, color, texture, and marbling were not altered by including crude glycerin in the diet (Table 7). No effects were observed of the levels of crude glycerin on secondary cuts of the pistol cut when expressed in absolute weight (Table 4) as well for the weights of the trimmings of meat, fat, and bone of the pistol cut.
Including crude glycerin in diet did not affect blood concentrations of serum glucose, triglycerides, total cholesterol, HDL, and creatinine. However, variations were observed across days of sampling in feedlot on these parameters of serum. The concentrations of serum glucose and total cholesterol concentrations increased linearly by 9.25 and 18.17 mg L–1, while the HDL concentration decreased by 0.029 mg L–1 across days of sampling in feedlot (1st, 22nd, 43rd, and 64th day). The concentrations of serum triglyceride and creatinine had a quadratic effect with greatest value observed at the second (22nd day) and third collections (45th day), respectively, estimated by regression equations. The concentrations of serum albumin, urea, aminotransferase alanine, and aminotransferase aspartate were not affected by the inclusion of crude glycerin or time of collection.
Item Crude glycerin (g kg
–1 DM)
Mean±SE P-value
0 80 160 240 L Q
Dry matter (kg day–1) 8.06 9.05 8.09 7.39 8.1±1.49 0.287 0.217
Dry matter (kg 100 kg–1 BW) 2.07 2.24 2.05 1.88 2.1±0.32 0.216 0.211
Crude protein (kg day–1) 1.03 1.22 1.11 1.02 1.1±0.19 0.751 0.221
Neutral detergent fiber (kg day–1) 1.45 1.64 1.4 1.27 1.4±0.26 0.120 0.102
Non-fibrous carbohydrate (kg day–1) 5.32 5.87 5.24 4.72 5.3±0.96 0.181 0.164
Ether extract (kg day–1) 0.30 0.32 0.29 0.27 0.3±0.05 0.191 0.268
Total digestible nutrients (kg day–1) 6.25 6.98 6.25 5.78 6.3±1.22 0.343 0.238
Initial weight (kg) 339.2 336.9 335.7 337.3 - -
-Final weight (kg) 425.4 446.3 428.9 420.3 430.2±47.09 0.709 0.928
Average daily gain (kg day–1) 1.305 1.628 1.363 1.257 1.388±0.31 0.475 0.177
Total weight gain (kg) 91.4 113.9 95.4 88.0 97.2±21.6 0.475 0.177
Feed conversion (kg DM/kg BW) 5.9 5.5 5.9 5.8 5.8±0.75 0.998 0.471
BW - body weight; DM - dry matter; FC - feed conversion; L - linear; Q - quadratic; SE - standard error. Table 2 - Dry matter and performance of diets with inclusion of crude glycerin
Item Crude glycerin (g kg–1 DM) Mean±SE P-value
0 80 160 240 L Q
Dry matter 0.71 0.71 0.72 0.75 0.72±5.78 0.243 0.499
Crude protein 0.72 0.73 0.73 0.75 0.73±7.27 0.515 0.797
Neutral detergent fiber 0.43 0.43 0.43 0.45 0.44±10.67 0.734 0.850
Non-fibrous carbohydrates 0.83 0.83 0.83 0.85 0.84±4.89 0.402 0.675
Ether extract 0.71 0.71 0.71 0.75 0.72±9.09 0.495 0.618
Total digestible nutrients (g kg–1) 773 773 770 788 776±5.24 0.661 0.822
DM - dry matter; L - linear; Q - quadratic; SE - standard error.
Discussion
Lack of effect of crude glycerin inclusion in the diet of cattle on DM intake is consistent with prior literature (Mach et al., 2009; Leão et al., 2012; Bortoñ et al., 2013). Dry matter intake is determinant for nutrient ingestion; thus the intakes of CP, NDF, NFC, EE, and TDN are directly linked to the behavior observed for DM intake. The purity of the glycerin is reported as a determinant factor to prevent possible adverse effects of crude glycerin, such as reduction in feed intake (Chung et al., 2007). The different protocols used in the biodiesel refineries result in a large content of
substances such as salts, methanol, and fatty acids used in the transesterification process that may have a negative effect on dry matter intake (Schröder and Südekum, 1999; Elam et al., 2008). However, the crude glycerin used had a high proportion of glycerol (899.8 g kg–1 DM) and low quantity of contaminants, which justified the animal performance observed.
The results obtained in the present study for diet digestibility are in agreement with previous studies that did not report effect from including crude glycerin on apparent nutrient digestibility (Avila-Stagno et al., 2012; Kass et al., 2012; Boyd et al. 2013). However, results contrary to
Item Crude glycerin (g kg–1 DM) Mean±SE P-value
0 80 160 240 L Q
Hot carcass weight (kg) 217.9 223.0 216.6 218.3 218.95±26.17 0.915 0.988
Whole hot carcass weight (kg) 232.2 238.2 230.1 231.9 233.10±29.6 0.875 0.865
HCY (kg 100 kg–1 BW) 0.506 0.495 0.502 0.512 50.38±1.29 0.366 0.105
WHCY (kg 100 kg–1 BW) 0.539 0.528 0.533 0.544 53.60±1.11 0.225 0.002
Cold carcass weight (kg) 213.9 218.3 212.7 215.9 215.20±1.15 0.998 0.993
CCY (kg 100 kg–1 BW)1 0.497 0.485 0.493 0.505 49.50±0.72 0.022 0.078
Chilling loss (kg) 2.2 2.1 1.5 1.9 1.93±0.87 0.287 0.571
Subcutaneous fat thickness (mm) 3.8 3.9 4.8 3.7 4.05±0.57 0.458 0.811
Fat trimmings (kg) 14.2 15.2 13.5 13.6 14.13±26.64 0.117 0.300
Fat trimmings (kg 100 kg–1 BW) 6.06 6.41 5.90 5.91 6.07±0.72 0.499 0.602
LDA (cm2) 62.97 62.80 63.95 61.73 62.86±5.73 0.808 0.965
LDA (kg 100 kg–1 CC) 29.47 28.80 30.03 29.23 29.38±2.83 0.887 0.941
Primary cuts
Pistol cut (kg) 51.7 52.7 50.2 50.8 51.35±5.77 0.624 0.883
Pistol cut (kg 100 kg–1 CC)2 48.3 48.3 47.3 47.2 47.78±0.51 0.001 0.910
Forequarter (kg) 41.2 41.8 41.3 42.1 41.60±5.55 0.827 0.970
Forequarter (kg 100 kg–1 CC) 38.5 38.2 38.8 38.8 38.58±0.98 0.406 0.693
Short ribs (kg) 14.1 14.7 14.8 15.1 14.68±2.03 0.417 0.720
Short ribs (kg 100 kg–1 CC) 13.1 13.4 13.9 13.9 13.58±0.99 0.137 0.732
Carcass composition
Muscle (kg 100 kg–1 CC) 63.15 60.56 62.35 61.03 61.77±3.31 0.459 0.688
Muscle (kg) 134.55 132.06 133.10 131.60 132.83±16.26 0.795 0.961
Fat (kg 100 kg–1 CC) 25.55 26.00 23.03 25.24 24.96±3.74 0.573 0.730
Fat (kg) 54.69 56.89 48.53 54.55 53.67±5.06 0.352 0.651
Bone (kg 100 kg–1 CC) 14.03 14.46 15.26 14.66 14.60±1.68 0.064 0.060
Bone (kg) 28.05 31.54 32.41 31.69 30.92±5.07 0.217 0.471
HCY - hot carcass yield; DM - dry matter; BW - body weight; WHCY - whole hot carcass yield; CCY - cold carcass yield; LDA - longissimus dorsi area; CC - cold carcass; L - linear; Q - quadratic; SE - standard error.
1 Ŷ = 48.98 + 0.0004x (R² = 0.21). 2 Ŷ = 48.43 – 0.0054x (R² = 0.49).
Table 4 - Quantitative carcass characteristics of dairy crossbred steers fed diets containing crude glycerin
Item Crude glycerin (g kg–1 DM) Mean±SE P-valueKW
0 80 160 240
Conformation1 10.33 9.83 9.17 9.67 9.75±6.74 0.3968
Color2 3.55 3.23 3.33 3.68 3.45±7.31 0.6805
Texture3 3.80 3.70 3.52 3.65 3.67±7.34 0.8500
Marbling score4 6.00 8.33 7.33 4.33 6.50±6.67 0.1789
DM - dry matter; SE - standard error. KW - Kruskal-Wallis test.
1 Conformation: 1-3 points = inferior; 4-6 points = poor; 7-9 points = regular; 10-12 points = good; 13-15 points = very good; 16-18 = superior. 2 Color: 1 = dark; 2 = dark red; 3 = slightly dark red; 4 = red; 5 = bright red.
3 Texture: 1 = very coarse; 2 = coarse; 3 = slightly coarse; 4 = fine; 5 = very fine.
4 Marbling: 1 to 3 = traces; 4 to 6 = slight; 7 to 9 = small; 10 to 12 = medium; 13 to 15 = moderate; 16 to 18 = abundant.
this study have been reported. Wang et al. (2009) found increased digestibility of DM, NDF, and CP in diets containing glycerin (990 g kg–1 glycerol) in Simmental steers. Benedeti et al. (2016), observed quadratic effect on digestibility of DM, NDF, and TDN with the inclusion (0, 50, 100, and 150 g kg–1 DM basis) of crude glycerin (828 g kg–1 DM glycerol) in the diet of finishing beef cattle. Including 0, 50, and 100 g kg–1 crude glycerin did not affect the apparent digestibility of DM in diets for dairy cows based on cotton husk or corn silage, but the digestibility of the neutral detergent fiber decreased linearly (Shin et al., 2012). These results suggest that including crude glycerin in the diet may depress the ruminal digestibility of the fiber through negative effect on the growth and activity of cellulolytic bacteria (Roger et al., 1992; Abughazaleh et al., 2008; Abo El-Nor et al., 2010). This result was not observed in the present study, due probably to the low fiber concentrations in high-concentrate diets as well as the chemical composition and amount of crude glycerin used.
The animal performance results of the present study were possibly due to the maintenance of DM intake. Thus, the lack of effect observed on DM intake, performance, and feed conversion suggests that diets containing up to 240 g kg–1 crude glycerin may promote the same efficiency of diet utilization than corn diet. Mach et al. (2009) and Bortoñ et al. (2013) reported the same observation when including up to 120 g kg–1 crude glycerin in the diet of finishing steers and Ramos and Kerley (2012) when including up to 200 g kg–1 crude glycerin in diets with high concentrate for beef calves. Similarly, Leão et al. (2012) did not observe any effect on daily gains and feed conversion of steers fed diets containing up to 240 g kg–1 crude glycerin.
The lack of effect of crude glycerin inclusion in the diet of cattle on HCW, WHCW, CCW, and HCY are consistent with prior literature. This result is justified given that there was no effect of crude glycerin inclusion level on DM intake and performance. Mach et al. (2009), who included up to 120 g kg–1 crude glycerin in the finishing diet of Holstein bulls, did not observe effect on HCW. The
Item Crude glycerin (g kg–1 DM) Mean±SE P-value
0 80 160 240 L Q
Rump cap 1.28 1.31 1.38 1.28 1.31±0.15 0.824 0.969
Tail of rump 1.06 1.18 1.07 1.08 1.10±0.15 0.851 0.976
Rump uk trim 3.00 3.27 3.16 3.10 3.13±0.36 0.747 0.944
Topside 7.73 7.91 7.03 7.33 7.5±0.85 0.196 0.439
Silverside 4.29 4.38 3.96 4.19 4.21±0.54 0.456 0.757
Shank 3.74 3.61 3.69 3.65 3.67±0.31 0.737 0.940
Tenderloin 1.75 1.85 1.77 1.66 1.76±0.19 0.336 0.631
Striploin 7.09 7.40 7.25 7.11 7.21±0.81 0.951 0.991
Knuckle 4.40 4.49 4.31 4.42 4.41±0.44 0.874 0.981
Eye of round 2.00 2.08 1.93 2.06 2.02±0.21 0.964 0.992
Cuberoll 0.88 0.91 0.83 0.88 0.88±0.13 0.718 0.932
Thin flank 0.72 0.64 0.57 0.66 0.65±0.33 0.269 0.139
Meat trimmings 1.28 1.28 1.26 1.21 1.26±0.11 0.263 0.539
Fat trimmings 2.06 2.18 2.04 2.05 2.08±0.05 0.770 0.953
Bone 10.02 10.20 9.98 10.12 10.08±1.01 0.972 0.993
DM - dry matter; L - linear; Q - quadratic; SE - standard error.
Table 6 - Commercial cuts (kg) of the pistol of dairy crossbred steers fed diets containing crude glycerin
Item Crude glycerin (g kg–1 DM) Mean±SE P-value
0 80 160 240 CG S CG × S
Glucose (mg dL–1) 95.27 93.75 95.53 91.80 94.09±12.08 0.695 0.001 0.923
Triglycerides (mg dL–1) 36.42 35.96 37.42 36.00 36.45±3.86 0.532 0.032 0.058
Cholesterol (mg dL–1) 126.91 126.10 135.72 128.42 129.29±55.96 0.931 0.002 0.939
HDL (mg dL–1) 69.04 68.47 69.72 69.68 69.23±4.25 0.706 0.001 0.613
Total protein (g dL–1) 6.35 6.16 6.25 6.15 6.23±0.26 0.033 0.001 0.470
Albumin (g dL–1) 3.80 3.81 3.86 3.83 3.83±0.12 0.432 0.625 0.395
ALT (UI L–1) 18.17 17.54 18.21 18.63 18.14±1.78 0.217 0.979 0.906
AST (UI L–1) 63.21 61.75 59.29 63.50 61.94±9.16 0.372 0.121 0.248
Creatine (mg dL–1) 0.97 0.92 0.98 0.93 0.95±0.15 0.474 0.008 0.052
Urea (mg dL–1) 34.36 32.31 35.46 32.20 33.58±6.94 0.289 0.309 0.139
DM - dry matter; CG - crude glycerin; S - sampling (1st, 22nd, 45th, and 64th days); SE - standard error; HDL - high-density cholesterol; ALT - aminotransferase aspartate; AST - aminotransferase alanine.
same was reported by Bortoñ et al. (2013), who supplied finishing bulls with diets with 93 g kg–1 crude glycerin over a long period (266 days) and found no change in carcass characteristics.
The chilling loss was similar among crude glycerin inclusion levels in the diet. As no variation was observed in SFT, the lack of effect on these variables is justified. Nevertheless, the carcasses presented good SFT within the recommended limit of 3 to 6 mm and required by the packing plants (Costa et. al., 2002). Thus, considering the SFT and percentage of fat of the carcasses (25 kg 100 kg–1 of cold carcass) (Table 5), it can be inferred that diets with high concentrate containing up to 240 g kg–1 crude glycerin to dairy crossbred steers may promote the same finishing for slaughter as the corn diet. Similar results were obtained by Mach et al. (2009) for the SFT values (3.65, 3.86, 4.10, and 3.73 mm) on the carcasses of Friesian steers fed diets containing 0, 40, 80, and 120 g kg–1 crude glycerin, respectively. The results of this study for physical composition of the carcass were similar to those observed in previous experiments that assessed the inclusion of crude glycerin in diet of cattle and did not observe difference in tissue deposition in the carcass (Leão, 2011; Bartoñ et al., 2013; Van Cleef et al., 2014).
The lack of effect of crude glycerin inclusion levels in diet on LDA is probably related to similar performance and slaughter weight of the animals. This result indicates that high-concentrate diets of dairy crossbred steers containing up to 240 g kg–1 crude glycerin may support efficiency of muscle development of the carcasses similar to corn diet. In addition, no significant difference was observed for the degree of muscle development of the carcasses measured by subjective evaluation of the conformation, which obtained a mean of 9.7 points (regular classification) on a scale from one to 15 (Müller, 1987).Carcasses with higher conformation are associated with greater muscle development and greater meat yield at deboning (Santos et al., 2008). The low conformation score is attributed to the genetic group of the animals used in this study, dairy crossbred steers. In agreement with our results, no differences were reported in the LDA (39.5 cm²) and carcass conformation of steers fed diets containing up to 120 g kg–1 crude glycerin in the study conducted by Mach et al. (2009). However, Parsons et al. (2009) fed crossbred heifers diets containing 0, 20, 40, 80, 120, and 160 g kg–1 crude glycerin and observed linear reduction in LDA, a factor related to the decrease in food intake when greater quantities of crude glycerin were added.
Regarding the linear reduction in pistol cut (kg 100 kg–1 cold carcass), as no significant differences were observed in
commercial cuts (Table 5), there is no physiological reason for reducing the weight of this primary cut with crude glycerin inclusion levels in diet. Other carcass primary cuts were not changed, as observed by Van Cleef et al. (2014) in the carcass of Nellore bulls fed diets containing up to 300 g kg–1 of crude glycerin.
The meat color, texture, and degree of marbling were not affected by the inclusion levels of crude glycerin in the diet. The color score average was 3.45 points, classified as slightly dark red and red, a value lower than that reported by Vaz and Restle (2000) of 4.37 points for castrated animals. This variable is important because consumers generally appreciate meats with a lighter red color and tend to reject the darker meats that are associated with older animals (Müller, 1987). The meat texture was classified as slightly coarse. Degree of marbling was classified between slight and small (Müller, 1987). Parsons et al. (2009) observed linear reduction in the marbling score as crude glycerin was increased (0, 20, 40, 80, 120, and 160 g kg–1 DM) in the diet of crossbred heifers. However, these authors expected a greater degree of marbling due to the probable increase in propionate production, the main precursor of glucose in the liver and primary precursor of intramuscular fat that, according to Bartoñ et al. (2013), allows a slightly greater value of intramuscular fat in ruminants fed diets containing 93 g kg–1 crude glycerin.
The lack of effect ofcrude glycerin inclusion levels in diet on the concentration of serum glucose is likely due to the supply methods used and adaptation of the animals to crude glycerin. In this study, crude glycerin was added as part of the concentrated, less efficient method than crude glycerin mixed in feed at the time of supply to increase serum glucose concentrations (Linke et al., 2005; Wang et al., 2009). Likewise, previous studies have demonstrated no significant effects of crude glycerin on concentration of serum glucose when crude glycerin was added to the concentrate prior to supply (Mach et al., 2009; Bartoñ et al., 2013). In addition, during the growing, the animals of this study were kept in grazing supplemented with concentrate equivalent to 750 g 100 kg–1 of the body weight with the same levels of inclusion of crude glycerin used during the feedlot, characterizing a long time to adapt to crude glycerin. This could also explain the stable concentration of serum glucose in diets with crude glycerin inclusion.
2004). According to Gunn et al. (2011), finishing cattle are insensitive to insulin, which may explain the higher values of concentrations of serum glucose at the end of the experiment. The results of this study agree with Hersom et al. (2004), in which the concentration of serum glucose of the steers increased during feedlot finishing.
In all treatments, concentrations of cholesterol increased across days of sampling in feedlot but the values remained within the normal interval for cattle (115-139 mg dL–1) (Pogliani and Birgel Junior, 2007). The increase in concentration of serum total cholesterol may be related to the fact that the animals were fed a high concentrate diet that could potentiate increase energy availability for lipogenesis (Kozloski, 2009). The same considerations can be applied to the concentration of serum triglyceride, which was not influenced by including crude glycerin in the diet. It increased across days of sampling in feedlot, but within the normal variation indicated by Pogliani and Birgel Junior (2007) of 31.32±15.82 mg dL–1, demonstrating that including crude glycerin does not damage the energetic metabolism of the animals. Concentration of serum HDL oscillated within the variation reported by Osorio et al. (2012) of 81.22±30.06 mg L–1 for young males.
The albumin presented normal concentration of 3.8 g dL–1 (Fagliari et al., 1998). Similarly, the activity of the enzymes aminotranferase aspartate and aminotransferase alanine also presented normal concentration, without any effect of including crude glycerin or the collection period. These results, together with albumin values, suggest that there were no lesions or damage to the liver or the protein metabolism during the period assessed.
The concentration of serum creatinine varied across sampling days and the values oscillated below the normal range, 1.57±0.29 mg dL–1, for Holstein males (Fagliari et al., 1998). The concentration in serum does not depend on the nutrition (Klinkon and Ježek, 2012); thus, it can be inferred that crude glycerin did not damage the kidney function in the assessed period and that there was no toxic effect of methanol (0.01 g kg–1 crude glycerin composition) with the inclusion of up to 240 g kg–1. The finding that the kidney functioning was not damaged was further sustained by the concentration of serum urea levels within the reference range reported by Fagliari et al. (1998).
Conclusions
Crude glycerin can be added to high-concentrate diet up to 240 g kg–1 without altering the animal performance, apparent digestibility of nutrients, the main carcass
characteristics, and blood parameters of finishing crossbred dairy steers.
Acknowledgments
The authors would like to thank the GRANOL S.A., BOIFORTE and Conselho Nacional de Desenvolvimento Científico e Tecnológico (CNPq) for their financial support.
References
Abo El-Nor, S.; Abughazaleh, A. A.; Potu, R. B.; Hastings, D. and Khattab, M. S. A. 2010. Effects of differing levels of glycerol on rumen fermentation and bacteria. Animal Feed Science Technology 162:99-105. doi:10.1016/j.anifeedsci.2010.09.012.
Abughazaleh, A. A.; Abo El-Nor, S. and Babu, R. 2008. The effect of replacing corn with glycerol on rumen fermentation and fiber digestibility. Journal Animal Science 86:E-Suppl. 2/Journal Dairy Science 91:E-Suppl. 1 (Abstract 216).
AOAC - Association of Official Analytical Chemists. 2005. Official methods of analysis of AOAC International. Horwitz, W., ed. AOAC International, Gaithersburg, MD; Washington, DC, USA. Avila-Stagno, J.; Chaves, A. V.; He, M. L.; Harstad, O. M.;
Beauchemin, K. A.; McGinn, S. M. and McAllister, T. A. 2012. Effects of increasing concentrations of glycerol in concentrate diets on nutrient digestibility, methane emissions, growth, fatty acid profiles, and carcass traits of lambs. Journal of Animal Science 91:829-837.
Bartoň, L.; Bureš, D.; Homolka, P.; Jančík, F. and Marounek, M. 2013. Effects of long-term feeding of crude glycerin on performance, carcass traits, meat quality, and blood and rumen metabolites of finishing bulls. Livestock Science 155:53-59.
Benedeti, P. D. B.; Paulino, P. V. R.; Marcondes, M. I.; Maciel, I. F. S.; Silva, M. C. and Faciola, A. P. 2016. Partial replacement of ground corn with glycerol in beef cattle diets: intake, digestibility, performance, and carcass characteristics. PLoS One 11:e0148224.
Boyd, J.; Bernard, J. K. and West, J. W. 2013. Effects of feeding different amounts of supplemental glycerol on ruminal environment and digestibility of lactating dairy cows. Journal of Dairy Science 96:470-476.
Cochran, R. C.; Adans, D. C.; Wallace, J. D. and Galyean M. L. 1986. Predicting digestibility of different diets with internal markers: evaluation of four potential markers. Journal of Animal Science 63:1476-1483.
Chung, Y. H.; Rico, D. E.; Martinez, C. M.; Cassidy, T. W.; Noirot, V.; Ames, A. and Varga, G. A. 2007. Effects of feeding dry glycerin to early postpartum Holstein dairy cows on lactational performance and metabolic profiles. Journal of Dairy Science 90:5682-5691. Elam, N. A.; Eng., K. S.; Bechtel, B.; Harris, J. M. and Crocker,
R. 2008. Glycerol from biodiesel production: Considerations for feedlot diets. In: Proceedings of the Southwest Nutrition Conference, n. 21. Tempe, AZ.
Fagliari, J. J.; Santana, A. E.; Lucas, F. A.; Campos Filho, E. and Curi, P. R. 1998. Constituintes sangüíneos de bovinos recém-nascidos das raças Nelore (Bos indicus) e Holandesa (Bos taurus) e de bubalinos (Bubalus bubalis) da raça Murrah. Arquivo Brasileiro de Medicina Veterinária e Zoototecna 50:253-262.
and crude glycerin on performance, carcass characteristics, and metabolic parameters of early weaned beef calves. Professional Animal Scientist 27:283-294.
Hall, M. B. 2000. Calculation of non-structural carbohydrate content of feeds that contain non-protein nitrogen. Bulletin, 339. University of Florida, Gainesville. p.A-25.
Hankins, O. G. and Howe, P. E. 1946. Estimation of the composition of beef carcasses and cuts. Technical Bulletin No. 926. USDA, Washington, D.C.
Hersom, M. J.; Wettemann, R. P.; Krehbiel, C. R.; Horn, G. W. and Keisler, D. H. 2004. Effect of live weight gain of steers during winter grazing: III. Blood metabolites and hormones during feedlot finishing. Journal of Animal Science 82:2059-2068.
Kass, M.; Ariko, T.; Kaart, T.; Rihma, E.; Ots, M.; Arney, D. and Kärt, O. 2012. Effect of replacement of barley meal with crude glycerol on lactation performance of primiparous dairy cows fed a grass silage-based diet. Livestock Science 150:240-247. Kozloski, G. V. 2009. Bioquímica dos ruminantes. 2.ed. Ed. da UFMS,
Santa Maria.
Klinkon, M. and Ježek, J. 2012. Values of blood variables in calves. In: A Bird’s-Eye View of Veterinary Medicine. Tech. Available at: <http://www.intechopen.com/books/a-bird-s-eye-view-of-veterinary-medicine/values-of-bloodvariables-in-calves.> Accessed on: Nov. 5, 2013.
Leão, J. P. 2011. Glicerol: Desempenho e características de carcaça e da carne de vacas e novilhos. Thesis (M. Sc.). Universidade Federal do Tocantins, Araguaína, TO, Brazil.
Leão, J. P.; Neiva, J. N. M.; Restle, J.; Paulino, P. V. R.; Santana, A. E. M.; Miotto, F. R. C. and Missio, R. L. 2012. Consumo e desempenho de bovinos de aptidão leiteira em confinamento alimentados com glicerol. Ciência Animal Brasileira 13:421-428. Linke, P. L. 2005. Ruminal and plasma responses in dairy cows to
drenching or feeding glycerol. The Journal of Undergraduate Research 3:49-60.
Mach, N.; Bach, A. and Devant, M. 2009. Effects of crude glycerin supplementation on performance and meat quality of Holstein bulls fed high-concentrate diets. Journal of Animal Science 87:632-638.
Mondal, M. and Prakash, B. S. 2004. Changes on plasma non-esterified fatty acids, glucose and α-amino nitrogen and their relationship with body weight and plasma growth hormone in growing buffaloes (Bubalus bubalis). Journal of Animal Physiology and Animal Nutrition 88:223-228.
Missio, R. L.; Brondani, I. L.; Freitas, L. S.; Sachet, R. H.; Silva, J. H. S. and Restle, J. 2009. Desempenho e avaliação econômica da terminação de tourinhos em confinamento alimentados com diferentes níveis de concentrado na dieta. Revista Brasileira de Zootecnia 38:1309-1316.
Müller, L. 1987. Normas para avaliação de carcaças e concurso de carcaças de novilhos. 2.ed. UFSM, Imprensa Universitária, Santa Maria.
NRC - National Research Council. 1996. Nutrient requirements of beef cattle. 7th rev. ed. National Research Council, National Academy of Sciences, Washington, DC.
Osorio, J. H.; Vinazco, J. and Pérez, J. E. 2012. Comparación de perfil lipídico por sexo y edad en bovinos. Biosalud 11:25-33.
Parsons, G. L.; Shelor, M. K. and Drouillard, J. S. 2009. Performance and carcass traits of finishing heifers fed crude glycerin. Journal Animal Science 87:653-657.
Pogliani, F. C. and Birgel Junior, E. 2007. Valores de referência do lipidograma de bovinos da raça holandesa, criados no Estado de São Paulo. Brazilian Journal of Veterinary Research and Animal Science 44:373-383.
Plá, J. A. 2002. Perspectivas do biodiesel no Brasil. Indicadores Econômicos FEE 30:179-190.
Ramos, M. H. and Kerley, M. S. 2012. Effect of dietary crude glycerol level on ruminal fermentation in continuous culture and growth performance of beef calves. Journal of Animal Science 90:892-899.
Roger, V.; Fonty, G.; Andre, C. and Gouet, P. 1992. Effects of glycerol on the growth, adhesion, and cellulolytic activity of rumen cellulolytic bacteria and anaerobic fungi. Current Microbiology 25:197-201.
Santos, A. P.; Brondani, I. L.; Restle, J.; Meneses, L. F. G.; Oliveira, L. and Silveira, S. R. L. 2008. Características quantitativas da carcaça de novilhos jovens e superjovens com peso de abate similares. Ciência Animal Brasileira 9:300-308.
Schröder, A. and Südekum, K. H. 1999. Glycerol as a by-product of biodiesel production in diets for ruminants. In: New horizons for an old crop. Proc. 10th Int. Rapeseed Congresso Canberra, Australia. Paper n. 241. Wratten, N. and Salisbury, P. A., eds. The Regional Institute Ltd., Gosford, New South Wales, Australia.
Shaffer, L.; Roussel, J. D. and Koonce, K. L. 1981. Effects of age, temperature-season, and breed on blood characteristics of dairy cattle. Journal of Dairy Science 64:62-70.
Shin, J. H.; Wang, D.; Kim, S. C.; Adesogan, A. T. and Staples, C. R. 2012. Effects of feeding crude glycerin on performance and ruminal kinetics of lactating Holstein cows fed corn silage or cottonseed hull-based, low-fiber diets. Journal of Dairy Science 95:4006-4016.
Sniffen, C. J.; O’Connor, J. D.; Van Soest, P. J.; Fox, D. G. and Russell, J. B. 1992. A net carbohydrate and protein system for evaluating cattle diets: II – Carbohydrate and protein availability. Journal of Animal Science 70:35621-3577.
Van Cleef, E. H. C. B.; Ezequiel, J. M. B.; D’Aurea, A. P.; Fávaro, V. R. and Sancanari, J. B. D. 2014. Crude glycerin in diets for feedlot Nellore cattle. Revista Brasileira de Zootecnia 43:86-91.
Van Soest, P. J.; Robertson, J. B. and Lewis, B. A. 1991. Methods for dietary fiber, neutral detergent fiber, and non-starch polysaccharides in relation to animal nutrition. Journal of Dairy Science 74:3583-3597.
Vaz, F. N. and Restle, J. 2000. Aspectos qualitativos da carcaça e da carne de machos Hereford, inteiros ou castrados, abatidos aos quatorze meses. Revista Brasileira de Zootecnia 29:1894-1901. Wang, C.; Liu, Q.; Huo, W.; Yang, W.; Dong, K.; Huang, Y. and