ISSN: 1809-4430 (on-line)
_________________________
1 UNIOESTE/Cascavel –PR, Brasil. 2 UTFPR/Medianeira –PR, Brasil. 3 UFPR/Curitiba–PR, Brasil.
4 CEO Biogás motores estacionários LTDA, Toledo –PR, Brasil.
*Corresponding author. E-mail: [email protected]. Received in: 3-16-2015
GAS EMISSION AND EFFICIENCY OF AN ENGINE-GENERATOR SET RUNNING ON BIOGAS
Doi:http://dx.doi.org/10.1590/1809-4430-Eng.Agric.v36n4p 613-621/2016
SAMUEL N. M. DE SOUZA1, ANDERSON M. LENZ2*, IVAN WERNCKE1,
CARLOS E. C. NOGUEIRA1, JHONATAS ANTONELLI3, JULIANO DE SOUZA4
ABSTRACT: In Brazil there is a wide availability of residues, which have been used in the
production of biogas and biofertilizers. The engine-generator by biogas is grid connected, and produce electricity for self-consumption and the surplus is inserted into the grid. The aim of the present study was to evaluate energetic efficiency and exhaust gas emission of two cases: two engine-generators sets of 100 kVA running on biogas, produced from residues of a poultry slaughterhouse unit (PSU) and swine fattening unit (SFU). Load variation in the engine-generator
set was evaluated in the SMCP (system of protection and synchronism). There was an increase in
the emission of nitrogen oxide, sulfur dioxide and exhaust gas temperature, in both cases. The elevation in the load of the engine-generator increased its global efficiency (mechanical plus electric), with levels between 6.12% with load of 10 kW and 20.91% with 70 kW. The average
specific consumption of biogas in the load of 70 kW was 0.76 m3 kWh-1 in the swine fattening unit
and 0.80 m3 kWh-1 in the slaughterhouse unit with load of 70 kW. The last results show an
engine-generator on biogas of 100 kVA (load of 70 kW), spent an average of 1.4 m3 of biogas to produce
1.0 kWh of electricity.
KEY WORDS: biofuel, energy efficiency, organic waste, gas emission.
INTRODUCTION
Even though the Brazilian energy supply is dependent from non-renewable energy sources, such as oil, natural gas and mineral charcoal, renewable sources as biomass, hydraulics, firewood, vegetal charcoal, lixivium and other sources, are responsible for 39.4% of the internal energy supply (MME, 2015). Biomass is an abundant renewable source of energy that may be derived from all organic matters produced by human and natural activities, including industrial residues, as well as urban, forest, agricultural and animal solid residues (IVES et al., 2013; KOHL et al., 2014; KYLILI; FOKAIDES, 2014; WYMYSLOWSKI et al., 2010).
In Brazil, the PROINFA (Program of Incentive to Alternative Sources of Energy) aims to stimulate the production of decentralized electric energy by independent and self-producers. The
extension of thermoelectric generation with biomass is one of the PROINFA’s goals. In that sense,
it came up an opportunity for systems of electric energy generation that use biogas as primary energy source to be implemented in rural properties and agro industries, for self-consumption and grid connection (SOUZA et al., 2013).
effluent that can be used as biofertilizer in crops, where allows the cycling of nutrients, such as nitrogen, phosphorus and potassium (NUNES et al., 2011; MIAO et al., 2013; CHERUBINI et al., 2015).
The main gas component in biogas is methane (CH4), which presents global warming
potential around 21 times stronger than carbon dioxide (CO2). Electricity generation with
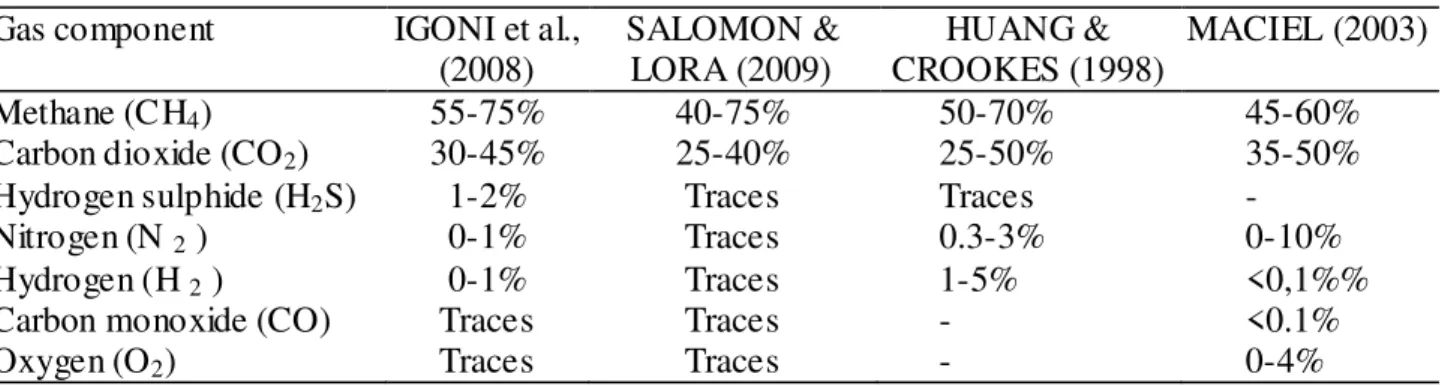
engine-generator, using biogas as fuel, has been one of the best forms of mitigating the emission of methane and promoting the reduction of the greenhouse effect (WHITING & AZAPAGIC, 2014; YASAR et al., 2014), and has been widely identified as an efficient mechanism to generate electrical power based on renewable energy sources. The biogas consists of a mix of gases at different concentrations, as shown in Table 1. The type of feedstock influences in the concentration and quantity of gases generated (JÚNIOR et al., 2010).
TABLE 1. Components and percentage of gases on biogas.
Gas component IGONI et al.,
(2008) SALOMON & LORA (2009) CROOKES (1998) HUANG & MACIEL (2003)
Methane (CH4) 55-75% 40-75% 50-70% 45-60%
Carbon dioxide (CO2) 30-45% 25-40% 25-50% 35-50%
Hydrogen sulphide (H2S) 1-2% Traces Traces -
Nitrogen (N 2 ) 0-1% Traces 0.3-3% 0-10%
Hydrogen (H 2 ) 0-1% Traces 1-5% <0,1%%
Carbon monoxide (CO) Traces Traces - <0.1%
Oxygen (O2) Traces Traces - 0-4%
The exploitation of biogas may occur as direct burning for thermal energy production or in electricity generating engines. In that sense, hydrogen sulfide must be removed from the biogas to avoid the corrosion of the energy generation system. Its purification might be obtained by processes of dry oxidation, adsorption, biotreatment and chemical absorption. Carbon dioxide is an inert gas in biogas, and as high its concentration as small the lower heating value (LHV) of biogas (SUN et al., 2015).
In the processes of biogas burning, pollutant gases are generated, such as nitrogen oxide, mainly when the mixture air-fuel has little oxygen or when high temperature peaks occur during the process of burning. Nitrogen oxide reacts with the oxygen in the air and results in nitrogen dioxide; such reaction is initiated by the sunlight (SHALAJ et al., 2015). INATOMI & UDAETA (2007) report that this gas is one of the responsible for the greenhouse effect, and also that it may be carried by the wind to distances up to one 1000 km away from the transmitter, causing acid rains in places
that are distant from the source.
The present study aimed to evaluate the efficiency of electric energy generation and gas emission in two engine-generator sets of 100 kVA, running on biogas produced by the anaerobic digestion of biomass from swine effluents (case 1) and poultry slaughterhouses (case 2), with electric load variation in the engine-generator.
MATERIAL AND METHODS
The study was performed at a Swine Fattening Unit (SFU) and at a Poultry Slaughterhouse
Unit (PSU), both located in the west region of the State of Paraná – Brazil. The SFU is located in
São Miguel do Iguaçú, Paraná, Brazil, and presents an average of 5,000 confined animals and the
manure is treated in two biodigesters model plug flow of 925 m3 and 231 m3, which produce
biofertilizers and biogas. The PSU (Poultry Slaughterhouse Unit) is located in Matelândia, Paraná, Brazil, and presents an operational capacity of 280,000 poultry/day and the residual biomass is
processed by means of one plug flow biodigester of 28,000 m3, producing biogas and liquid effluent
The SFU and PSU units have an engine-generator each one, of 100 kVA (see Figure 1), producing self-electricity connected in grid, using biogas as fuel. The biogas produced in the biodigesters of each unit flows by pipe to feed the two engine-generators. Both units are composed by a gas engine Otto cycle MWM, 6 cylinders, cubic capacity 7.2 liters, running at 1800 RPM of angular velocity. The relation biogas/air mixture is electronically controlled by a sensor of oxygen produced in the gas emission that allows a better efficiency of the engine. The engine is linked with an electric generator model Gramaco/G2R 200 MB, 4 poles, with nominal rotation of 1800 RPM, with power of 100 kVA, frequency of 60 Hz, tension 220 V with three-phases and current of 270 A.
In this study were obtained parameters of performance and emission pollutant for both cases: Case 1, with the engine-generator operating in the SFU unit; Case 2, the engine-generator operating in the PSU unit.
The performance parameters evaluated were the specific consumption (SC) of biogas (m3) per
electricity (kWh) produced, rate m3 kWh-1, and the global efficiency (mechanical plus electrical) of
the biogas engine-generators for both cases (case 1 and case2). The engine must be prepared according to the fuel, compression rate, air-fuel relation and ignition point. Such variables influence
the total yield, effective power and specific consumption (SC). The SC (m3 kWh-1) of the
engine-generator can be obtained with [eq. (1)]:
(1) where,
Ch - consumption per hour of biogas by the engine, m³ h-1;
Ne - effective electric load in the engine-generator, kW.
Figure 1 shows the general measuring scheme in both cases. In order to measure the consumption per hour of biogas by the engine, a thermal dispersion mass flow meter was used,
model Thermatel TA2 Enhanced, with measurement band between 0.51 and 85 m³ h-1; by means of
the SMCP (system of protection and synchronism) of the engine-generators, the electric load was
varied and the Ch measured. In Case 1, SFU unit, the electric load was changed from 10 to 70 kW
(10, 20, 30, 40, 50, 60, and 70 kW). In Case 2, PSU (Poultry Slaughterhouse Unit), the electric load was varied from 10 to 80 kW (10, 20, 30, 40, 50, 60, 70 and 80 kW). The SC of the engine-generator was obtained for each load. The measurements were performed within the period from 19 to 25 of April 2011, with four daily replications.
The global efficiency (%) was obtained by [eq. (2)]:
(2) where,
LHV - biogas lower heating value, kWh m-3;
SC - specific consumption obtained by [eq. (1)], m³ kWh-1.
Biogas, for being a mix of several gases, but mainly methane and carbon dioxide, has its heating value determined by the percentage of methane present. The lower heating value (LHVMethane) of 1 m3 of methane is 9.95 kWh m-3 (SOUZA et al, 2013). Then the LHV of the biogas
(kWh m-3) can be obtained by [eq. (3)]:
(3) where,
Percentage Methane - percentage of methane in biogas, % / 100; LHVMethane - lower heating value of methane, kWh m-3.
The percentage of methane was obtained with the Drager X-am 7000 gas analyzer, with simultaneous and continuous detection of up to five gases, and infra-red sensors for detecting carbon dioxide and hydrocarbons.
The pollutants measured in the exhaust gases, were nitrogen oxide (NO) and sulphur dioxide
(SO2), the concentration of them were obtained by means of a portable analyzer (Bacharach PCA
3), see Figure 1. The measurements were performed for different electric loads, as was done for
performance.
A part of the hydrogen sulfide (H2S) in biogas was removed using swarf filters installed in the
inlet of the engine, which reacts with the iron forming iron sulfide. The concentration of H2S in
biogas will influence in the concentration of sulfur dioxide (SO2) released by the engine.
RESULTS AND DISCUSSION
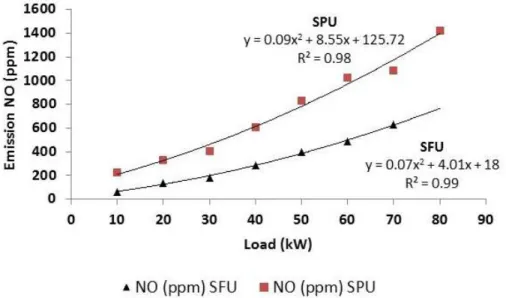
Figure 2 shows the concentration (ppm) of nitrogen oxide (NO) released in the exhaust gases from the engine-generators in different electric loads for both units: the slaughterhouse unit (SPU) and the SFU. Nitrogen oxide emission measured was 1023 ppm by the engine of slaughterhouse and 487 ppm in SFU engine, with 70 kW of load. Even though the emission was higher in the slaughterhouse, both sets elevated the emission of NO with load increase, which is related to the elevation of the average output temperature of the exhaust gases in the engine-generator sets (Figure 3), because it is formed in temperature peaks during the explosion in the natural cycle of internal combustion engines. The temperature the exhaust gases was measured with the probe temperature
of the portable analyzer (Bacharach PCA 3) of emission.
The increasing load causes increases in the average temperature and its peaks, favoring its formation. LEE et al. (2010) when assessing generation efficiency and emissions of both nitrogen oxide and dioxide in an engine-generator set running on gasoline and operating with biogas at 60% methane, verified that the temperature increase leads to an elevation of nitrogen oxide emissions, and that by elevating the recirculation of exhaust gases, there is a decrease in the emissions of nitrogen oxide and dioxide as well as in mechanical energy generation.
HUANG & CROOKES (1998) carried out tests to improve generation efficiency and reduce emissions of nitrogen oxide and dioxide, by using ideal ignition intervals based on maximum generation efficiency with different recirculation rates of exhaust gases. The results showed that
FIGURE 2. Nitrogen oxide (NO) emission in relation to load variation on the engine-generator sets at SPU and at SFU.
FIGURE 3. Variation of nitrogen oxide emissions with output temperature increase in the exhaust gases on the engine-generator sets at SPU and at SFU.
The figure 4 shows the emission of sulfur dioxide (SO2), which is directly related to the
quantity of hydrogen sulfide (H2S) in the biogas used in the engine-generator. The emission of the
engine at SFU was 1029 ppm, while the PSU engine indicated 265 ppm, with the same load, 70 kW. Such large difference is related to the amount of hydrogen sulfide in the biogas, given that one wa y of reducing sulfur dioxide emissions is by decreasing the concentration of hydrogen sulfide in the biogas used in the engine-generators.
During measurements of hydrogen sulfide (H2S) concentrations performed at the SFU, it was
possible to verify that the average concentration was 3258 ppm before the filter with crushed iron and 2712 ppm after the filtering process, what results in a reduction of 16.75% in the concentration
of H2S. At the SPU, the initial average concentration of H2S was 1406 ppm before the biogas went
through the filtering process and 483 after being filtered, presenting a reduction of 65% in the
concentration of H2S. The filters of the SPU and SFU have the same volume, but the amount (mass)
of iron in the filter of the SFU was smaller, reducing its efficiency of remotion. In addition, the high concentration of hydrogen sulfide can damage the engine; the main problem could be the corrosion
of internal components. According to WALSH et al. (1988) the higher concentration of H2S will
increase the emission of SO2, and the maximum concentration of hydrogen sulfide in biogas that
FIGURE 4. Emission of sulfur dioxide (SO2) in relation to the load variation of the
engine-generator set at both the SFU and the SPU biodigesters.
The average percentage of methane measured in biogas was 60% in the SFU and 70% in the SPU biodigester. Thus, applying equation 3, the lower heating value (LHV) of each biogas is 5.97
kWh m-3 at the SFU, and 6.97 kWh m-3 at the SPU. Under a load of 70 kW, the set at the SFU
consumed 0.76 m3 kWh-1 (specific consumption of biogas, SC) and the one at the slaughterhouse
consumed 0.80 m3 kWh-1 (see Figure 5), obtained by [eq. (1)]. Electric load variation led to a
reduction in specific consumption of biogas in both cases (SC).
FIGURE 5. Specific consumption (m3 kWh-1) in relation to load variation on the engine-generator
sets at the SPU and SFU biodigesters.
FIGURE 6. Electric energy generation efficiency with load variation at the SPU a nd SFU biodigesters.
CHANDRA et al, (2011), when assessing the specific consumption of biogas in internal combustion engines obtained similar results by using load variation and combustion angle variation. With load elevation there was a significant increase in engine performance. JEONG et al. (2009) found efficiency up to 26% in tests with internal combustion engines.
CONCLUSIONS
The emission of NO depends on the average output temperature of the exhaust gases, and increased with the load of the engine in both cases (SFU and SPU). Emission of sulfur dioxide
depends on biogas quality. In the SFU, where the concentration of H2S in biogas is higher the
emission of SO2 reached 1029 ppm at load of 70 kW, while the SPU engine indicated 265 ppm.
The importance of the study has been identifying the performance the generator engine during
the biogas consumption. At full load, 70 kW, the engine generator of SFU unit consumed 0.76 m3
kWh-1 (specific consumption of biogas, SC) and the one at SPU unit consumed 0.80 m3 kWh-1. With
those results it is possible to conclude that the medium consumption of biogas by an engine
generator can achieve 0.8 m3 of biogas to produce 1.0 kWh of electricity, or 1.25 kWh produced for
1.0 m3 of biogas consumed.
ACKNOWLEDGEMENTS
The authors would like to thank National Council of Scientific and Technological Development (CNPq), Brazil, for the financial support (P.307122/2012-9).
REFERENCES
CHANDRA, R.; VIJAY. V. K.; SUBBARAO, P. M. V.; KHURA, T. K. Performance evaluation of
a constant speed IC engine on CNG, methane enriched biogas and biogas. Applied Energy,
Amsterdam, v. 88, n. 11, p. 3969-3977, 2011.
CHERUBINI, E.; MARCELO, G.; AUGUSTO, R.; ALVARENGA, F.; FRANCO, D. Life cycle
assessment of swine production in Brazil : a comparison of four manure management systems. Journal of Cleaner Production, Oxford, v. 87, n. 15, p. 68–77, 2015.
HUANG, J.; CROOKES, R. J. Assessment of simulated biogas as a fuel for the spark ignition
engine. Fuel, London, v. 77, n. 15, p. 1793–1801, 1998.
IGONI, A. H.; AYOTAMUNO, M. J.; EZE, C.L.; OGAJI, S.O.T.; PROBERT, S.D. Designs of
anaerobic digesters for producing biogas from municipal solid waste. Applied Energy, Amsterdam,
INATOMI, T. A. H; UDAETA, M. E. M. Análise dos impactos ambientais na produção de energia dentro do plane jamento integrado de recursos. São Paulo: USP, 2007.
IVES, M. C.; SCANDOL, J. P.; GREENVILLE, J. A bio-economic management strategy
evaluation for a multi-species , multi-fleet fishery facing a world of uncertainty. Ecological
Modelling, New York, v. 256, n. 2013, p. 69–84, 2013.
JEONG, C; KIM, T.; LEE, K.; SONG, S; CHUN, K. M. Generating efficiency and emissions of a
spark-ignition gas engine generator fuelled with biogas–hydrogen blends. International Journal of
Hydrogen Energy, Oxford, v. 34, n. 23, p. 9620-9627. 2009.
JÚNIOR, M. A. P. O.; ORRICO, A. C. A.; JÚNIOR, J. D. L. Influência da relação volumoso: concentrado e do tempo de retenção hidráulica sob a biodigestão anaeróbia de dejetos de bovinos.
Engenharia Agrícola, Jaboticabal, v. 30, n. 3, p. 386–394, 2010.
KOHL, T.; LAUKKANEN, T. P.; MIKA, P. J. Integration of biomass fast pyrolysis and precedent
feedstock steam drying with a municipal combined heat and power plant. Biomass and Bioenergy,
Oxford, v. 71, n. 28, p. 413-430, 2014.
KYLILI, A.; FOKAIDES, P. A. Competitive auction mechanisms for the promotion renewable
energy technologies : The case of the 50 MW photovoltaics projects in Cyprus. Rene wable and
Sustainable Energy Reviews, Amsterdam, v. 42, n. 17, p. 226–233, 2014.
Lee, K.; Kim, T.; Cha, H.; Song, S.; Chun, K. M. Generating efficiency and NOx emissions of a gas
engine generator fueled with a biogas–hydrogen blend and using an exhaust gas recirculation
system. International Journal of Hydrogen Energy, Oxford, v. 35, n. 11, p. 5723-5730, 2010.
LI, Y.; LIU, B.; ZHANG, X.; GAO, M.; WANG, J. Effects of Cu exposure on enzyme activities
and selection for microbial tolerances during swine-manure composting. Journal of Hazardous
Materials, Amsterdam, v. 283, n. 25, p. 512–518, 2014.
MACIEL, F. J. Estudo da ge ração, percolação e emissão de gases no aterro de resíduos sólidos
da Muribeca /PE. Recife: UFPE, 2003.
MME – Ministério das Minas e Energia. Balanço Energético Nacional. Brasília: Editado por EPE,
2015.
MARCOS, A.; AL-KASSIR, A.; LÓPEZ, F.; CUADROS, F.; BRITO, P. Environmental treatment of slaughterhouse wastes in a continuously stirred anaerobic reactor: Effect of flow rate variation on
biogas production. Fuel Processing Technology, New York, v. 103, n. 21, p. 178–182, 2012.
MIAO, H.; WANG, S.; ZHAO, M. Codigestion of Taihu blue algae with swine manure for biogas
production. Energy Conversion and Manage ment, Oxford, v. 77, n. 7, p. 643–649, 2013.
NUNES, M. A. G.; KUNZ, A.; STEINMETZ, R. L. R.; PANIZ, J. N. G. Aplicação de efluente tratado de suinocultura para diluição de dejeto suíno e remoção de nitrogênio por desnitrificação.
Engenharia Agrícola, Jaboticabal, v. 31, n. 2, p. 388–398, 2011.
SALOMON, K. R.; LORA, E. E. S. Estimation the potential for electricity generation for different
sources of biogas in Brazil. Biomass and Bioenergy, Oxford, v. 33, n. 9, p. 1101-1107, 2009.
SHALAJ, V. V.; MIKHAILOV, A. G.; SLOBODINA, E. N.; TEREBILOV, S. V. Iss ues on
nitrogen oxides concentration reduction in the combustion products of natural gas. Procedia
Engineering, Amsterdam, v. 113, p.287-291, 2015.
SOUZA, S. N. M.; WERNCKE I.; MARQUES, C. A.; BARICCATTI, R. A.; SANTOS R. F.
Electric energy micro-production in a rural property using biogas as primary source. Renewable
and Sustainable Energy Reviews, Amsterdam, v. 28, n. 11, p. 385–391, 2013.
SUN, Q.; LI, H.; YAN, J.; LIU, L.; YU, Z.; YU, X. Selection of appropriate biogas upgrading
technology – a review of biogas cleaning, upgrading and utilization. Renewable and Sustainable
WALSH, J. L.; ROSS, C. C.; SMITH, M. S.; HARPER, S. R.; WILKINS, W. A. Handbook on biogas utilization: biogas utilization technologies. Georgia: GTRI, US Department of Energy,
1988. 156p.
WHITING, A.; AZAPAGIC, A. Life cycle environmental impacts of generating electricity and heat
from biogas produced by anaerobic digestion. Energy, Wylie, v. 70, n. 12, p. 181–193, 2014.
WYMYSLOWSKI, M.; LUCZAK, M.; ZAWADZKA, A.; IMBIEROWICZ, M.; CHACUK, A.
Methane fermentation of poultryslaughterhouse waste. Polish Journal of Chemical Technology,
Szczecin, v.12, n. 3, p. 15–18, 2010.
YASAR, A.; ALI, A.; TABINDA, A. B.; TAHIR, A. Waste to energy analysis of shakarganj sugar
mills ; biogas production from the spent wash for electricity generation. Rene wable and