1. Federal University of Minas Gerais. School of Physical Education Physiotherapy and Occu-pational Therapy, Center for Sports Excellence. Belo Horizonte, MG. Brazil
2. Federal University of Viçosa, Viçosa, MG. Brazil.
Received: 5 April 2011 Accepted: 22 May 2011
CC $ =
1
1
1
1
1
2
1
1
Daniel Barbosa Coelho Lucas Ávila Mortimer Luciano Antonacci Condessa Rodrigo Figueiredo Morandi Bernardo Moreira Oliveira João Carlos Bouzas Marins Danusa Dias Soares Emerson Silami Garcia
Intensity of real competitive soccer matches
and differences among player positions
Intensidade de jogos de futebol de uma competição real e
entre jogadores de diferentes posições táticas
Abstract – Most investigations on soccer match intensity have evaluated friendly, simulated
or a small number of games on a recreational basis or including a small number of players. There are no studies investigating real competitive situations including a considerable number of athletes and games or differences among player positions using heart rate as an intensity parameter. The aim of this study was to determine Brazilian soccer game inten-sity (GI) during oficial competitive matches and to compare GI among different player positions. Heart rate (HR) was measured in 26 under-17 (U-17) and 18 under-20 (U-20) soccer players (age 16.38 ± 0.5 and 18.24 ± 0.66 years, respectively) during 14 and 15 oficial games, respectively. Individual maximal heart rate (HRmax) and anaerobic threshold (AT) HR were evaluated in ield tests. GI deined as %HRmax was monitored considering ive intensity zones ranging from 1 = < 70% HRmax to 5 = 95-100% HRmax. Mean GI and AT intensity were 84.4 ± 5.1 and 86.3 ± 4.0% HRmax for the U-17 category and 84.1 ± 4.1 and 87.0 ± 5.1% HRmax for the U-20 category, respectively. Wingbacks (WB) spent more time in zone 5 than forwards (FW) (p<0.05). Midielders (MF) spent more time in zone 3 than all other players and in zone 4 than defenders and FW (p<0.05). Mean GI and AT intensity were similar. WB performed more maximum effort than FW. MF did not participate as much in maximum effort as did WB and FW.
Key words: Anaerobic threshold; Heart rate; Soccer.
Resumo – A maioria das investigações sobre a intensidade de jogos de futebol foi realizadas em jogos amistosos, simulados ou com um pequeno número de jogos avaliados em caráter recreacional ou com uma pequena amostra. Não se observou nenhuma avaliação de freqüência cardíaca (FC) em jogos oiciais com um número considerável de jogadores e de diferentes posições. O objetivo do presente estudo foi determinar a intensidade de jogos (IJ) do futebol brasileiro durante uma competição oicial e compará-la entre jogadores de diferentes posições táticas. A FC foi medida em 26 jogadores entre 16 e 17 anos (Sub-17) e 18 jogadores entre 18 e 20 anos (sub-20) (idades 16,38 ± 0,5 e 18,24 ± 0,66 anos, respectivamente). A frequência máxima individual (FCmax) e a FC de limiar anaeróbico (LAN) foram avaliadas em testes de campo. A IJ como %FCmax foi monitorada como cinco zonas de intensidade sendo desde a zona 1 = <70%FCmax; a 5 = 95-100%FCmax. A IJ media e a intensidade de LAN foram 84,4 ± 5,1; 86,3 ± 4,0%HRmax and 84,1 ± 4,1; 87,0 ± 5,1%HRmax para o sub-17 e sub-20, respectivamente. Os laterais permaneceram mais tempo na zona 5 em comparação aos jogadores atacantes (p<0,05). Os jogadores de meio campo permaneceram mais tempo na zona 3 em comparação aos outros jogadores e na zona 4 em comparação aos zagueiros e atacantes (p<0,05). A IJ média e a intensidade de LAN são similares. Os laterais apresentam mais esforços máximos do que os atacantes e os jogadores de meio campo não participam de tantos esforços máximos como os zagueiros, laterais e atacantes.
Soccer game intensity among player positions Coelho et al.
INTRODUCTION
In contrast to other activities in which the intensity remains constant or varies little, the intensity of oficial soccer games is dificult to quantify since the soccer rules prohibit the use of masks and wrist monitors. Some attempts have been made using different parameters, such as mean distance cov-ered1,2, mean velocity3, maximum oxygen uptake
(VO2max) estimated by the measurement of rectal temperature4, mean blood lactate concentrations3,
and mean energy expenditure5. However, due to
the dificulties in assessing some of these variables, heart rate (HR) is recommended as a practical variable to monitor a player’s effort intensity dur-ing a soccer game since a linear relationship exists between HR and VO2max6,7. Since HR is inluenced
by factors such as age, itness, gender, environmen-tal conditions and hydration status, Karvonen and Vuorimaa8 recommend that HR should be
determined as the percentage of maximum heart rate (HRmax) when used as a parameter of exercise intensity, representing an adequate parameter for intensity control in professional and non-profes-sional soccer players9,10.
Although relevant studies investigating soccer match intensity are available, most of them have evaluated friendly games11, simulated games12 and
college games13, analyzed a small number of
play-ers13 and recreational players14,15, or used
question-able methods such as laboratory simulations1. To
our knowledge, there are no studies investigating a large number of players during various oficial games. Moreover, most studies have not evaluated differences among player positions using HR as an intensity parameter in real competitive situations.
Many details can be gained by the fractional analysis of soccer game data and by the evaluation players according to different positions. The impor-tance of the present study lies in the fact that a large number of players were monitored during various oficial competitive games. Monitoring speciic players, a small number of players or only few games does not provide representative data since the physi-ological demands of players during a game may vary according to opponent, environmental conditions or the tactical preferences of the coach. Therefore, the analysis of more than one game during an of-icial competition should provide representative physiological data that can be used by coaches to better understand the demands of a soccer game.
The determination of maximum effort inten-sity and anaerobic threshold (AT) inteninten-sity permits
to evaluate the intensity of physical activities as the percentage of this maximum. A precise determi-nation of maximum effort permits accurate game intensity monitoring. Therefore, the objective of the present study was to investigate the intensity of real competitive soccer matches, and to deter-mine whether signiicant differences exist among different player positions using HR as a parameter of effort intensity.
METHODOLOGICAL PROCEDURES
Subjects
The study was approved by the Research Ethics Committee of the Federal University of Minas Gerais (ETIC-476/2004). All procedures, possible risks and beneits of the study were explained to the volunteers before they signed the informed consent form to participate in the experiment.
HR was monitored and analyzed in 26 players of the under-17 (U-17) category (ive defenders, six wingbacks, eight midielders, and seven forwards) in 14 oficial games (10,035 min), and in 18 players of the under-20 (U-20) category (four defenders, four wingbacks, six midielders, and four forwards) in 15 oficial games (10,035 min). The inclusion criteria for this study were that all soccer players should belong to a Brazilian First Division soccer team, participate in regular training sessions (two training sessions per day, about 90 min each, 6 days per week), and compete in oficial events organized by the Brazil-ian Soccer Federation (CBF), in this case the state championship. All subjects had an average of 5.5 ± 1.0 years of experience with systematized soccer training. Each player participated in 2 to 8 games over the study. The competitive season comprised the pe-riod from April to November. The number of athletes available in each category, except for the goalkeeper, was used for the calculation of sample size.
26.45 – 36.80 ºC) considering WBGT 25.03 ± 1.33 ºC (range: 21.54 – 29.12 ºC) and relative humidity 63.3 ± 15.9% (range: 45.30 – 82.20%). All matches occurred in the morning between 9 and 11 am. The diet of the players was controlled and monitored by a professional of the soccer team. Before and during the interval of each game the players were encouraged by the researchers to stay hydrated.
Determination of maximum heart rate
HRmax was determined as the highest HR seen in one of the three following situations: 1) run-ning a distance of 1000 m at the maximum speed possible16; 2) running a distance of 2400 m at the
maximum speed possible for indirect measurement of VO2max17; 3) highest HR achieved during all
games. HR monitored during the games is reported as the percentage of HRmax (%HRmax).
Intensity zones
The intensity of the games is reported as the per-centage of game time spent in ive different inten-sity zones as previously described by Helgerud et al.18: zone 1, < 70% HR
max; zone 2, 70-85% HRmax;
zone 3, 85-90% HRmax; zone 4, 90-95% HRmax; zone 5, 95-100% HRmax.
HR at the onset of blood lactate accumulation (OBLA) intensity
HR corresponding to the OBLA intensity19 was
obtained in a ield test. The test consisted of 2 to 5 runs of 1000 m at a mean initial speed of 10 km/h20. Sixty to 90 seconds after each run, a
digital blood sample was collected (25 µL) for the measurement of blood lactate concentration using the AccusportÒ blood lactate analyzer. The test
was interrupted if the blood lactate concentration reached or exceeded 4 mM. Otherwise, the volun-teer performed another run at a speed that was 1 km/h faster. HR was monitored along the runs and the average was considered for HR determination. The HR corresponding to OBLA was determined by linear interpolation using the Microsoft ExcelÒ
software. The test was performed in the morning (8-10 am) at the following average temperatures: dry temperature 22.1 ± 1.7 ºC, humid temperature 19.0 ± 1.5 ºC, and globe temperature 29.83 ± 1.26 ºC considering WBGT 22.33 ± 1.83 ºC and relative humidity 71.36 ± 8.9%.
Maximum oxygen uptake
The VO2max of the athletes was estimated in a ield
m in the fastest possible time . The determination of VO2max is a routine procedure in the club and this test is regularly used by trainers, with the players thus being familiar with the test.
Each physical test was applied at the beginning of the pre-season training period and was repeated at the end of it. The values shown in Table 1 refer to the second test. Each test was performed at least twice on each occasion. The reliability of these tests in the two situations was high, with the in-traclass coeficient (ICC) ranging from 0.92 to 0.99.
Statistical analysis
One-way analysis of variance (ANOVA) followed by the Tukey post-hoc test was applied to compare the following situations: a) comparison of intensity between the different phases analyzed in the study (warm-up vs. interval and irst vs. second half); b) comparison between intensity zones; c) comparison of effort intensity between different player posi-tions; d) intensity values corresponding to OBLA; e) time spent above OBLA. A power of the test, which refers to its ability to detect differences be-tween groups, of 80% was established and the level of signiicance was set at p<0.05. The Student t-test for independent samples was applied to compare intensity between categories. The ICC was used to determine the between-subject reliability of the physical tests. All results are reported as the mean ± standard deviation.
RESULTS
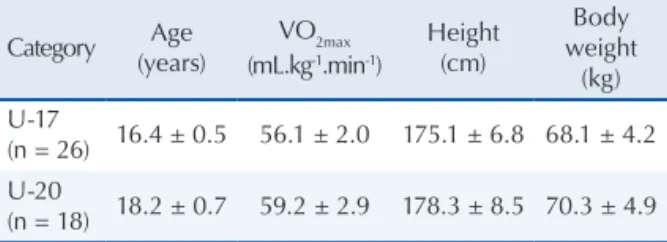
The characteristics of the subjects are shown in Table 1.
Table 1. Characteristics of the subjects. Values are presented as mean ± sd.
Category Age (years)
VO2max
(mL.kg-1.min-1)
Height (cm)
Body weight
(kg) U-17
(n = 26) 16.4 ± 0.5 56.1 ± 2.0 175.1 ± 6.8 68.1 ± 4.2 U-20
(n = 18) 18.2 ± 0.7 59.2 ± 2.9 178.3 ± 8.5 70.3 ± 4.9
U-17 = under-17; U-20 = under-17. Values are reported as the mean ± standard deviation. Maximum oxygen uptake (VO2max) was assessed using the protocol of Margaria et al.17.
Soccer game intensity among player positions Coelho et al.
difference between these two categories (p>0.05). Figure 1 shows the different intensity phases of the soccer game (warm-up, irst half, half-time, second half).
Figure 1. Intensity of the different phases of a soccer game expressed as the percentage of maximal heart rate (%HRmax.). *Different from the first half; #different from warm-up (p<0.01).
Intensity evaluated as the percentage of game time spent in different intensity zones
Since no differences were found between the U-17 and U-20 categories (p>0.05), the percentage of game time spent in different intensity zones was analyzed using all data.
Analysis of the different intensity zones showed that most soccer matches are performed in zone 2 (p<0.05). The percentage of time spent in zones 3 and 4 was higher than that spent in zones 1 and 5 (p<0.05) (Fig. 2).
Figure 2. Intensity of soccer games reported as the percentage of game time spent in different intensity zones. *Different from zones 1 = < 70% HRmax, 3 = 85-90% HRmax, 4 = 90-95% HRmax,
and 5 = 95-100% HRmax. #Different from zones 1 = < 70% HR max,
2 = 70-85% HRmax, and 5 = 95-100% HRmax.
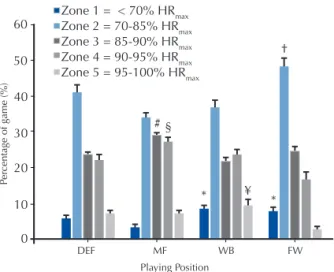
Forwards and wingbacks spent more time in zone 1 than midielders (p<0.05). Forwards also spent more time in zone 2 than midielders and wingbacks (p<0.05). Midielders presented the highest percentage of time in zone 3 (p<0.05) and spent more time in zone 4 than defenders and forwards (p<0.05). Interestingly, wingbacks spent more time in zone 5 than forwards (p<0.05) (Fig. 3).
Figure 3. Intensity of soccer games reported as the percentage of game time spent in different intensity zones according to player position. DEF, defenders; MF, midfielders; WB, wingba-cks; FW, forwards. Differences: * higher than MF; † higher than
MF and WB; # higherthan DEF, WB, and FW; § higherthan DEF
and FW; ¥ higher than FW (p<0.05).
First and second halves
The percentage of game time spent in zones 1 and 2 was higher in the second half (7.6 ± 0.7 and 43.9 ± 1.1%, respectively) when compared to the irst half of the game (4.50 ± 0.62 and 34.52 ± 2.36%, respectively) (p<0.05). On the other hand, the percentage of time spent in zones 4 and 5 was higher in the irst half (26.91 ± 0.93 and 9.10 ± 0.93%, respectively) than in the second half (19.38 ± 0.85 and 3.83 ± 0.72%, respectively) (p<0.05). No difference between the irst (24.96 ± 0.59%) and second half (25.15 ± 0.65%; p>0.05) was observed for zone 3 (Fig. 4).
Figure 4. Comparison of the percentage of game time spent in different intensity zones between the first and second halves. *Different from the same zone in the first half (p<0.05). Zone 1 = < 70% HRmax, zone 2 = 70-85% HRmax, zone 3 = 85-90%
HRmax, zone 4 = 90-95% HRmax, and zone 5 = 95-100% HRmax.
Time above OBLA intensity
52.1 ± 20.3% and 51.3 ± 19.8% for U-17 and U-20 players, respectively (p>0.05). No differences were observed between the two categories.
DISCUSSION
In the present study, mean soccer game inten-sity (≈84% HRmax) was similar to OBLA intensity (≈87% HRmax). This intensity can only be main-tained because of the intermittent pattern of soccer games, which is characterized by periods of recovery between high intensity efforts3. Wisloff
et al.21 argued that prolonged activity above the
lactate threshold in soccer is not possible because of the long duration of the game. Therefore, no differences were found between U-17 and U-20 categories. Indeed, this is in agreement with the present study in which soccer players remained only 51% of the game above the HR corresponding to the 4-mM threshold.
The soccer game intensities estimated from %HRmax in the present study did not differ mark-edly from those reported in other investigations11,22.
Mohr et al.11 reported an intensity of 85% HR max
during a friendly match of the 4th Danish Division.
O’Connor22 evaluated HR during two women’s and
men’s soccer games and also found an intensity of 85% HRmax. However, both studies evaluated friendly games and O’Connor22 did not mention
how HRmax was determined.
The soccer game intensity observed in the present study was slightly lower than that obtained by Tumilty et al.12, who evaluated 16 players of an
Australian U-20 team and found a mean intensity of 87% HRmax. However, the game studied by those authors was a simulation and HRmax was deter-mined in a laboratory situation. Reilly & Keane15
evaluated senior soccer players and found lower intensities than those observed in the present investigation. In that study, HRmax was obtained in a speciic ield test and the mean intensity was 80% HRmax during an oficial game. Although speciic maximum effort tests are suitable for the determination of HRmax23, a previous study from our
laboratory showed that HRmax is lower in speciic ield tests than during games24.
A reduction in game intensity occurs during the second half of a soccer game25. Factors
inluenc-ing fatigue may play a role in this reduction2. One
possible explanation would be the progressive utili-zation of glycogen during the game, which decreases performance in the second half3. In the present
in the second half (Fig. 1). A similar decline has been reported in other studies3,11,20, even in those
evaluating children 14 or simulated games12. This
re-duction of game intensity in the second half can be better observed when the percentage of game time spent in low-intensity zones (zones 1 and 2) and high-intensity zones (zones 4 and 5) are compared between the two halves (Fig. 4). This pattern of distribution has also been reported by Helgerud et al.18 and Orendurff et al.13. In the former study, the
reduction of game intensity in the second half was attenuated by speciic high-intensity aerobic train-ing. In the study of Orendurff et al.13, forwards of a
college soccer team presented a shorter duration of high-intensity efforts at the end of the second half than at the beginning of the same half.
Although soccer is a team sport, physical training should consider different player positions and different tactical tasks during a game. One of the main indings of the present study was that wingbacks spent more time in zone 5 than for-wards (p<0.05) (Fig. 3). This result demonstrates the importance of high-intensity training for these players. Tumilty26, analyzing the evolution
of soccer, describes the function of wingbacks to be highly offensive, with these players constantly participating in offensive actions on the sides of the ield along with forwards. In addition, these players must also participate in the defensive system, which sometimes implies actions such as sprinting back to cover their opponent. Therefore, since high intensities and short-duration efforts are necessary to win a soccer game, not only forwards but also wingbacks play a key role in these actions in winning a game. Furthermore, this result should be included in physical training programs using appropriate workloads to increase the performance of wingbacks at this intensity level.
Another important inding was that midield-ers spent a higher percentage of game time in zone 3 than all other players and more time in zone 4 than defenders and forwards (p<0.05). Orendurff et al.13 investigated differences between soccer
dur-Soccer game intensity among player positions Coelho et al.
ing a game29. These differences can be explained
by the fact that these players connect the defensive and offensive systems and play in a larger area of the ield2,3. Therefore, the aerobic workload of
midielders should be higher than that of other players to improve their recovery and hence their performance during a match.
Forwards and defenders spent a higher percent-age of game time in zone 2 (70-85% HRmax) than players from other positions. Since they spent a high percentage of time in this intensity zone, they remained less time in other intensity zones when compared to midielders and wingbacks. The similarity in the intensity distribution of forwards and defenders might be explained by the speciicity of their tasks during the game, with these players performing similar efforts in the same sector of the ield using a similar movement pattern as reported by Tumilty26. These players participate in crucial
moments of the game that are characterized by high-intensity and short-duration efforts2.
In one of the few studies that compared the percentage of game time spent in different intensity zones, Reilly & Keane15 evaluated senior players
during a competitive match. The players analyzed in the present study spent a higher percentage of game time in higher intensity zones than the subjects evaluated by these authors. This inding might be expected considering the lower aerobic itness and older age of the players in the study of Reilly & Keane15 compared to the present subjects.
Helgerud et al.18 evaluated Nordic junior soccer
players during two soccer games and monitored their HR, which was classiied into the same ive intensity zones as used in the present study. The Nordic players spent more time in zone 3 than the Brazilian players analyzed here. On the other hand, the present subjects spent a higher percentage of time in zones 2 and 4, suggesting differences in the game pattern between the two teams. However, Helgerud et al.18 determined HR
max in a laboratory
test and evaluated only two games performed on artiicial grass and in a closed environment.
Since the present study only investigated the U-17 and U-20 categories, the results may not be extrapolated to a different category. Moreover, since the study was conducted in a real competitive situ-ation dehydrsitu-ation could not be controlled. Finally, each player participated in a variable number of two to eight games over the study, mainly because of high-performance sport issues such as injuries or the tactical system adopted in the championship. Since soccer game intensity is inluenced by the opponent
as well as by the tactical preference of the coach, the range of games analyzed per player should be taken into account when interpreting the present indings.
CONCLUSIONS
In summary, soccer match intensity is similar to OBLA intensity, with no differences between U-17 and U-20 categories. Wingbacks spent a higher percentage of game time in the highest intensity zone than forwards in a real competitive situation. These data should be included in speciic train-ing programs addresstrain-ing the tactical positions of players. In the case of wingbacks, the objective is to increase performance at short-duration, high-intensity efforts since the outcome of a game is decided at these moments.
Midielders are the players who most spent time in zone 3. In addition, they spent a higher percentage of game time in zone 4 than defenders and forwards, suggesting higher aerobic require-ments of these players. This higher requirement of aerobic activities should be included in the physical training of midielders to improve their recovery and, consequently, their performance. Intensity distribution was similar in defenders and forwards, a inding that might be explained by the speciic-ity of their tasks in the game, with these players presenting similar efforts in the same sector of the ield using a similar movement pattern.
Acknowledgements
We thank CAPES, CNPq, FAPEMIG, and the Brazilian Ministry of Sports for inancial support.
REFERENCES
1. Bangsbo J, Lindquist F. Comparison of various exercise tests with endurance performance during soccer in professional players. Int J Sports Med 1992;13(2):125-32.
2. Rienzi E, Drust B, Reilly T, Carter JEL, Martin A. Investigation of anthropometric and work-rate proiles of elite South American international soccer players. J Sports Med Phys Fitness 2000;40(2):162-9.
3. Bangsbo J. The physiology of soccer, with special ref-erence to intense intermittent exercise. Acta Physiol Scan 1994;619(Suppl.):1-155.
4. Bangsbo J. Energy demands in competitive soccer. J Sports Sci 1994;12:S5-12.
5. Stolen T, Chamari K, Castagna C, Wisloff U. Physiol-ogy of soccer: an update. Sports Med 2005;35(6):501-36.
Sports Exerc 1995;27(9):1292-301.
8. Karvonen J, Vuorimaa T. Heart rate and exercise in-tensity during sports activities. Practical application. Sports Med 1988;5(5):303-12.
9. Impellizzeri F, Rampinini E, Marcora S. Physiological assessment of aerobic training in soccer. J Sports Sci 2005;23(6):583-92.
10. Achten J, Jeukendrup AE. Heart rate monitoring: appli-cations and limitations. Sports Med 2003;33(7):517-38.
11. Mohr M, Krustrup L, Nybo L, Nielsen JJ, Bangsbo J. Muscle temperature and sprint performance during soccer matches – beneicial effect of re-warm-up at half-time. Scand J Med Sci Sports 2004;14(3):156-62.
12. Tumilty D. The relationship between physiological characteristics of junior soccer players and performance in a game simulation. In: Science and Football II, London: E & FN Spon; 1993. p. 281-286.
13. Orendurff MS, Walker JD, Jovanovic M, Tulchin KL, Levy M, Hoffmann DK. Intensity and duration of in-termittent exercise and recovery during a soccer match. J Strength Cond Res 2010;24(10):2683-92.
14. Capranica L, Tessitore A, Guidetti L, Figura F. Heart rate and match analysis in pre-pubescent soccer players. J Sports Sci 2001;19(6):379-84.
15. Reilly T, Keane S. Estimation of physiological strain on Gaelic football players during match-play. In: Sci-ence and Football IV, London: E & FN Spon, 2002. p. 157-159.
16. Pini MC. Fisiologia do Esporte, 2nd ed, Rio de Janeiro: Guanabara Koogan; 1993.
17. Margaria R, Aghemo P, Pinera LF. A simple relation between performance in running and maximal aerobic power. J Appl Physiol 1975;38(2):351-2.
18. Helgerud J, Engen LC, Wisloff U, Hoff J. Aerobic en-durance training improves soccer performance. Med Sci Sports Exerc 2001;33(11):1925-31.
19. Sjodin B, Jacobs I. Onset of blood lactate accumulation and marathon running performance. Int J Sports Med 1981;2(1):23-26.
20. Smith M, Glarke G, Hale T, McMorris T. Blood lactate levels in college soccer players during match-play. In: Science and Football II, London: E & FN Spon, 1983. p. 129-134.
1998;30(3):462-7.
22. O’Connor DT. Motion analysis of elite touch players. In: Fourth World Congress of Science and Football, Sydney. London: E & FN Spon; 2002. p. 126-136.
23. Boudet G, Garet M, Bedu M, Albuisson E, Chamoux A. Median maximal heart rate for calibration in differ-ent conditions: laboratory, ield and competition. Int J Sports Med 2002;23(4):290-7.
24. Antonacci L, Mortimer LACF, Rodrigues V, Coelho DB, Soares DD, Silami-Garcia E. Competition, esti-mated, and test maximum heart rate. J Sports Med Phys Fitness 2007;47(4):418-21.
25. Mortimer LACF, Condessa L, Rodrigues V, Coelho DB, Soares DD, Silami-Garcia E. Comparison between the effort intensity of young soccer players in the irst and second halves of the soccer game. Rev Port Cien Desp 2006;6(2):154-9.
26. Tumilty D. Physiological characteristics of elite soccer players. Sports Med 1993a;16(2):80-96.
27. Shephard RJ. The energy needs of the soccer player. Clin J Sport Med 1992;2(1):62-70.
28. Casajús AJ. Seasonal variation in itness variables in professional soccer players. J Sports Med Phys Fitness 2001;41(4):463-9.
29. Caixinha PF, Sampaio J, Mil-Homens PV. Variação dos valores da distância percorrida e da velocidade de deslocamento em sessões de treino e em com-petições de futebolistas juniores. Rev Port Cien Desp 2004;4(1):7-16.
Endereço para correspondência
Daniel Barbosa Coelho
Federal University of Minas Gerais
School of Physical Education, Physiotherapy and Occupational Therapy
Physiology Exercise Laboratory
Av. Antônio Carlos, 6627, 31270-901 - Belo Horizonte, MG. Brazil