Evaluating Lightweight Dependable
Adaptation in 802.15.4 Wireless Sensor
Networks
Lu´ıs Marques, Ant´
onio Casimiro
DI–FCUL–TR–2012–04
DOI:10455/6873 (http://hdl.handle.net/10455/6873)
July 2012
Published at Docs.DI (http://docs.di.fc.ul.pt/), the repository of the Department of Informatics of the University of Lisbon, Faculty of Sciences.
Evaluating Lightweight Dependable Adaptation in
802.15.4 Wireless Sensor Networks
Lu´ıs Marques
[email protected]
FC/UL*
Ant´onio Casimiro
[email protected]
FC/UL
Abstract—To achieve dependable real-time operation in Wireless Sensor Networks (WSNs) we previously proposed a general technique based on non-parametric stochastic analysis. Such technique allows one to overcome the communication uncertainties that are intrinsic to wireless and dynamic envi-ronments, and to offer probabilistic real-time guarantees, by continually monitoring and adapting to environment condi-tions.
An underlying assumption of the proposed technique is that the system can recognize changes in the state of the environment quickly enough, compared to the rate at which those changes occur. In this paper we effectively evaluate the validity of such an assumption, in WSNs based on the 802.15.4 networking standard.
We present results from various simulation scenarios, as well as from a real network, and conclude that monitoring and adaptation can dependably provide probabilistic real-time guarantees in 802.15.4-based WSNs, in the presence of realistic network dynamics.
Keywords-Wireless Sensor Networks; dependability; adapta-tion; real-time; 802.15.4; non-parametric; lightweight; QoS;
I. INTRODUCTION
Achieving dependability is an important objective of every system architect, be it explicit or not. We all want systems to perform as specified, and Wireless Sensor Networks (WSNs) are not an exception. However, achieving dependability is usually not a trivial task. In particular, when it is not possible, or easy, to know the actual conditions under which a system will operate it becomes even harder to reason about dependability.
We believe that in environments with uncertain timeliness one key issue for achieving dependability is having the ability to accurately perceive the state of the operational environment, which must be done at runtime. For instance, a system may have several modes of operation which can be selected according to the perceived conditions, so that it will provide a service that is adequate to those conditions.
Given our objective of finding solutions for achieving dependable real-time operation in WSNs, in a previous work we addressed the problem of monitoring (and adapting to) network conditions, and introduced a technique based * This work was partially supported by the EU through the KARYON project (FP7-288195) and the FCT through the Multiannual Funding Program.
on non-parametric statistics [1]. A distinctive feature of this technique is that it is computationally lightweight, as required in WSNs, and applicable to environments with probabilistic behavior, as we observed using traces of wired and wireless IP-based networks.
While that previous work established the general validity of the technique, and its applicability to common (IP-based) networking scenarios, it did not establish its compatibility with the dynamics that can occur in WSNs.
In this paper we specifically address the dependability of runtime adaptation, based on our non-parametric monitoring technique, in WSNs. Particularly, in 802.15.4-based WSNs. The 802.15.4 standard specifies the physical and medium-access protocols most commonly used in WSNs, making networks based on this standard a prime target for evalua-tion.
What we want, ultimately, is to ensure we can provide some kind of real-time guarantees in WSNs, despite the uncertain timings introduced by the wireless network. This is to be done through a strategy of continually monitoring and adapting to varying network conditions, using the technique previously proposed. The technique allows one to character-ize the state of the network at a given time, and to derive probabilistic timing bounds for that state.
Using that technique, we can be certain that these bounds will hold with the expected probability, as long as network conditions do not change after the network is sampled. Any deviation in the results will necessarily be due to either the expected statistical margin of error or due to the (uncertain) network dynamics. In this paper we measure such deviations, under a variety of scenarios, when applying the proposed non-parametric technique to 802.15.4-based WSNs. That is, we effectively evaluate the impact of any network dynamics, by noting any differences between the theoretically expected results and those actually observed.
This evaluation is performed through simulations as well as testing with an actual network. The obtained results validate the dependability in real WSNs of the strategy of continually monitoring and adapting to varying network conditions. In particular, they show that the dynamics which occur in 802.15.4-based WSNs under the various tested scenarios are compatible with the proposed monitoring and adaptation process.
In summary, the contributions of this paper are:
• Characterizing the impact of network dynamics in 802.15.4 networks, under a variety of scenarios, to a probabilistic model of network timings;
• Establishing that probabilistic real-time operation can
be achieved in 802.15.4-based WSNs, despite network dynamics, by continually monitoring and adaptation to varying network conditions.
The paper is organized as follows. In the following section we better define the problem of achieving (probabilistic) real-time operation in WSNs, and give a quick overview of the applied statistical technique. Then, Section III presents the evaluation scenarios. In Section IV we unveil and discuss the test results. In Section V we present related work and Section VI concludes the paper.
II. PROBABILISTICREAL-TIMEOPERATION AND EVALUATIONMETHODOLOGY
WSNs are used to sense and collect the state of physical entities. Applications rely on the WSN to create an internal representation of the state of such entities, to be used in monitoring and control functions. Different applications have different requirements regarding how faithful such representation must be, compared with the true state of the sensed entity.
One of the fundamental factors that affect a reliable perception of the physical environment is the delay between sensing a physical entity and the use of that information by the application. This delay is particularly dependent on the one-way network latency, measured between the sensing node and the sink node, to which the state is propagated. Unfortunately, due to the open nature over which these networks operate, it is not possible to fully characterize (a priori) the bounds of this latency. As such, we rely instead on a runtime characterization of the network latencies.
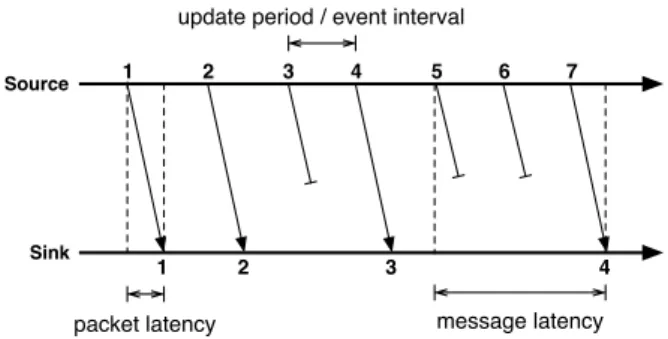
We consider that the WSN sends update/event messages at defined intervals, pertaining to the state of a monitored phys-ical entity, which the application uses to create or freshen a corresponding internal representation. According to the dynamics of the monitored physical entity and the acceptable margin of error, the application assumes a deadline until which it is supposed to receive the message. If no message is received until the deadline a timing failure (at the network level) or fault (at the application level) is considered to have occurred.
The aim of the adaptation process is to limit the occur-rence of timing failures. While, due to the open nature of the operating environment, it is not possible to guarantee that timing failures will never occur, their probability of occurrence can be managed. For instance, if the application can change its mode of operation so that it will tolerate a higher margin of error, then the deadline may be extended, increasing the time during which updates may be received and, therefore, possibly lowering the probability of timing
Source Sink 1 1 2 2 3 4 3 5 6 7 4 packet latency message latency
update period / event interval
Figure 1: Timing Variables (Example)
failures. Another possibility is to change the mode of oper-ation of the WSN itself. For instance, by sending duplicate updates through redundant network routes the probability of timely delivery of an update is likely to increase, since radio interferences and other perturbations are often geo-graphically circumscribed. These adaptations generally im-ply trade-offs; in these examples, lower Qualities of Service provided by the application (due to the increased margin of error) or increased energy and bandwidth consumption (due to the duplicate traffic). Therefore, it is up to the application to define the best trade-off, by indicating the target probability of timing failure.
We achieve probabilistic real-time operation if we depend-ably maintain an acceptable probability of timing failure. We refer to the expected probability (or observed frequency) of respecting deadlines as the coverage, since it denotes how well the application’s assumption of timely updates is being covered, and to our objective of achieving real-time operation as one of maintaining coverage stability.
We here evaluate if such coverage stability can be achieved in 802.15.4 networks, by continually monitoring and adapting to network conditions, or if, instead, net-work dynamics prevent the assessment of (and consequent adaptation to) the network timings. This is necessarily an open-ended question, since 1) how strict the probabilistic requirements are will vary from application to application, and 2) in an open environment we cannot assume any a priori limit to the dynamics which may occur. Nevertheless, we here present results for a variety of typical WSN scenarios, which we believe validate our approach.
Monitoring
We consider as the monitoring target the one-way la-tency that occurs between the beginning of sending the update/event message and its reception at the sink. One such interval is exemplified in Figure 1, identified as “message latency”. It differs from the baseline “packet latency” in the case when packets are lost. Newer updates are considered to supersede old ones, which are discarded if received out of order.
0 0.2 0.4 0.6 0.8 1 0 0.2 0.4 0.6 0.8 1 Obtained Coverage Requested Coverage Empirical coverage (n=30) Expected coverage (n=30) Perfect Adaptation
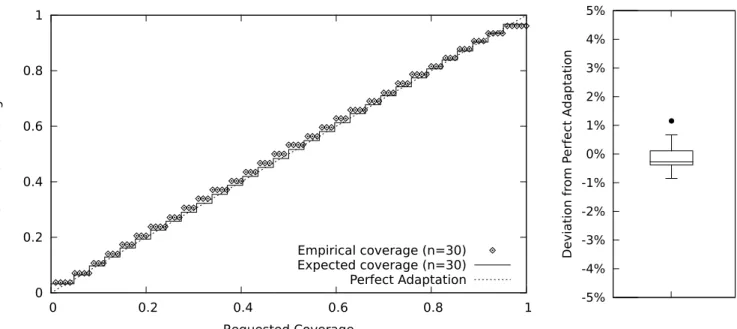
Figure 2: Example of Summarizing Coverage Deviations
The message latency can be measured, if a notion of global time is assumed (there are several clock synchro-nization algorithms optimized for WSNs [2][3]) and the messages are timestamped before being sent. Otherwise it may be estimated by other methods, for instance by periodically measuring round-trip times.
At the sink the latencies are computed (against the local synchronized clock) and collected, up to a given sample size n, with old sample values being discarded.
Adaptation
The adaptation can occur at the application level, at the network level, or a combination of both. In this paper we do not focus on how the adaptation is performed, but instead in evaluating its success. Therefore, we consider the simpler scenario where the adaptation is performed at the application level, by trading different deadlines for varying margins of error. The impact of the margin of error is necessarily application-specific, and falls outside of the scope of this paper.
Stochastic analysis
The non-parametric analysis upon which the adaptation is based is simple and efficient. A copy of the sample is ordered. The first value (the 1st order statistic) is the lowest
latency observed, and if it were used as a deadline we would expect a high number of timing failures, since most subsequent latencies would likely be higher. Conversely, the last value of the ordered sample (the nth order statistic) is the highest observed latency, and therefore most subsequent latencies would likely be lower. The previously proposed
non-parametric adaptation algorithm [1] chooses the latency value given by the order statistic which best matches the target coverage.
Evaluation
According to the laws of statistics, if the state of the WSN did not at all change between latency measurements nor before the deadlines expiring then the observed frequency of timing failures would tend toward the expected value (the mean), with negligible deviations when considering long-running applications. We here measure the observed deviations from the target coverage, to infer the impact of network dynamics.
To study the deviations between the requested and the achieved coverage for a single scenario we can create a graphic plotting several possible target coverages and the associated empirically obtained coverages. As an alternative, we can summarize the deviations in the form of a box plot graphic, which condenses the information and facilitates comparison of alternative scenarios. We used the box plot whiskers to represent, as is most common, values which lie within 1.5 times the interquartile range. Figure 2 exemplifies this process.
III. EVALUATIONSCENARIOS
In this paper we present results for a real 802.15.4 network as well as various scenarios which were simulated with ns-2, using the 802.15.4 wireless physical and MAC modules. These simulation scenarios are structured as three base scenarios (1, 2, 3), with variants (1–A, 1–B, etc). In both
0 1 2 3 4 5
Tstart Tend
Figure 3: Simulation Base Scenario 1 (1–A & 1–B)
the real network and in the simulations we use a non-beacon mode, with CSMA/CA, since we believe that not relying on a centralized beacon is more appropriate to the large-scale networks that are envisioned in the literature for the future [4][5]. We focus mainly on the end-to-end latency as the variable used for adaptation. Nodes send an acknowledgement (ACK) upon successful frame reception, as specified in the 802.15.4 standard. Periods of 600 seconds of activity were analyzed.
The use of a real network allows an evaluation of adap-tation effectiveness under truly realistic (but simple) condi-tions, while the simulations allow the evaluation of more complex scenarios. The real network and the simulation base scenarios 1 and 2 were designed to be (as much as possible) comparable. This is helpful, since by comparing real results with simulation results we can better understand how realistic and meaningful the simulation results really are.
The simulation base scenarios 1 and 2 and the real network scenario follow a similar structure: all nodes are arranged in a logical line, with nodes only communicating with their immediate neighbors. The first node produces the updates, the last node is the sink to which the updates must arrive, and the intermediate nodes forward these updates.
In the simulation base scenario 1 (see Figure 3), neither movement nor any kind of interferences are introduced, so the variations in end-to-end latency are expected to reflect factors which are intrinsic to 802.15.4, such as the CSMA/CA exponential back-off. The variants 1–A and 1–B have 6 nodes, to allow comparisons with the real network, while the variant 1–C tests the impact of varying the number of nodes. We also test different traffic patterns and different sample sizes. The traffic patterns chosen were Constant Bit Rate (CBR), to model updates at periodic intervals; and a Poisson / Exponential pattern, to model the detection of natural events, which do not occur at fixed periods. Short update intervals were used, since these better highlight the effects of intra-network interference.
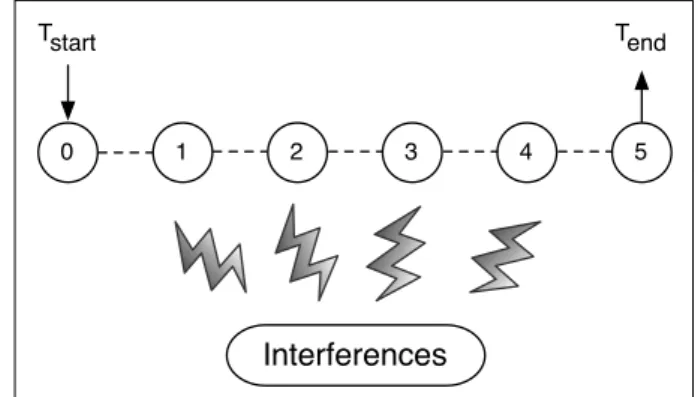
The simulation base scenario 2 (see Figure 4) introduces a source of interferences, which is intended to mimic the existence of inferences in real networks operating in open environments.
The real network (see Figure 5) was built using six RCB128RFA1 V6.3.1 evaluation modules from dresden elektronik. These boards contain an AVR ATmega128RFA1
0 1 2 3 4 5
Tstart Tend
Interferences
Figure 4: Simulation Base Scenario 2
0 5 4 3 2 1 Timer 20 m PC Tstart Tend
Figure 5: Real Network Scenario
chip, which integrates an ATmega1281 microcontroller with an AT86RF231 transceiver, compatible with 802.15.4 at 2.4 GHz. The nodes were configured to use the minimum transmission power, by setting the PX PWR3:0 bits of the PHY TX PWR register to one, resulting in a -16.5 dBm power output (0.0224 mW).
As much as possible, we tried the real network to be conceptually equivalent to a (logical) linear network. Two major factors decided the actual geographical distribution of the nodes, which is illustrated in Figure 5.
One factor was that, instead of using a clock synchroniza-tion algorithm, we measured the end-to-end latency through electronic signals, so we could not have the source and the destination nodes too far apart. Such setup allowed us to better isolate any variation in the latencies, and thus be sure our results reflected actual network dynamics. This was performed by having the source node (node 0) and the sink node (node 5) signal in microcontroller pins when the trans-mission started and when the update message was received. These signals were timed with real-time equipment, with 16 µs of precision, and forwarded to a PC for storage and analysis. The sink node also connected to the PC to share
0 Tstart Tend 8 14 29 25 33 23 1 22 11 39 5 34 15 46 32 49 44 13 26 48 18 21 4 45 31 19 3 37 42 43 36 17 7 1238 10 47 27 35162 30 28 9 40 20 24 41 6
Figure 6: Simulation Base Scenario 3 (Example)
the sequence number of the messages received, so that in cases of multiple consecutive lost messages no ambiguity would arise.
Another factor was the land relief. Although the terrain was fairly planar, we observed that nodes had to be placed at different distances among each other to achieve equivalent signal quality. We tried to obtain a node disposition which best increased signal quality among neighbor nodes and decreased interference among unconnected nodes, which differed significantly from the planned arrangement. We ob-served that nodes which should ideally not be connected nor interfere among each other had to be within distances where sometimes (but rarely) was still possible to communicate, in order to achieve good link quality between the connected nodes.
The real network scenario has similarities with both the simulation base scenarios 1 and 2. While we performed our evaluation in a geographical area and during a time of the day where low 2.4 GHz WLAN activity was present, there is always some amount of interferences. These include thermal noise, microwave ovens, WLANs and the non-neighbor network nodes. Therefore, we would expect results from the real network to be somewhere between those of simulation scenarios 1 and 2.
The simulation base scenario 3 departs from the other scenarios to implement a more complex network, as one would expect to find in a real WSN (see Figure 6). It is less artificial, and does not isolate as well the dynamics of the 802.15.4 physical and MAC layers, but allows studying the impact of network level events, such as node movement.
In the simulation scenario 3–A the nodes are randomly dispersed in a 50 × 50 meter area, except for the source and
Scenario # Nodes Update Interval Sample Size (n) Real Netw. 6 Constant(0.05 s) 20, 30, 60, 100 1–A 6 Constant(0.05 s) 20, 30, 60, 100 1–B 6 Exp.(λ−1= 0.05) 30 1–C 5–30 Constant(0.05 s) 30 2 6 Constant(0.05 s) 30, 100 3–A 50 Constant(0.05 s) 30 3–B 50 Exp.(λ−1= 0.05) 30, 100 3–C (M) 50 Exp.(λ−1= 0.05) 30 3–D (M+C) 50 Exp.(λ−1= 0.05) 30, 100 Key (M): movement of nodes (C): competing message flows
Table I: Overview of Evaluation Scenarios
sink nodes which are fixed in opposing edges. The traffic is routed through the intermediate nodes using Ad hoc On-Demand Distance Vector Routing (AODV). The variant 3–B changes the traffic pattern from constant to random with an exponential probability distribution, while the variant 3–C introduces movement of the nodes and 3–D further adds four competing traffic flows. Scenario 3–D is therefore the most complex, and is a good test to evaluate whether the adaptation is dependable, even in the presence of highly challenging dynamics.
These scenarios and the analyzed variants are summarized in Table I. Other variants (e.g. different update intervals or sample sizes) were explored, but only those which provided important insights on the limitations of adaptation effective-ness are here presented and discussed.
IV. RESULTS ANDDISCUSSION
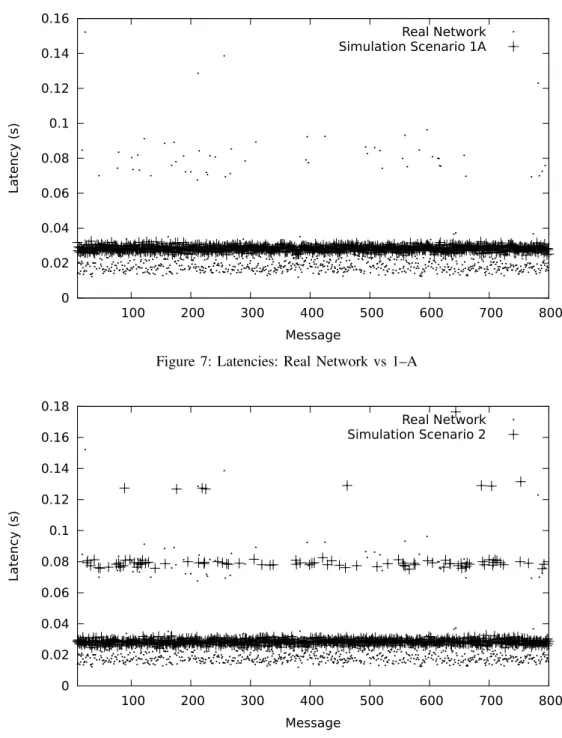
Figures 7 and 8 compare the end-to-end message latency of the simulations versus the empirical results of the real network, to establish the basic soundness of the simulation results. The latencies of the first 800 messages of each scenario are plotted.
As can be seen in Figure 7, even the basic simulation scenario 1–A exhibits a probabilistic behavior that mimics that of the real network. In both the simulation and the real network there is an approximately 10 ms wide strip where (most of) the latencies are distributed. This variance is due to mechanisms such as the 802.15.4 CSMA/CA during the contention access period (CAP) and the MAC-level trans-mission retries — up to 7 retries are allowed by the 802.15.4 specification; the default of 3 maximum retries was used in both the real network and the simulations. Because no channel interferences were introduced, almost no messages were lost during the whole simulation period, despite the high update data rate. As such, the simulation does not exhibit outlier latencies around 80 ms (1 lost update) and 130 ms (2 lost updates), like the real network does. Despite an agreement of the data regarding the probabilistic dispersion pattern, we see that the ns-2 simulator produces latencies that are in absolute terms higher than those of a real network.
0 0.02 0.04 0.06 0.08 0.1 0.12 0.14 0.16 100 200 300 400 500 600 700 800 Latency (s) Message Real Network Simulation Scenario 1A
Figure 7: Latencies: Real Network vs 1–A
0 0.02 0.04 0.06 0.08 0.1 0.12 0.14 0.16 0.18 100 200 300 400 500 600 700 800 Latency (s) Message Real Network Simulation Scenario 2
Figure 8: Latencies: Real Network vs 2
The simulation scenario 2 more closely matches the empirical results of the real network, as is visible in Figure 8. Due to the introduction of interferences, we can see a stochastic pattern of three different latency bands, caused by application-level “retries” (superseding updates), with a progressively lower occurrence of latencies in each band as the number of retries increases. We also observe that, despite the simulator producing latencies in the lower band that are higher in absolute value than those observed in a
real network, when packets are dropped and updates are superseded the latencies from simulator match with the empirical results, with values around 80 and 130 ms.
In general, these results establish a baseline of trust in the simulation data, as well as the existence of stochastic patterns in the network behavior, which is compatible with our goal of providing probabilistic real-time guarantees.
We can make a first assessment regarding the adaptation effectiveness in simulated linear networks by inspecting Figure 9. We can note that the coverage (i.e. the inverse of
-5% -4% -3% -2% -1% 0% 1% 2% 3% 1A (n=30) 2 (n=30) 1A (n=100) 2 (n=100) Deviation fr om P erfect A daptation
Figure 9: Scenario 1–A vs Scenario 2
the observed frequency of timing failures) never exceeded the target by more than 3%, nor ever underachieved it by more than 5%. In fact, in most cases it came within 2% or less of the target coverage. We also notice that despite scenario 2 introducing interferences which are not present in scenario 1–A, the adaptation effectiveness is not worse in scenario 2. On the contrary, the box plots for scenario 2 have lower amplitude than those for scenario 1–A, and are also less shifted off-center from the perfect adaptation.
Another preliminary conclusion that can be taken from Figure 9 is that larger sample sizes permit achieving more effective adaptations, since the box plots for the sample size 100 have a smaller amplitude than those for the sample size 30. While the relative decrease in amplitude was ap-proximately similar for scenario 1–A and 2, the increase in sample size in scenario 2 resulted in an average that was less deviated from the target. This is a consequence of the larger sample better capturing the existence of sporadic higher-valued latencies, resulting from the application-level retries — at the cost of a slight increase in memory consumption and processing time.
From these results we can tentatively conclude that in-creasing the complexity of scenarios (i.e., introducing factors of temporal uncertainty) does not in itself create an impedi-ment to obtaining satisfying adaptation performance. On the contrary, we observe that the results may even improve. The explanation for this outcome may be understood by analogy to the central limit theorem (CLT) from probability theory. In the CLT, as we add an increasing number of independent random variables (with finite mean and variance) the average starts to approximate a normal distribution, even if the variables were not normally distributed. Likewise, as we add various factors which affect the latency in unpredictable ways the result may start to be, overall, more predictable.
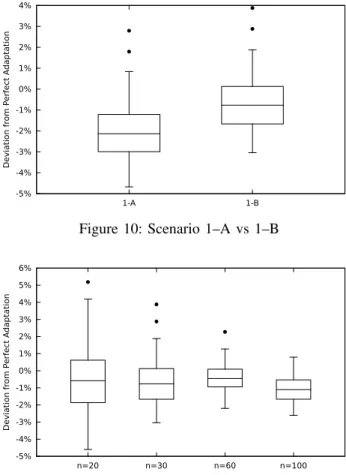
A similar effect can be seen in Figure 10, which compares the scenario 1–A (a constant update stream) with scenario 1– B (updates at exponentially distributed intervals). While the amplitude of the box plot for scenario 1–B only minimally
-5% -4% -3% -2% -1% 0% 1% 2% 3% 4% 1-A 1-B Deviation fr om P erfect A daptation
Figure 10: Scenario 1–A vs 1–B
-5% -4% -3% -2% -1% 0% 1% 2% 3% 4% 5% 6% n=20 n=30 n=60 n=100 Deviation fr om P erfect A daptation
Figure 11: Scenario 1–A — Adaptation Effectiveness at Different Sample Sizes (Simulated)
improves compared with the box plot for scenario 1–A, the average for the scenario 1–B is much closer to objective of 0% deviation from the target coverage.
Figure 11 more comprehensively explores the effect of increasing the sample size, showing the summarized results of scenario 1–A. We see that by gradually increasing the sample size we gradually decrease the deviation from perfect adaptation — until a point, where no further gain is ob-tained. This diminishing of returns is not unexpected, since the dynamics of the WSN will progressively endanger the freshness of the oldest sample values and their benefit for assessing the current state of the network.
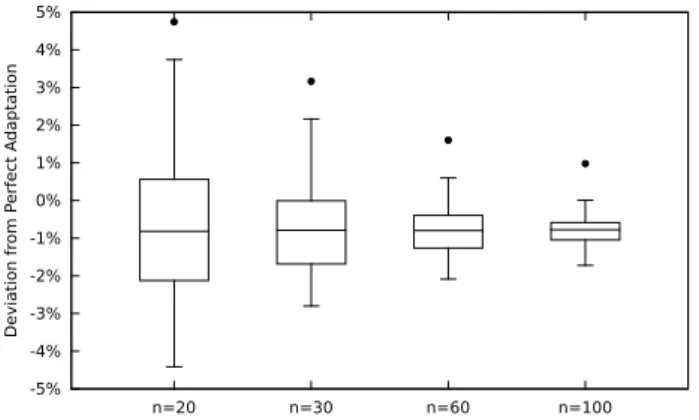
Figure 12 presents a similar analysis, but performed using the latencies of the real network. The most important conclusion that should be taken from Figure 12 is that the adaptation is highly effective under a real scenario. First, even for the smaller sample sizes of n = 20 and n = 30 we obtain good results, equivalent to those obtained under simulation, with scenario 1–A. Second, by increasing the sample size to higher values we are able to come very close to the target coverages; for n = 100 half of the different possible adaptations come within 1% of the target coverage. Third, there is less of an effect of diminishing
-5% -4% -3% -2% -1% 0% 1% 2% 3% 4% 5% n=20 n=30 n=60 n=100 Deviation fr om P erfect A daptation
Figure 12: Real Network — Adaptation Effectiveness at Different Sample Sizes
-5% -4% -3% -2% -1% 0% 1% 2% 3% 4% 5%
5 nodes 6 nodes 8 nodes 10 nodes 15 nodes 30 nodes
Deviation fr
om P
erfect A
daptation
Figure 13: Scenario 1–C — Effect of Number of Hops in Adaptation Effectiveness (Simulated)
returns, compared with simulation scenario 1–A. This is most likely due to the increased randomness of the real network, compared with the simulation.
Another important consideration when exploring the de-pendability of probabilistic real-time operation in WSNs is the existence of scale effects. To address this question, Figure 13 scrutinizes the impact on adaptation of the number of hops that must be transversed between the update/event producing node and the sink node. The number of nodes of a linear network (scenario 1–C) is increased between 5 and 30, corresponding to 4 and 29 hops.
We see in Figure 13 that no noticeable trend exists be-tween the number of hops that need to be transversed and the capacity of the application to adapt to network conditions. That is, while the average latency will increase as the number of hops rises the application can still as effectively predict probabilistic bounds for the future latencies. This result strongly supports our hypothesis that probabilistic real-time operation can be achieved in real networks, under a variety of different circumstances; from small networks to large networks.
While the simplicity of the simulated scenarios 1 and 2,
-5% -4% -3% -2% -1% 0% 1% 2% 3% 4% 5% 6% 3-A 3-B 3-C 3-D Deviation fr om P erfect A daptation
Figure 14: Scenarios 3–A, 3–B, 3–C and 3–D
as well of the real network, provide good testing grounds for a variety of different experiments (which highlight particular properties and important corner cases), they do not reflect the complexity of realistic larger-scale networks. The base simulation scenario 3 addresses the effectiveness of adapta-tion in more complex and realistic networks.
The four concrete scenarios derived from the base sce-nario 3 address increasingly complex situations. First we start with static nodes which communicate at a constant rate (scenario 3–A). Then we change to a probabilistic event interval model (scenario 3–B). To this we add the movement of network nodes (including the source and sink nodes — scenario 3–C) and, finally, we incorporate competing message flows, which will further disrupt the latencies pertaining to the measured flow of event update messages (scenario 3–D). Figure 14 presents the adaptation results for all of these scenarios.
In general, we observe that even under complex scenarios the approach of monitoring and adaptation is effective, as all of the simulated scenarios stay within approximately ±5% of the target coverage. More particularly, we notice that, as happened in the real network and in the simulated base scenario 1, the transition from a constant (scenario 3–A) to a probabilistic message interval (scenario 3–B) resulted in the average coverage shifting closer to the desired target. This further corroborates the evidence that increasing the sources of temporal uncertainty does not diminish adaptation performance, but can instead increase it.
Comparing the box plots for scenarios 3–B and 3–C we witness that there is a slight decline in adaptation performance as movement is introduced in the network. This was the only case in this evaluation where introducing further sources of potential temporal uncertainty negatively impacted the performance of adaptation. An examination of the simulation traces revealed the source of this decline: disruptions in the network communication caused by the node movement which the AODV routing protocol could not repair in a timely fashion, and thus cause periods of
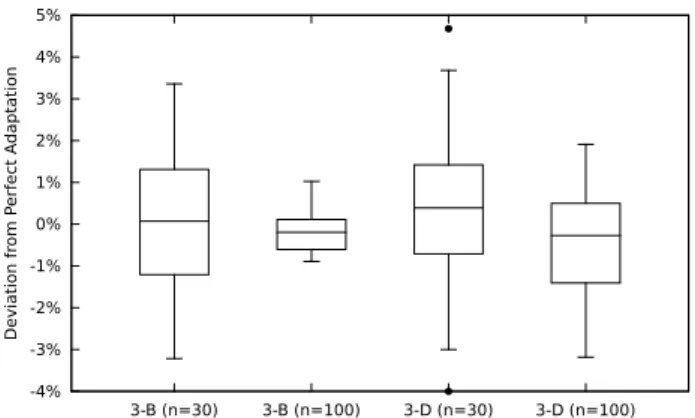
-4% -3% -2% -1% 0% 1% 2% 3% 4% 5% 3-B (n=30) 3-B (n=100) 3-D (n=30) 3-D (n=100) Deviation fr om P erfect A daptation
Figure 15: Scenario 3 — Adaptation Effectiveness at Dif-ferent Sample Sizes
communication outage, at seemingly unpredictable intervals. Nevertheless, even this highly anomalous behavior increased the maximum deviations from the target coverage by less than 2%, which attests to the robustness of the applied stochastic analysis. To the contrary, introducing competing messages flows on top of node movement, as was done in scenario 3–C, again improved the adaptation performance, with lower maximum deviations from the target coverage.
Finally, we present and discuss the effect of increasing the sample size in the more realistic base scenario 3. Figure 15 shows the results.
We see that when no movement was present (scenario 3–B) the increase in sample size was highly effective in improving adaptation. On the other hand, when in the presence of movement (scenario 3–D) the improvement was comparatively mild. As in the previous analysis, we believe this was the product of the occasional (but severe) disruptions that occurred, due to the limitations of the AODV routing in the studied scenario.
V. RELATEDWORK
One of our long-term research objectives is to improve the dependability of real-time WSNs. Therefore, our work is in general related to real-time and QoS provision in the context of WSNs, but more specifically with mechanisms and approaches to deal with the uncertainties affecting the timeliness of communication.
Several works address the problem of providing QoS and real-time guarantees in WSNs, which can be tackled at different levels, including the network architecture, sensor node hardware, and protocols at the different layers of the communication stack (MAC, network, transport, ap-plication) [6][7]. One particularly relevant and important approach for dependable and real-time operation is to ex-ploit the intrinsic redundancy existing in large-scale WSNs. While the deployment of many nodes can be a cause of interferences and increased uncertainty, it also allows for multi-path protocols to be considered [8][9]. A different
approach is to differentiate classes of traffic, assigning higher priorities to urgent or real-time data. For instance, the RAP architecture [10] takes into account routing distances when assigning priorities and routing packets, to reduce deadline misses for packets far-away from their destination.
One of the fundamental problems for predictability and dependability is the interference that derives from the crowded electromagnetic spectrum [11]. In this paper we considered several scenarios involving interference, to ob-serve the behavior of communication from a temporal perspective, and to investigate the possibility of correctly characterizing this behavior with our stochastic analysis ap-proach. The work presented in [12] also considers the impact of interference processes in WSNs. However, their goal is to characterize the interference itself rather then its effects on timeliness, and propose solutions to reduce or avoid this interference, and thus achieve a better overall behavior. The detection of radio interferences, as done in [13], can be relevant from a communication reliability perspective, while the possibility of assessing the wireless link quality [14], [15] can, in general, be useful for achieving dependable adaptation.
Finally, experimentally observing, measuring and charac-terizing the behavior of WSNs is not easy, as it usually involves the need of special setups and measurement equip-ment [16]. Our approach was to use additional measureequip-ment equipment (a dedicated network node, plus a PC) to perform these measurements. On the other hand, experiments are usually done for specific application environments (e.g., industrial ones [17]) or using existing testbeds (e.g., one that was previously used to validate a routing protocol [18]), whereas our objective in this case was to create scenarios that would allow us to compare the results of a real setting with those of simulated systems.
VI. CONCLUDINGREMARKS
Dependably achieving real-time operation in wireless and open environments is a hard problem. The nature of open environments not only makes it impossible to provide hard real-time guarantees, since no timing bounds can be strictly assumed, but also makes this a hard issue to research, since it is not clear what typical bounds can be safely assumed. We tried to overcome this obstacle by investigating how effective our proposed approach was under a variety of typical scenarios configured with stringent parameters.
Specifically, we showed the effectiveness of the strategy of continually monitoring and adapting to varying network conditions, under a variety of scenarios, to providing proba-bilistic real-time guarantees in 802.15.4 networks. We used a real network to provide authoritative latencies regarding a simple linear networking scenario and simulations to explore more complex and larger networks architectures. By comparing equivalent real and simulated scenarios we provided evidence that the simulation results were reliable.
Our results show that probabilistic real-time operation can dependably be achieved in 802.15.4 networks, despite network dynamics. Even without performing any adaptation at the level of the network nodes, we secured coverages within ±5% of the target coverage. We also observed that these results could be further improved upon, for instance by increasing the sample size. Additionally, we confirmed the robustness of the applied stochastic technique under a variety of circumstances, including a demonstration of equal effectiveness for networks of extremely different sizes.
These results pave the way for exploring more sophis-ticated adaptation techniques, which can provide better trade-offs between coverage and application performance / resource consumption, or achieving highly dependable probabilistic real-time guarantees.
REFERENCES
[1] Marques, L., Casimiro, A.: Lightweight dependable adapta-tion for wireless sensor networks. In: Proceedings of the 30th IEEE International Symposium on Reliable Distributed Sys-tems Workshops, 4th International Workshop on Dependable Network Computing and Mobile Systems (DNCMS 2011), Madrid, Spain
[2] Li, Q., Rus, D.: Global clock synchronization in sensor
networks. IEEE Transactions on Computers 55(2) (2006) [3] Yoon, S., Veerarittiphan, C., Sichitiu, M.L.: Tiny-sync: Tight
time synchronization for wireless sensor networks. ACM
Trans. Sen. Netw. 3(2) (June 2007)
[4] Chatzigiannakis, I., Fischer, S., Koninis, C., Mylonas, G., Pfisterer, D.: Wisebed: An open large-scale wireless sensor
network testbed. In Komninos, N., Akan, O., Bellavista,
P., Cao, J., Dressler, F., Ferrari, D., Gerla, M., Kobayashi, H., Palazzo, S., Sahni, S., Shen, X.S., Stan, M., Xiaohua, J., Zomaya, A., Coulson, G., eds.: Sensor Applications, Ex-perimentation, and Logistics. Volume 29 of Lecture Notes of the Institute for Computer Sciences, Social Informatics and Telecommunications Engineering., Springer Berlin Hei-delberg (2010) 68–87
[5] Corke, P., Wark, T., Jurdak, R., Hu, W., Valencia, P., Moore, D.: Environmental wireless sensor networks. Proceedings of the IEEE 98(11) (nov. 2010) 1903 –1917
[6] Mart´ınez, J.F., Garc´ı, A.B., Corredor, I., L´opez, L.,
Hern´andez, V., Dasilva, A.: Qos in wireless sensor networks:
survey and approach. In: Proceedings of the 2007 Euro
American conference on Telematics and information systems. EATIS ’07, New York, NY, USA, ACM (2007) 20:1–20:8 [7] Akyildiz, I.F., Melodia, T., Chowdhury, K.R.: A survey on
wireless multimedia sensor networks. Computer Networks 51 (2007) 921–960
[8] Li, S., Neelisetti, R., Liu, C.: Efficient multi-path protocol for wireless sensor networks. International Journal of Wireless and Mobile Networks (IJWMN) (Jan 2010)
[9] Felemban, E., gun Lee, C., Ekici, E., Boder, R., Vural, S.: Probabilistic qos guarantee in reliability and timeliness domains in wireless sensor networks. In: Proc. of the IEEE Infocom. (2005) 2646–2657
[10] Lu, C., Blum, B., Abdelzaher, T., Stankovic, J., He, T.: Rap: A real-time communication architecture for large-scale wireless sensor networks. In Real-Time Technology and Applications Symposium (2002)
[11] Zhou, G., Stankovic, J.A., Son, S.H.: Crowded spectrum in wireless sensor networks. In: Proceedings of Third Workshop on Embedded Networked Sensors (EmNets. (2006)
[12] Liang, C.J.M.: Interference characterization and mitigation in large-scale wireless sensor networks (2011)
[13] Zhou, G., He, T., Stankovic, J.A., Abdelzaher, T.: Rid: Radio
interference detection in wireless sensor networks. In: in
INFOCOM. (2005)
[14] Baccour, N., Koub´ıa, A., Ben Jam´ıa, M., do Ros´ario, D., Youssef, H., Alves, M., Becker, L.B.: Radiale: A framework for designing and assessing link quality estimators in wireless sensor networks. Ad Hoc Netw. 9 (September 2011) 1165– 1185
[15] Xu, Y., chien Lee, W.: Exploring spatial correlation for link quality estimation in wireless sensor networks. In: in Proc. IEEE PerCom. (2006) 200–211
[16] Ageev, A., Macii, D., Petri, D.: Experimental characterization of communication latencies in wireless sensor networks. In: Proceedings of the 16th IMEKO TC-4 International Symposiu ”Exploring New Frontiers of Instrumentation and Methods for Electrical and Electronic Measurements” and 13th Workshop on ADC Modelling and Testing, IMEKO, A&T (2008) 258– 263
[17] Bertocco, M., Gamba, G., Sona, A., Vitturi, S.: Experimental characterization of wireless sensor networks for industrial applications. Instrumentation and Measurement, IEEE Trans-actions on 57(8) (aug. 2008) 1537 –1546
[18] Pavkovic, B., Theoleyre, F., Barthel, D., Duda, A.: Exper-imental analysis and characterization of a wireless sensor
network environment. In: Proceedings of the 7th ACM
workshop on Performance evaluation of wireless ad hoc, sensor, and ubiquitous networks. PE-WASUN ’10, New York, NY, USA, ACM (2010) 25–32