Fiscal Targets, Automatic Stabilisers
and their Effects on Output
Ray Barrell
*, Ian Hurst
**and Álvaro Pina
***June 2002
Abstract
In this paper we review the European macroeconomic policy framework, and address the issue of setting safe
deficit targets - targets that make it very unlikely that a country exceeds the 3 per cent ceiling of the Stability and Growth Pact. In this context, the scope for an increase in public investment is discussed. We also look at automatic stabilisers and argue that their ability to smooth output depends on the kind of disturbance that hits the economy.
JEL classification: E61, E62, H61
Keywords: automatic stabilisers, Stability and Growth Pact, fiscal targets, public investment
*
National Institute of Economic and Social Research and Imperial College. E-mail:
**
National Institute of Economic and Social Research. E-mail: [email protected]
***
ISEG/Univ. Técnica de Lisboa and UECE (Research Unit on Complexity in Economics). E-mail:
Introduction
In this paper we wish to investigate the role of the Stability and Growth Pact (SGP),
both as part of the European architecture and also as an economic tool for policy
co-ordination. The Pact constrains government deficits, and this may affect the ability of
governments to undertake discretionary action to offset shocks to individual
economies and the European economy as a whole. There may also be a constraint on governments that prevents them from allowing the Automatic Stabilisers to operate.
The Pact may also constrain government investment, and this may damage longer
term prospects in the European Union. Not all of these considerations impinge
immediately on policy makers, but the possibility of Germany and Portugal receiving
admonishing letters for excessive deficits from the Commission in the recent past has
brought the nature of the Pact to the fore in policy debates. The slowdown in
economic activity in 2001 and 2002 is indeed the first true test of the SGP.
We first discuss the European policy environment, and we then discuss the roles of
rules and discretion in European fiscal policy frameworks. We discuss the
implications of the Pact for government investment in infrastructure, and investigate
its potential impact on medium term growth in the economy. We use our model,
NiGEM, to undertake this analysis. We go on to discuss Automatic Stabilisers and their role in an economy subject to both supply and demand shocks where financial
markets are forward looking and monetary policy makers reactive. We argue that
stabilisers generally work but that we should not expect too much from them. We use
OECD estimates of stabilisers, which may be regarded as the industry standard, and
implement them within our model, NiGEM. We also use the model to investigate,
using stochastic simulations, what the ‘safe’ deficit targets may be.
The European Policy Framework
The European Union has an unusual governance structure by the standards of other
advanced economies, with responsibilities delegated to a wide range of bodies. Whilst
the broad frameworks for monetary and fiscal policy are becoming clearer, there are a
number of institutions that have responsibility for surveillance and co-ordination of
the macroeconomic policy mix. The two parties in the governance structure are the
Council of the European Union and the European Commission1.
The Council of the European Union is the Community’s legislative body. It
co-ordinates the general economic policies of the Member States and concludes, on
behalf of the Community, international agreements between the latter and one or more
1
States or international organisations. The Council is composed of one representative
at ministerial level from each Member State, who is empowered to commit his
government. Council members are politically accountable to their national
parliaments. Meetings of the finance and economy ministers are known as ECOFIN
which plays a central role in macroeconomic management within the EU. It has issued annual Broad Economic Policy Guidelines for Member States since 1993 and is the
main forum for undertaking surveillance decisions of national economic policies.
Responsibility for exchange rate policy in the Euro Area is divided between the
European Central Bank (ECB) and the Council, even though the ECB has sole
responsibility for implementing monetary policy.
The European Commission has the right of initiative in legislation, and it submits a
proposal to the Council. Each proposal is examined within the Council, which may
amend it before adoption. In many cases, including the internal market, Community
legislation is adopted jointly by the Parliament and the Council under a ‘co-decision’
procedure. The European Community’s budget is also approved by the European Parliament and by the Council. Voting procedures vary. Depending on the case, the
Council acts by a simple majority of its members, by a qualified majority, or
unanimously. Matters of taxation and exchange rate arrangements require unanimity.
The European Commission is the executive body of the EU and also has an important
role in forming overall macroeconomic policy. In most instances the Council of
Ministers is unable to legislate unless there is a proposal from the Commission. The
Commission has a central role in the preparation of surveillance decisions regarding
the economic policies of Member States, and has primary responsibility for operating
competition policy, regulating the internal market and undertaking external trade
negotiations. The Commission has little role to play in stabilisation policy at present.
There is a small EU budget of just over 1 per cent of GDP, which is primarily spent
on assistance to agriculture, via the Common Agricultural Policy, and to less developed regions via the use of structural funds. Deficit financing is prohibited. It
remains an open question whether the absence of fiscal federalism of the kind seen in
the United States raises the costs from abolishing internal exchange rates within the
Euro Area.
The process of institution building in Europe is still under way, and there are clear
gaps to be filled. The recognition that short-term, interventionist macroeconomic
policies were often unproductive has influenced the construction of the new
institutions. In particular, the decision to eschew the existence of a powerful central
fiscal authority reflects in part this view. However, it also reflects the need to
recession, then it remains available. It would be in the interests of all to use it and the
institutions described above could ensure rapid and effective reactions to problems.
Problems that hit individual countries should be able to be dealt with within the
confines of the SGP, but this may need reform and clarification so that countries do
have the ability to deal quickly with their own temporary problems. The European constitution is not yet written, and it may never be so, but the process of constructing
it is under way. Significant improvements within the constraints of multiple
sovereignty remain possible.
The ECB has an explicit objective of ensuring medium-term price stability in the Euro
Area. In contrast to most other central banks it has the freedom to set as well as to
implement policy targets. This is a stronger degree of independence than in other Euro
Area central banks in the past and than in North America and the UK. Medium-term
price stability has been defined by the ECB to be an annual rate of (harmonised)
consumer price inflation of between 0-2 per cent per annum. Price rises of up to 2 per
cent may be consistent with price stability given the expected, but difficult to measure, improvements that can be achieved in product quality. The monetary policy
strategy currently followed by the ECB has two broad pillars - a reference value for
broad money growth and a broadly based assessment of the outlook for price
developments. The reference value for annual monetary growth has been 4½ per cent
per annum since the inception of the Euro, reflecting the medium-term target for
inflation, plus an estimated long-term trend decline in the velocity of circulation of
½-1% per annum and trend GDP growth of 2-2½ % per annum.
Although monetary union has been established in Europe without a full fiscal or
political union, there are important constraints on budgetary behaviour arising from
the Stability and Growth Pact. The SGP extends the fiscal rules previously embodied
in the Maastricht Treaty, although the force of the excessive debt provision has been
diminished. It requires all the members of the Euro Area to adopt a medium-term objective of achieving budgets close to balance or in surplus. The Pact is underpinned
by an ‘excessive deficit procedure’ involving surveillance and possible penalties. A
general government budget deficit above 3 per cent of GDP is considered excessive
unless the European Commission judges it to be temporary (likely to last for only a
year) and there are special circumstances. Exemption is granted automatically if there
is an annual fall in output of more than 2 per cent, an event experienced only by
Finland and two non-participants – the UK and Sweden – in the last forty years.
Exemption may also be granted if there is a fall in output between 0.75 and 2 per cent.
lead to the imposition of financial sanctions2. The Amsterdam Treaty set out the
penalties associated with the SGP, but the overall framework has been evolving since
then. The Commission, in its Broad Economic Policy Guidelines (BEPG), has set a
target for the deficit as in balance or surplus in order to ensure that there is little
chance of countries exceeding the 3 percent limit. This guideline does not have the force of Treaty, unlike the penalties for exceeding the 3 percent of GDP deficit
barrier, and it can be interpreted by the Commission in various ways. The Council of
Ministers, and especially ECOFIN and its sub groups for the Euro Area and its
co-ordination committees that involve central bankers and Finance Ministry officials,
could design other fiscal guidelines for the Union and for the EMU members. These
committees meet regularly, and they are the forum for ‘coarse tuning’ of
macroeconomic polices within the Union.
There are other parts to the ‘Macro-Economic Dialogue’ that are more directly
associated with the Union’s Employment Strategy, and co-ordination of policy comes
partly through the desire to implement similar and coherent labour market reforms that are designed to make the Union more flexible. The last few years have seen the
design and implementation of National Action Plans (NAPs) to address employment
in the European Union. These plans were designed in relation to agreed objectives,
and have played a useful role in focussing efforts in areas where individual economies
were performing worse than the Community average. The four pillars in the strategy
that countries are expected to follow in their NAPs are:
• Attention should be paid to improving the employability of the unemployed;
• Serious consideration should be given to developing entrepreneurship;
• Flexibility in companies and on the part of employees should be encouraged;
• Policies for equal opportunities for men and women should be constructed.
Each NAP has to offer discussion of the effects of spending and taxes on employment
and suggest details for the implementation of specific employment oriented initiatives.
These features have to be backed up by a sound coverage of relevant labour market statistics. The first three pillars are backed by clear quantitative guidelines from the
Commission.
2
The Current Macro Environment and Government Budgets
Government budgets came under considerable strain in 2001 due to the sharp
slowdown in growth. The aggregate budget deficit for the Euro Area increased for the
first time since serious consolidation efforts began in 1993. The Euro Area budget
deficit was around 1¼ per cent of GDP in 2001 compared to the 0.6 per cent
projection implied from the Stability and Growth Programmes submitted in 2000.
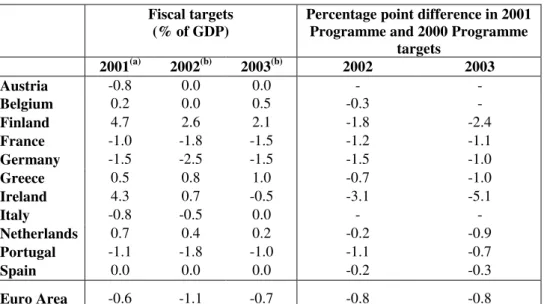
Table 1. Stability and Growth Programmes Fiscal Targets
Fiscal targets
(% of GDP) Percentage point difference in 2001 Programme and 2000 Programme targets
2001(a) 2002(b) 2003(b) 2002 2003
Austria -0.8 0.0 0.0 - -
Belgium 0.2 0.0 0.5 -0.3 -
Finland 4.7 2.6 2.1 -1.8 -2.4
France -1.0 -1.8 -1.5 -1.2 -1.1
Germany -1.5 -2.5 -1.5 -1.5 -1.0
Greece 0.5 0.8 1.0 -0.7 -1.0
Ireland 4.3 0.7 -0.5 -3.1 -5.1
Italy -0.8 -0.5 0.0 - -
Netherlands 0.7 0.4 0.2 -0.2 -0.9
Portugal -1.1 -1.8 -1.0 -1.1 -0.7
Spain 0.0 0.0 0.0 -0.2 -0.3
Euro Area -0.6 -1.1 -0.7 -0.8 -0.8 (a) 2000 Stability Programme. (b) 2001 Stability Programme.
As a consequence of the slowdown in activity several countries made significant
revisions to their budget projections in updated Stability Programmes released at the
end of 2001. Germany and Portugal have made significant downward revisions to
their projections, and as a result their projections were discussed at Council Meetings,
although no warning letters were issued. The aggregate budget deficit for the Euro Area may well remain at 1¼ per cent of GDP in 2002, with only a gradual reduction
for 2003.
If tax rates and expenditure plans were set to achieve an acceptable budget target
before the recent demand shock came along then there is no good reason to change
them. It could be that Germany, the potential recipient of a letter, could have stronger
automatic stabilisers (i.e. more progressive taxes, more generous marginal benefits,
etc.) than other countries and hence Germans perhaps need to adjust their automatic
stabilisers to reduce the probability of a deficit breach. However, this possibility has
not been widely discussed, although the evidence in Barrell and Pina (2002) and that
given below does suggest that this might be the case.
Discretionary Policy, the SGP and Public Sector Investment
The policy framework in Europe has been set up to reduce the scope for discretionary
Fine tuning of the economy is difficult, and many of the objectives that fine tuning
might be designed to achieve can be met with adequately designed automatic
stabilisers, though many of the problems that fine tuning faces are also faced by these
stabilisers. In particular, fine tuning is not particularly good at coping with supply
shocks and in the short term economists and politicians have difficulty discerning the difference between an adverse supply shock and a negative demand shock. However,
in extreme circumstances there should be scope for ‘rough tuning’ to deal with severe
recessions. Institutions have to be strong enough to deal with these eventualities, and
it is not clear that they presently are, as the deficit targets are perhaps too tight. We
analyse one possible piece of rough tuning and investigate the effects of a sustained
fiscal expansion with and without a shift in the deficit target.
It can be argued in particular that the administrative guideline that budgets should be
in balance or surplus is too tight, and unwise. The current targets have meant that in
the recent past public investment in infrastructure has been a prime target for
budgetary cuts, despite the wide evidence that such a policy might reduce the potential for medium-term economic growth. Public sector infrastructure investment
can be an important source of productivity growth, and there may be periods when it
would be wise to raise public investment well above its current levels, for instance in
a period of rapid technical change. At these times, it could be optimal to raise
borrowing, rather than taxes, so that the costs of the increased investment could be
shared by the generations that would benefit from it. The SGP as it stands could
prevent this if the extra level of investment pushed national budgets into deficit, and
hence it is possible that the SGP and the associated surveillance procedures may
inadvertently reduce the level of public investment in Europe if they are implemented
to the letter. The policy debate in Europe should consider whether the fiscal
framework should evolve towards a position where public borrowing could, over the
cycle, be justified in relation to public investment.
The Maastricht Treaty formulated the goal of a budget deficit of less than 3 percent of
GDP, based in part on the golden rule of public finance that allows borrowing to
finance productive investment. In the run up to that Treaty the public sector in the
Euro Area as a whole had been investing as much as 3 percent of GDP in
infrastructure, and the golden rule would allow borrowing up to this amount.
However, the 1990s saw a marked reduction in public sector investment as part of the
consolidation process to achieve Monetary Union. This is expected to continue as the
SGP, with its plan for budgets in balance or surplus over the cycle, is implemented. If
there were to be a revision to the guidelines one obvious benefit would be to allow for
The decision to put further constraints on the potential for public borrowing was
clearly wise in the early period of construction of Monetary Union in Europe.
However, it is worth discussing alternatives to the SGP, looking in particular at the
sustainability of public finances in the European Union and at the role of the public
sector in strengthening the prospects for output growth. It is not clear that the SGP is necessarily the best framework for these objectives. There is a very strong case to be
made for allowing the public sector to borrow over the cycle. However, it is clear that
moving all the way to the Golden Rule would not be sustainable, and a compromise
target could be set, say half way between the two. Looser targets still mean
sustainable public finances, and the consolidation process has inevitably meant that
productive expenditures have been cut to meet targets.
We can analyse the policy choices facing Europe by undertaking a simple simulation
on NiGEM, the National Institute Global Econometric Model (see relevant details in
the appendix), where we increase the level of public sector investment by 1% of GDP
from 2002q1 onward. We assume that there are no implementation problems, and that public sector investment is productive, and enters the national capital stock. Fiscal
policy expansion can either be within the SGP guidelines, and thus tax financed, or
we could have a sustained increase in borrowing of 1% of GDP. This latter policy
initiative would shift the ‘in balance or surplus’ guideline, but we argue below that it
would not be in breach of the Treaty obligations to stay safely within 3% of GDP
deficits. As we can see from Chart 1, output would be noticeably higher for 4 to 6
years, and initially the gain would be 1% of GDP, and around 0.7 percent in the first
year. These multipliers are low because we have monetary policy rules in place that
would raise nominal interest rates, and leakages into imports are noticeable, even at a
European level.
The medium term gains would be more sustained if the expenditure were financed by
borrowing, although the initial impact on the economy would be smaller. The more sustained path for gains comes because taxes are not raised and consumers do not
therefore react so quickly to the impact of higher spending on the resources they have
available over their lifetimes. In both of these experiments we assume that financial
markets (and consumers) are forward looking. If there is an increase in the size of the
government sector, financed by taxation, incomes and consumption in the future must
be lower and hence private sector net saving in Europe will fall and real interest rates
will hence rise. As a result, even with tax finance real long term interest rates must
rise by 0.2 to 0.3 percent, and with the ECB’s two pillar strategy this means that
nominal rates must rise as well. Of course we assume short rates rise immediately in
Chart 1 The Effects on Euro Area Output of a 1% of GDP Increase in Government Investment (% difference from baseline)
-0.2 0 0.2 0.4 0.6 0.8 1 1.2 2002 Q1 2002 Q4 2003 Q3 2004 Q2 2005 Q1 2005 Q4 2006 Q3 2007 Q2 2008 Q1 2008 Q4 2009 Q3 2010 Q2 2011 Q1 2011 Q4 2012 Q3 2013 Q2 2014 Q1 2014 Q4 2015 Q3 2016 Q2 2017 Q1 2017 Q4 2018 Q3 2019 Q2 2020 Q1 2020 Q4 2021 Q3 2022 Q2 2023 Q1
Tax Financed Investment Bond Financed Investment
If the increase in spending were not tax financed the increase in deficits would imply that the debt stock would rise by 20% of GDP in the longer term. This would mean
that real (and hence nominal) interest rates would rise by more in future, and hence
real long term rates would rise by 0.3 to 0.35 percent now. Hence debt finance would
reduce both the immediate impact effects and the longer-term impact on output.
Decomposing Stabilisation Gains
Considerable attention has been paid to the scope for the use of fiscal policy as a
stabilisation tool under the SGP. Eichengreen and Wyplosz (1998), Dalsgaard and De
Serres (1999) and Buti et al. (1998) have discussed whether there will still be room
for automatic stabilisers. The latter authors argue that a fiscal position close to balance
or in surplus means that automatic stabilisers will be restored. However, it is widely
accepted that while countries are still close to the 3 per cent threshold a potential
incompatibility between built-in stabilisers and the SGP exists (e.g. Eichengreen,
1997). It is also of interest to quantify how effective automatic stabilisers are at
smoothing output. Studies like Bayoumi and Eichengreen (1995), European Commission (1997) and Allsopp et al. (1997) are based on a very limited number of
deterministic simulations, mainly consisting of demand shocks, which excludes many
Barrell and Pina (2002) and Barrell and Dury (2001)3. As Blanchard (2000) suggests,
concentrating on demand shocks may bias the results towards large stabilisation gains
(smaller output gaps). In this section we extend this analysis by analysing the role of
automatic stabilisers under different sorts of shocks using NiGEM.
For each of the EMU countries analysed in this paper, fiscal revenues can be disaggregated into personal income taxes plus social security contributions (TAX),
corporate taxes (CTAX) and miscellaneous taxes (mainly indirect; MTAX).
Expenditures comprise government consumption and investment (GC and GI),
interest payments (GIP) and transfers (TRAN). The budget balance thus reads:
BUD = TAX + MTAX + CTAX - TRAN - GIP - GC – GI (1)
Government interest payments are modelled as the income on a perpetual inventory,
the change in the debt stock each period paying the long interest rate in the issue
period until it is replaced4. Variables GC and GI are not cyclically sensitive, unlike
transfers and revenues (see below). Personal taxes and transfers affect disposable
income, as do interest payments5. Further, all budget items feed into the economic system through their impact on the budget balance, and thus on the economy’s asset
stocks.
The results in this section follow from those in Barrell and Pina (2002), where a more
complete analysis of the role of Automatic Stabilisers can be found along with their
implications for deficit breaches under the SGP. Barrell and Pina follow the OECD,
and other international organisations that calculate structural fiscal positions, in
modelling automatic fiscal stabilisation – both in defining which revenue and
expenditure items are assumed to depend on the cycle, and in quantifying such
dependence. They assume that tax revenues respond to the economy’s cyclical
position, whilst on the expenditure side only unemployment benefits do so. Further,
each cycle-dependent budget item displays a given, nationally distinct constant
elasticity with respect to the output gap6. In order to evaluate stabilisers two policy regimes are simulated: one where taxes and unemployment transfers are determined
according to OECD elasticities, the other where taxes and spending plans are set at
3
Another paper on automatic stabilisers is Van den Noord (2000). However, it is not clear what method this author uses to draw shocks and apply them, and hence we feel it is difficult for us to compare our results with his.
4
The perpetual inventory attempts to take account of countries like Italy and Belgium where there are large proportions of short-term public debt. Our simple model cannot take account of the complexities of debt finance, and there are residuals on these equations, and these are used in stochastics.
5
Variable GIP also influences net property income paid abroad, and thus the current account and asset stocks as well.
6
their structural trajectory levels, and there are no fiscal feedback mechanisms
operating to stabilise the economy.
Automatic stabilisers alone cannot account for fiscal behaviour over the cycle, since
political and bureaucratic factors also play a role (see Melitz, 1997). It is also true that
elasticities are endogenous, at least in the medium term. However, it is useful to assess, in the light of the existing elasticity estimates and abstracting from political
biases, how effectively European tax and transfer systems smooth output fluctuations.
First, even if such systems proved incompatible with SGP rules and a reform of
taxation and unemployment benefits ensued, any accompanying increase in output
volatility would be a loss in itself, whose quantification provides one possible
rationale for our approach. Furthermore, the conventional view of automatic
stabilisers continues to be found in recent studies on European fiscal policy (e.g. Buti
et al. (1998), Artis and Buti (2000)).
An attractive feature of the conventional view of automatic stabilisers is that it can be
expressed as a set of ‘simple rules’ for the relevant budget instruments - thus making it possible to perform a formal analysis of the ensuing policy regime in the dynamic,
rational expectations framework of NiGEM. Following the OECD ensures that our
results are comparable to previous research by other authors (discussed above). For a
given item with (nominal) value T, the OECD determines the corresponding structural
(or cyclically adjusted) amount by the formula
T T Y
Y a =
* α
(2)
where Y* represents potential output, Y actual output and α is thus an elasticity with
respect to the output gap. The OECD cyclically adjusts five budget categories:
personal income tax, social security contributions, indirect taxes, corporate taxes and
current primary expenditure. The elasticity applied to the latter is typically small,
reflecting the circumstance that unemployment benefits are the only expenditure item
assumed to vary automatically with the cycle. Our objective in using these values is
not the same as the OECD’s. They compute the structural values of budget items for
given actual amounts, we aim at obtaining actual taxes and expenditure that, although
varying across stochastic trials, correspond to a given unchanged structural stance.
They thus reflect the operation of automatic stabilisers in the wake of a variety of
shocks and in the absence of discretionary fiscal policy measures.
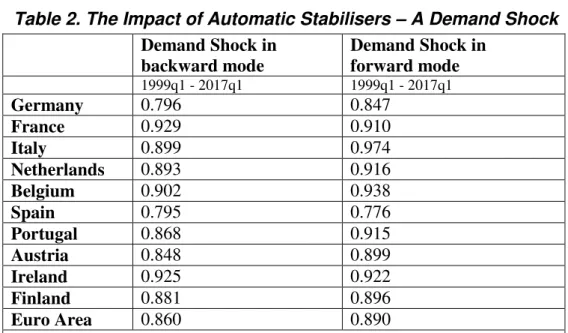
Table 2. The Impact of Automatic Stabilisers – A Demand Shock
Demand Shock in backward mode
Demand Shock in forward mode
1999q1 - 2017q1 1999q1 - 2017q1
Germany 0.796 0.847
France 0.929 0.910
Italy 0.899 0.974
Netherlands 0.893 0.916
Belgium 0.902 0.938
Spain 0.795 0.776
Portugal 0.868 0.915
Austria 0.848 0.899
Ireland 0.925 0.922
Finland 0.881 0.896
Euro Area 0.860 0.890
The backward shock is run with fixed interest rates and exchange rates and no rational expectations. We implement a large shock to US consumption with and without automatic stabilisers.
The forward shock is run with the two pillar strategy in place and forward looking
financial and exchange markets, as well as forward looking labour markets. We implement the same large shock to US consumption with and without automatic stabilisers.
It is common to evaluate automatic stabilisers in terms of their ability to stabilise the
economy in response to a single shock. We can do so for a simple demand shock such
as a fall in US demand, starting the simulation in 1999q1 and evaluating the role of
policy and expectations in stabilising the economy. We apply the same shock in
backward mode and forward mode, as explained in Table 2. Our run in
forward-looking mode assumes that individuals form model consistent expectations and that EMU was in place. In each case we also run the model without automatic stabilisers,
and calculate the gain in terms of the root-mean-squared deviation (RMSD) of output
from baseline with stabilisers and without them. The ratios of these RMSDs (‘with’
over ‘without’) are reported in Table 2 both for the Euro Area as a whole and for
individual economies. Clearly, in the face of demand shocks automatic stabilisers
produce a more stable outcome. Stabilisation gains appear to be significant, especially
if we assume no response by financial markets and the monetary authorities. The Euro
Area as a whole has an RMSD of output that is 14% better when there are stabilisers
in place than when there are not. Germany and Spain particularly benefit from the
presence of these feedbacks. However, if we let the monetary authorities absorb some of the shock7 then roughly a fifth of the gain is removed. If the shock is negative, as it
is here, short-term interest rates will be cut both now and in the future, and as a result
7
forward looking long term rates will go down as well, and both of these will help
stabilise the economy.
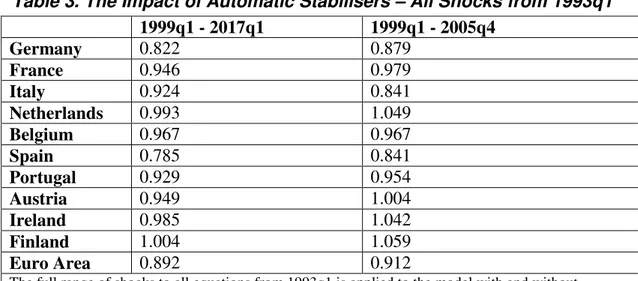
Table 3. The Impact of Automatic Stabilisers – All Shocks from 1993q1
1999q1 - 2017q1 1999q1 - 2005q4
Germany 0.822 0.879
France 0.946 0.979
Italy 0.924 0.841
Netherlands 0.993 1.049
Belgium 0.967 0.967
Spain 0.785 0.841
Portugal 0.929 0.954
Austria 0.949 1.004
Ireland 0.985 1.042
Finland 1.004 1.059
Euro Area 0.892 0.912
The full range of shocks to all equations from 1993q1 is applied to the model with and without automatic stabilisers. The model is run with the two pillar strategy in place and forward looking financial and exchange markets, as well as forward looking labour markets.
The evaluation of the stabilising properties of the feedbacks depends upon the time
horizon considered and the complexity of the shocks. We can apply all the shocks that
occurred in 1993q1, for instance, to our model. As shown in Table 3 (first column),
over the 19 years of our run the automatic regime is stabilising for almost all
countries, with it producing no discernible impact for Finland, which was subject to
severe supply shocks around 1993. Over the first seven years (equivalent to the results
normally published in other studies) the automatic stabilisers regime is stabilising for
some countries but not for others (second column of Table 3). Over this period, as we
might expect, automatic stabilisers are less effective in the small open economies. The
Euro Area as a whole makes a stabilisation gain of 9 percent, marginally below the 11
percent reported in Barrell and Pina (2002) for repeated trials drawn from 1993q1 to
1997q4.
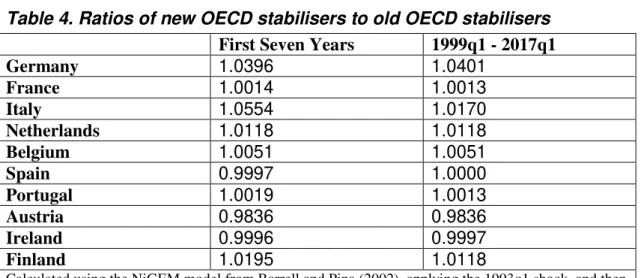
It is useful to compare the elasticities utilised in Barrell and Pina (2002) and other
studies with those used in van den Noord (2000). For most economies there is little
impact when we change elasticities (see Table 4). The impact on the RMSD of output
as compared to the no-stabilisers case changes by less than 1 percent for Ireland,
Portugal, Spain, Belgium and France, and just above 1 percent for Finland and the
Netherlands. These differences will produce very little impact on our conclusions. The
slightly larger increase in the value of stabilisers in Austria would not impact greatly
on our results. Only in Germany and Italy, at least in the short run, do the stabilisers
the corporate tax regime, removing the lag in payments discussed in Barrell and Pina
(2002). However, corporate tax receipts are generally so small that they have little
impact on the overall effect of the regime. Changes in personal tax regimes in
Germany, and to a lesser extent in Italy, decreased the scale of the stabilisers
somewhat.
Table 4. Ratios of new OECD stabilisers to old OECD stabilisers
First Seven Years 1999q1 - 2017q1
Germany 1.0396 1.0401
France 1.0014 1.0013
Italy 1.0554 1.0170
Netherlands 1.0118 1.0118
Belgium 1.0051 1.0051
Spain 0.9997 1.0000
Portugal 1.0019 1.0013
Austria 0.9836 0.9836
Ireland 0.9996 0.9997
Finland 1.0195 1.0118
Calculated using the NiGEM model from Barrell and Pina (2002), applying the 1993q1 shock, and then repeating the exercise with the Van den Noord (2000) elasticities. Results are ratios of RMSD of output.
Setting the Deficit Target
Barrell and Dury (2001) present extensive results on fiscal issues and also discuss the
recent literature on the appropriate targets for government budget deficits. Some
simple descriptive statistical analyses have been undertaken based on retrospective
evidence. The work in Buti and Sapir (1998), for instance, broadly suggests that the
European economies could operate well within the SGP guidelines if they broadly followed a balanced budget target and if some, such as the Nordic economies, aimed
for a surplus. These results depend on the observed volatilities of both the economies
in question and their budget deficits and they probably paint too pessimistic a view of
the constraints governments face. In particular, the Nordic economies exhibited
volatile business cycles in the 1970s and 1980s into the early 1990s because they went
through a sequence of devaluation induced booms and downturns. These are no longer
possible to generate in quite the same idiosyncratic way given monetary policy
commitments in Finland, Denmark and Sweden.
We investigated this issue in a number of papers using stochastic simulations on
NiGEM (see Barrell and Dury (2001), Barrell and Pina (2002) and Dury and Pina
(2000))8. The probabilities of breaching the SGP were calculated and in all three
papers the conclusion was that the targets for the government deficit announced in the
8
stability programmes were broadly compatible with the automatic stabilisers working
freely and that the structure in place could cope well in stabilising the economy given
a variety of shocks. Clearly, the closer to zero the target deficit, the easier it would be
for fiscal stabilisers to work.
Table 5. Target deficit required for a 1% chance of breaching the 3% limit
Monetary
Target Two Pillar Strategy Inflation Target
Germany 1.73 1.59 1.53
France 2.28 2.14 2.11
Italy 1.97 1.71 1.72
Netherlands 1.85 1.73 1.59
Belgium 0.47 0.46 -0.03
Spain 1.41 1.48 1.33
Portugal 2.31 2.25 2.25
Austria 1.42 1.44 1.30
Ireland 1.12 0.96 1.05
Finland 1.22 1.10 1.24
In Barrell and Dury (2001) we calculate the target deficit required for there to be only
a 1 per cent chance of exceeding the SGP 3 per cent ceiling. The stochastic
simulations give us the variability of the government budget ratio and from this we
can calculate the required mean target for each country. Table 5 presents these results.
We show that the level of the government budget deficit required for a 1 per cent
chance of exceeding the 3 per cent limit without constraining the automatic stabilisers built into the model9 is relatively high compared with most other estimates, as
discussed by Buti and Martinot (2000). For example, an econometric analysis by
Dalsgaard and de Serres (1999) reports appropriate medium-term target deficits of the
order of 1–1.5 per cent of GDP for the majority of the European economies. Finland,
UK, Denmark and Sweden are estimated to require moderate surpluses to keep within
the SGP criteria. Our results suggest that the main European economies can run looser
deficit targets.
Our stochastic simulation results have the advantage of being based on a model of the
European economies that we think will exist in the future with a policy environment
that is a reasonable idealised description of the current framework. They should
therefore be reasonably robust to the criticism of not taking account of structural
changes in the economy and in policy regimes, whilst those based on historical outturns are riddled with such problems. Our results in Table 5 suggest that amongst
the automatic stabilisers on our model to operate without breaching the 3 per cent of
GDP deficit limit. We show the results over a number of types of monetary policy
rules, and these are discussed further in Barrell and Dury (2001). In that paper it is
shown that the core Euro Area economies would require tighter deficit target
trajectories if the ECB were targeting an inflation rate as this strategy increases interest rate volatility and hence the volatility of government debt interest payments.
Setting target deficits ‘close to balance’, as in the Pact, can be seen as aiming for a
target range of 0–1 per cent of GDP. This is tighter than the ‘safe’ budget targets
shown in Table 5. There are three possible effects of the economic cycle on the
budget, in that tax revenues automatically rise with incomes and expenditures on
items such as unemployment insurance automatically fall, and also as revenues
improve there are political pressures to lean with the wind and cut taxes and raise
spending. The first two are best described as automatic stabilisers. NiGEM has effects
of the cycle on unemployment related transfers similar to those in van den Noord
(2000), but probably has smaller cycle related tax elasticities. Barrell and Pina (2002) embed the ‘industry standard’ tax elasticities into the model and show that the
volatility of the deficit increases somewhat, but not enough to make target deficits in
the range of 0–1 per cent of GDP induce more than the very occasional breach of the
SGP. There is clear scope within the current arrangements for the unfettered operation
of automatic stabilisers. However, there are good reasons to be cautious and set target
deficits closer to zero than those in Table 5. The ‘close to balance’ rule can also be
seen as being designed to offset some of the potential bias introduced into the
budgetary system by bureaucratic offsets discussed, for instance, in Mélitz (1997). We
would presume, as in the 1980s and 1990s, governments will find it difficult to run
surpluses even when they are appropriate to the cyclical position. We would conclude
that deficits around 1 per cent of GDP would be suitable for almost all countries in
EMU.
Summary and Conclusions
In this paper we have shown that there might be a case for changing the deficit target
within the SGP, making it possible to increase public investment. If targets were set at 1 percent of GDP then the 3 percent ceiling would be unlikely to be breached. We
have also shown that automatic stabilisers can be expected to work, but in the face of
supply shocks we cannot expect too much from them.
9
Appendix – the Structure of NiGEM
NiGEM is an estimated quarterly macroeconometric model using a ‘New-Keynesian’
approach. Agents are forward-looking in financial and labour markets, but the process
of adjustment to shocks is slowed down by nominal rigidities. Demand and supply
sides are fully modelled, alongside an extensive monetary and financial sector. The
model comprises estimated blocks for the whole world: all OECD countries are
modelled separately, and there are 8 non-OECD groups. The major economies have
fairly detailed models (60-90 equations, with around 20 key behavioural relations) sharing a similar theoretical structure, so that cross-country variation in simulation
properties reflects genuine differences resulting from estimation. National or regional
blocks are linked through trade, financial variables and asset stocks.
The core structure of NiGEM can be viewed as Dornbusch-Mundell-Fleming model
with forward-looking variables. The short run simulation properties are discussed in
Barrell, Dury, Hurst and Pain (2001) and longer term issues in Barrell, Dury and
Holland (2001). Consumption on the model can be either forward or backward
looking and it depends on income and (forward-looking) wealth, which entails the
need to ensure that the assets stocks of the private and public sectors are modelled
consistently within and across countries. Solvency constraints are imposed on governments, thus ruling out any long-run explosion in public debt stocks. Financial
markets are forward-looking. Exchange rates follow the uncovered interest parity
condition, while long term interest rates result from the forward convolution over 10
years of their 3-month counterparts. The latter are assumed to be the monetary
authorities’ instrument, set according to simple feedback rules. The impact of future
events is brought forward onto households by financial markets through variables
such as long rates and equity prices.
As regards the supply side, estimated demands for capital and labour form a basis to
calibrate aggregate CES production functions with exogenous labour-augmenting
technical progress. Capacity utilisation based on the production function feeds into the
wage and price system, playing an essential role in the model’s self-stabilising
properties. Different institutions in the labour and product markets make the estimated speed of adjustment of wages and prices vary across countries. In most countries
evidence supports the existence of forward-looking behaviour in bargaining, and
wages depend on expected future inflation. Although there are differences between
labour markets, these can be justified on statistical grounds, as Barrell and Dury
(2000) show, and there is little difference between the reactions of a world where all
References
Allsopp, C., G. Davies, W. McKibbin and D. Vines (1997), “Monetary and Fiscal Stabilization of Demand Shocks Within Europe”, Review of International
Economics, Special Supplement, pp. 55-76.
Artis, M. and M. Buti (2000), “ ‘Close to Balance or in Surplus’ – A Policy Maker’s Guide to the Implementation of the Stability and Growth Pact”, Journal of
Common Market Studies, Vol. 38, No. 4, pp. 563-592.
Barrell, R., K. Dury and I. Hurst (2002), “International Monetary Policy Coordination: An Evaluation Using a Large Econometric Model”, Economic
Modelling, forthcoming.
Barrell, R. and K. Dury (2000), “Asymmetric labour markets in a converging Europe: Do differences matter?”, paper presented at CEPII fifth framework conference, Paris, September and at the European Economic Association meetings, Lausanne, Switzerland August 2001. ENEPRI Discussion Paper.
Barrell, R., K. Dury, I. Hurst and N. Pain (2001), “Modelling the World Economy: The NIESR model NIGEM”, paper presented at an ENEPRI workshop, Paris, July.
Barrell, R., K. Dury and D. Holland (2001), “Macro-Models and the Medium Term: The NIESR experience with NiGEM”, paper presented at the EU/ULB/AEA conference, Brussels, July.
Barrell R. and K. Dury (2001), “The Stability and Growth Pact, will it ever be breached? An analysis using stochastic simulations”, in Brunila, A., M. Buti and D. Franco (eds.), The Stability and Growth Pact: The Architecture of
Fiscal Policy in EMU, Palgrave.
Barrell, R. and N. Pain (2002), “Macroeconomic management in the EU”, in Brewer, T. and G. Boyd (eds.), Globalizing Europe, Edward Elgar.
Barrell, R. and A. Pina (2002), “How Important are Automatic Stabilisers in Europe? A Stochastic Simulation Assessment”, NIESR Discussion Paper No. 196.
Bayoumi, T. and B. Eichengreen (1995), “Restraining Yourself: The Implications of Fiscal Rules for Economic Stabilization”, IMF Staff Papers, Vol. 42, No. 1, pp. 32-48.
Blanchard, O.E. (2000), “Commentary”, Economic Policy Review, Federal Reserve Bank of New York, April, pp. 69-74.
Buti, M. and B. Martinot (2000), “Open Issues in the Implementation of the Stability and Growth Pact”, National Institute Economic Review, November.
Buti, M., D. Franco and H. Ongena (1998), “Fiscal Discipline and Flexibility in EMU: the Implementation of the Stability and Growth Pact”, Oxford Review of
Economic Policy, Vol. 14, No. 3, pp. 81-97.
Buti, M. and A. Sapir, eds. (1998), Economic Policy in EMU - A Study by the
European Commission Services, Oxford University Press.
Dury, K. and A. Pina (2000), “Fiscal Policy in EMU: Simulating the Operation of the Stability Pact”, EUI Discussion Paper ECO 2000/3.
Eichengreen, B. (1997), “Saving Europe’s Automatic Stabilizers”, National Institute
Economic Review, No. 159, pp. 92-98.
Eichengreen, B. and C. Wyplosz (1998), “The Stability Pact: More Than a Minor Nuisance?”, Economic Policy, Vol. 26, pp. 65-114.
European Commission (1997), Economic Policy in EMU. Part B: Specific Topics,
Economic Papers, No. 125, Directorate General II.
Giorno, C., P. Richardson, D. Roseveare and P. van den Noord (1995), “Potential Output, Output Gaps and Structural Budget Balances”, OECD Economic
Studies, No. 24, pp. 167-209.
Melitz, J. (1997), “Some Cross-Country Evidence about Debt, Deficits and the Behaviour of Monetary and Fiscal Authorities”, CEPR Discussion Paper no. 1653.