i
M
ASTER OF
S
CIENCE IN
FINANCE
M
ASTER
´
S
F
INAL
W
ORK
PROJECT
EQUITY
RESEARCH:
A
RSENAL
H
OLDINGS
PLC
A
NDRÉ
F
ILIPE
L
EITÃO
S
ALVADO
ii
M
ASTER OF
S
CIENCE IN
FINANCE
M
ASTER
´
S
F
INAL
W
ORK
PROJECT
EQUITY
RESEARCH:
A
RSENAL
H
OLDINGS
PLC
A
NDRÉ
F
ILIPE
L
EITÃO
S
ALVADO
S
UPERVISOR
:
ANTÓNIO CARLOS DE OLIVEIRA SAMAGAIO
I
Abstract
This project was written in accordance with the CFA Institute guideline recommendations as well as the ISEG´s master’s in finance final work project standards. A detailed analysis of Arsenal Holdings PLC was done. The analyzed company was selected by me based on his recent acquisition by Kroenke Sports & Entertainment UK Inc, looking a good starting point for a challenging valuation on an interesting industry with some attractive acquisitions over the years. Arsenal Holdings Limited is the holding of an English football club, Arsenal F.C that competes for top football trophies. The purpose of this project is to issue a financial opinion about the acquisition value paid for the company by calculating a target price.
Through FCFF approach a final valuation of £1,840.52m was reached, meaning a discount of 0.6% in the acquisition value paid. The result was supported by a complementary relative valuation.
II
Resumo
Este projeto foi escrito de acordo com as recomendações de diretrizes do Instituto CFA, bem como as normas do projeto final de mestrado em finanças do ISEG. Foi feita uma análise detalhada do Arsenal Holdings PLC. A empresa analisada foi selecionada por mim com base na sua recente aquisição pela Kroenke Sports & Entertainment UK Inc, parecendo um bom ponto de partida para uma avaliação desafiante em um setor interessante com algumas aquisições atractivas ao longo dos anos. O Arsenal Holdings Limited é a holding de um clube de futebol inglês, o Arsenal F.C, que compete pelos principais troféus de futebol. O objetivo deste projeto é emitir uma opinião financeira sobre o valor de aquisição pago pela empresa, calculando um preço-alvo.
Através da abordagem FCFF, foi atingida uma avaliação final de £1,840.52m, significando um desconto de 0.6% no valor de aquisição pago. O resultado foi apoiado por uma avaliação relativa complementar.
III
Acknowledgements
One of the most challenging and grateful journeys of my life is about to coming to an end. A five years journey at ISEG, with a first degree in management and a master’s degree in Finance in the pocket but also lots of knowledge, teachings, personal skills and friendships that I will keep along all my life.
I would like to say thank you to my parents for the opportunity that they gave me to study in one of the most incredible universities and to had believed in me. A special word to my brother and girlfriend who have stayed by my side during all my journey.
IV
Index
ABSTRACT
I
RESUMO
II
ACKNOWLEDGEMENTS
III
INDEX
IV
LIST OF FIGURES
V
LIST OF TABLES
VI
1. RESEARCH SNAPSHOT
1
2. BUSINESS DESCRIPTION
2
3. MANAGEMENT & GOVERNANCE
3
4.INDUSTRY OVERVIEW AND COMPETITIVE POSITIONING
4
5. INVESTMENT SUMMARY
9
6. VALUATION
10
7. FINANCIAL ANALYSIS
12
8. INVESTMENT RISKS
14
APPENDICES
17
ABBREVIATIONS
31
REFERENCES
32
V
List of Figures
Figure 1: AFC share holders
1
Figure 2: AFC historical revenues
1
Figure 3: AFC chests
2
Figure 4: AFC board strategy
3
Figure 5: AFC FY18 Revenues
3
Figure 6: UK vs EU - GDP
4
Figure 7: AFC Revenues growth vs UK GDP growth
4
Figure 8: Porter’s Five Forces
4
Figure 9: Market share of leading Kit Manufactures
5
Figure 10: European Sponsors overview
5
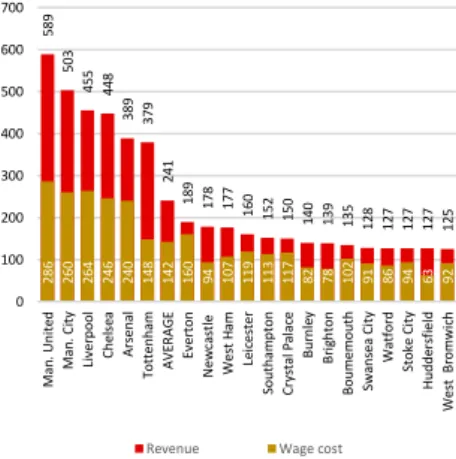
Figure 11: Big Five European league clubs ‘revenue and wage cost
5
Figure 12: Top 5 leagues overview
6
Figure 13: PL clubs ‘revenues
6
Figure 14: PL clubs ‘revenues and wage costs
6
Figure 15: Segmentation of European football revenues
7
Figure 16: FIFA associations
7
Figure 17: Top10 Revenue segmentation
8
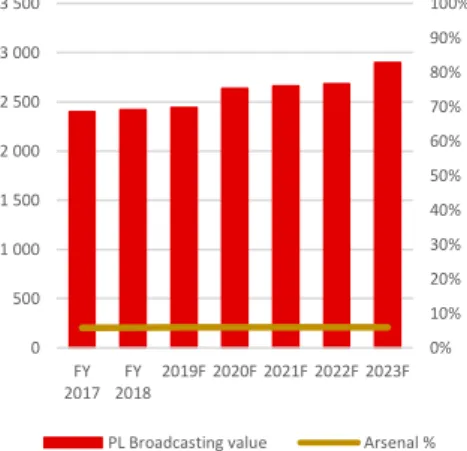
Figure 18: AFC PL broadcasting revenues
10
Figure 19: AFC UEFA broadcasting revenues
10
Figure 20: Gross PPE vs Acc. Dep.
11
Figure 21: AFC Revenue & Staff costs correlation
12
Figure 22: AFC EBIT vs EBITPT
13
VI
List of Tables
Table 1: AFC Market Profile ... 1
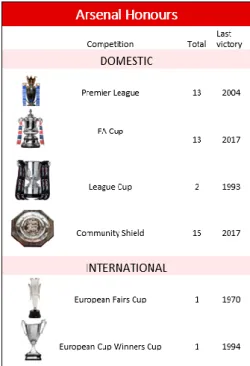
Table 2: AFC honours ... 3
Table 3: UEFA Club coefficient Top 10 ... 7
Table 4: KPMG EV Top 10 ... 8
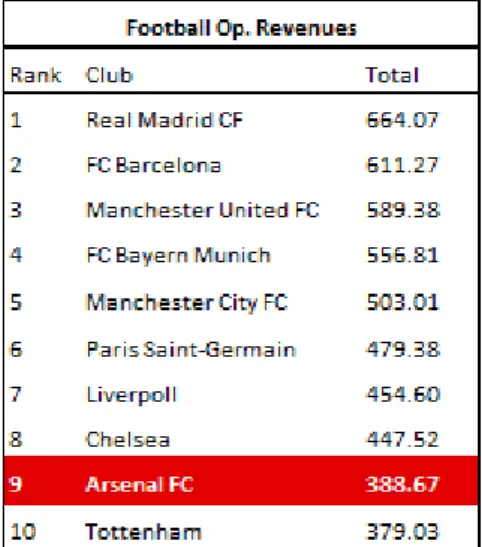
Table 5: Clubs ‘Operating Revenues Top10 ... 8
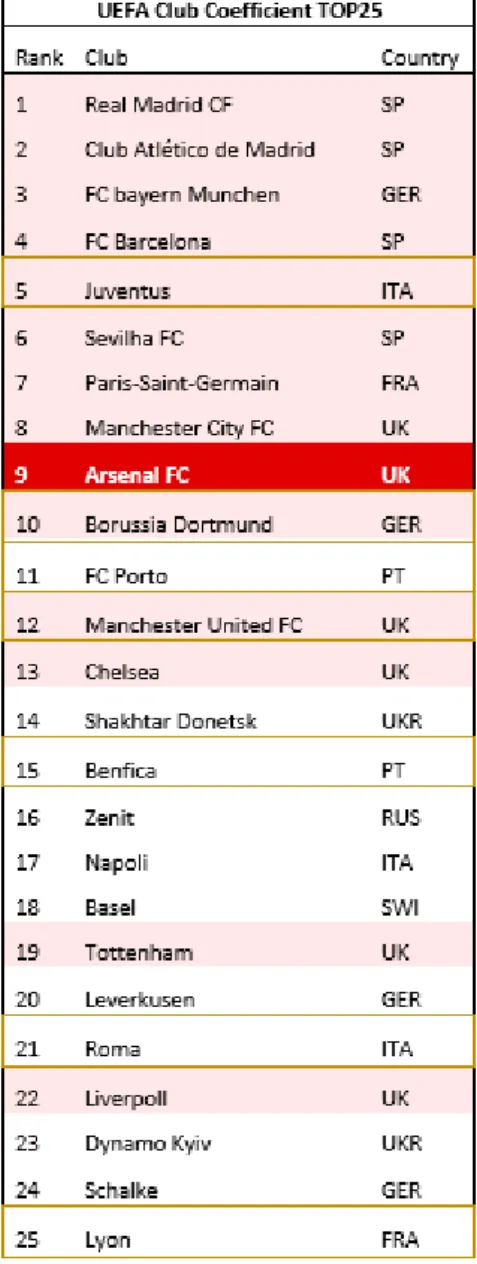
Table 6: UEFA Club coefficient top 25 & listed clubs ... 9
Table 7: AFC Sponsor deals ... 10
Table 8: DCF Analysis... 11
Table 9: EV/EBITDA Multiple valuation... 12
Table 10: AFC Liquidity ratios ... 13
Table 11: AFC Profitability ratios ... 13
Table 12: sensitivity analysis 1 ... 16
Table 13: sensitivity analysis 2 ... 16
1
67%30% 3%
Kroenke Sports & Entertainment Red and White Securities Others 0 50 100 150 200 250 FY 2014 FY 2015 FY 2016 FY 2017 FY 2018 Broadcasting Commercial & Retail
Figure 1: AFC share holders
Figure 2: AFC historical revenues Source: AFC & AS computation
Source: AFC & AS computation
Source: AFC & AS computation Table 1: AFC Market Profile
1. Research Snapshot
Arsenal Holdings PLC was totally acquired by Kroenke Sports & Entertainment for £29,419.64 and according to my valuation this price was paid with a
discount of 0.6% since my target price was £29,582.24.
Arsenal Holdings PLC, with the AFC ticker symbol, was publicity listed at NEX Exchange Growth Market, but on 5 October 2018 the company was re-registered as a private company as all the shares were acquired by Kroenke Sports & Entertainment UK Inc (KSE UK Inc). KSE UK Inc already held 41,743 AFC shares, which represents 67.09% of the 62,217 issued shares. For each of the remaining AFC shares, a value of £29,419.64 in cash was paid. AFC operates in the Consumer Discretionary Sector, Recreation Facilities Industry most precisely at Entertainment Facilities sub-industry, which includes the football segment. Arsenal shares showed very low liquidity as just 56 shares were traded during the six months prior KSE UK Inc offer, which could be the result of the poor floating rate with just 1,779 shares outstanding when subtracting the amount detained by KSE UK Inc and Red and White Securities, Alisher Usmanov's company (Table 1; Figure 1).
Perfect Geographic Location- Although Arsenal have not been able to win titles
through last seasons, revenues continued to rise mainly due to broadcasting rights from top tier English league and European tournaments, with a historical average YoY increase of 10.51% since 2014 till 2018. Commercial Revenues with a historical average YoY of 8.50% during the same timeline demonstrate the globalization of the club with an increasing number of fans worldwide. (Figure 2)
Infrastructures vs Debt- Investment in infrastructures were done by Arsenal,
currently owning Emirates stadium, a redeveloped training center and a developed youth academy. No more investments are expected in sports facilities. The debt contracted were the result of the stadium financing, so the tendency is to reduce the debt as no other extraordinary investment is needed.
Date: 6/08/2018 Acquisition Price: £29,419.64 Observation: Acquisition price 0.6% below target price
Ticker: AFC PZ Target Price: £29,582.24
0,00 5 000,00 10 000,00 15 000,00 20 000,00 25 000,00 30 000,00 35 000,00 40 000,00 06/08/2015 06/08/2016 06/08/2017 06/08/2018
2
Figure 3: AFC chestsSource: AFC & AS computation
2. Business Description
Arsenal Holdings Limited is a London based group, being the main activity competing in professional football competitions, both at domestic and European level, represented by The Arsenal Football Club PLC, a subsidiary company. Arsenal Holdings Limited has 100% control of nineteen subsidiary companies, directly or indirectly, operating in the football industry ramifications or in the property development area due to the stadium construction (Appendix 12). The club was founded in 1886 by a group of Woolwich Arsenal Armament Factory workers, which later would become the actual Arsenal Football Club. The club had different chests and official names, staying in the historical records Dial Square, Woolwich Arsenal and finally in 1915 Arsenal FC, remaining till today (Figure 3). The first game of the club was played in the late 1886 however the first official trophies were won in 1930, with a double mark, winning his first FA Cup and English league. At this moment the club has an enviable honours history with 45 trophies within which can be highlighted the record of fourteen FA Cup trophies, the largest number between all the English clubs (Table 2).
Strategy
The Arsenal Football Club board has an ambitious objective for the club future, be one of the best and must recognized clubs worldwide. To do that, the board members have created a long-term self-sustained business strategy, composed by four phases being win trophies the key objective. The pitch success leads to an uplift of the fan base, increasing the revenues which in turn are reinvested on the Principal Team in order to continuously follow the glory inside the field, ultimately translated in trophies (Figure 4)
Financial and Non-Financial Key Performance Indicators
Last season was full of nothing for Arsenal Team
The performance on the field is the first one to look at. On the previous season the performance was not the desired, with no trophy and a sixth-place in the Premier League (PL), which just gave access to participate on UEFA Europe League (UCL) instead of the UEFA Champions League (UCL), finishing the long journey of successive qualifications for this competition between 1998/99 and 2016/17 performing a total of nineteen, which is the English record. The best in terms of sportive performance was reach the UEL semi-final, just beaten by the tournament winner, Atlético Madrid.
Premier League and UEFA presence are essential to achieve success
Arsenal has the possibility to play in the PL and UEFA competitions due to his location, which are the most recognized football clubs’ competitions, depending of on-pitch success. The huge visibility of these competitions leads to high broadcasting payments, which have contributed with 47% of Arsenal operating revenues (Figure5).
Arsenal popularity as a global brand
Arsenal popularity can be evaluated by looking to match attendance ratio translated in matchday revenue, social media followers and ultimately commercial deals. With a total of 60,260 seats, the Emirates stadium had an annual average attendance of 99% on each of the last three seasons accounting with 25% of operating Revenue (Figure 5). Social media is a new tool to reach additional fans or to create a more personal relationship with the actual supporters, and Arsenal is using these modern instruments very well, being one of the fifteen clubs with greatest number of followers on the principal’s social media. The club has the incredible number of 38m, 10m and 9.6m followers on Facebook, Twitter and Instagram respectively, with the major part of the followers
3
47%27% 25%
Broadcasting Commercial & Retail Matchday
Table 2: AFC honours
Source: AFC; TransferMarkt & AS computation
Figure 4: AFC board strategy
Source: AFC
Figure 5: AFC FY18 Revenues
Source: AFC & AS computation
based in Asia, mainly driven by the supporters of Indonesia. World class players can boost the popularity of the club, by attracting new fans that follow the player career. Mesut Özil with 31m, 24m and 18m followers is the Arsenal player with most followers, showing the importance of having top players, not just to improve the results inside the pitch but also outside it. As a worldwide brand, Arsenal recognition is an incentive for sponsors to be affiliated with the club, which can be seen by the new contract with Adidas as kit manufacture sponsor, starting in 2019/20 season for a period of five years, with the club receiving a total of £300m, the Fly Emirates partnership renewal with the value of £200m for shirt sponsorship, or even the “Visit Rwanda” sleeve sponsor three years contract with the value of £30m, starting in 2018/19 (Table 7). Commercial revenues were responsible for 28% of total operating Revenues (Figure 5).
Acquisition and retention of Key Players
Transfer fees and wage cost are the way to get a competitive team for fighting to win football trophies. Arsenal have made an effort and the additional transfer value of £165.8m in 2017/18 was the result of the acquisition of players like Alexandre Lacazette and Pierre Emerick Aubameyang, breaking twice the club record in transfers fees, with the amounts of £57.38m and £47.70m (Appendix 7). These two players as well as Mesut Özil three-and-a-half-year contract renovation have contributed to an increase on the payroll costs of 11.8%. Staff costs to operating revenue was 62%. and staff costs to operating costs was 50% Although the wage cost of the club had increased 20% last season, from £199.4m in 2017 to £240.06m in 2018, or 12% if excluding exceptional, which is one of the main contributors of the Group expenses, the Profit after tax increased to £56.5milion in 2017/2018 season comparing to £35.3m on the previous season.
3. Management & Governance
Board Structure and members
The board of directors is composed by five directors instead of six, after the resignation of I.E Gazidis on October 31, 2018. The directors need to be re-elected after serving the club on the Board during a period of three years, being the members in functions: Sir Chips Keswick, Ken Friar OBE, Lord Harris of Peckham, Stan Kroenke and his son Josh Kroenke. The board members must decide the long-term strategy and objectives of the Club and also analyze the Group performance, helped by financial statements. Arsenal is based in UK and so is subject to internal laws for companies, done by the Parliament of the United Kingdom, in this case the Companies Act 2006, the main basis of company law in UK.
Sir Chips Keswick was elected Arsenal Holdings Limited’s Chairman in June 2013, continuing the journey started in November 2005 as an Arsenal director. He had a prestigious career as banker for over 50 years, accumulating an impressive number of director positions such as Chairman of Hambros Bank 1986-1998 and Bank of England 1993-2001.
Mr. Ken Friar OBE has been with Arsenal for 60 years and presently is one of the 5 Directors, the one with the longest career at the Club, having done almost every job.
Lord Harris of Peckham was selected to be part of the Arsenal board as Director in November 2005. He was a young entrepreneur linked with the carpet retail. Nowadays support a charity projects and activities to helping the development of young kids.
Stan Kroenke has started is connection with Arsenal in 2007. Since April 2008 he is board director, obtaining a majority equity position in 2011. He is owner of Arsenal since is the holder of Kroenke Sports & Entertainment UK INC. His company owns clubs in different sports such as the Denver Nuggets of National
4
0,00% 0,50% 1,00% 1,50% 2,00% 2,50% 3,00% 3,50% 4,00%United Kingdom Euro area Source: IMF & AS computation
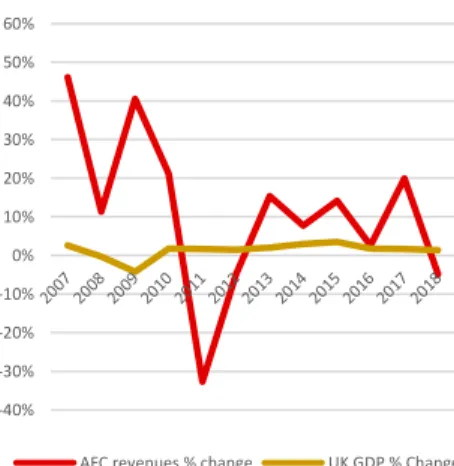
Figure 7: AFC Revenues growth vs UK GDP growth -40% -30% -20% -10% 0% 10% 20% 30% 40% 50% 60%
AFC revenues % change UK GDP % Change
Source: IMF, AFC & AS computation
Figure 8: Porter’s Five Forces
Source: AS computation Figure 6: UK vs EU - GDP
Basketball Association, Los Angeles Rams of National Football League, Colorado Rapids of Major League Soccer and Colorado Avalanche of National Hockey League.
Josh Kroenke is Director of Arsenal Football Club board, where he has joined in December 2013. He is Stan Kroenke son and has a close relationship with all the Kroenke Sports & Entertainment UK INC sports clubs, being the Denver Nuggets and Colorado Avalanche president.
Sustainability and Social Responsibility
Arsenal’s sustainability strategy is focused in four key areas to achieve an ongoing environmental enhancement, having done projects and upgrades in all of them: Energy Consumption including the replacement of floodlight and petrol pitch mowers to LED floodlight (reducing in 30% the consumption) and to electrical pitch mowers; Waste Management & Disposal including the supervision of the suppliers in order to reduce the environmental impact due to their products or transportation, intention to use recycled materials and procedure to waste separation on gamedays; Water Consumption including the implementation of new system at training ground to recycle irrigation water; Travel by reducing their impact on the environment, by suppling the staff with cycling facilities. All these policies and operations are evaluated by an Environmental Management System (EMS)
4.Industry Overview and Competitive
Positioning
United Kingdom Economic Outlook
In the aftermath of an eminent exit of the European Union, UK has been on negotiations to have an orderly exit. All the political uncertainty around this process leads to a real GDP growth projection of 1.1% in 2019 before rising slightly to 1.6% in 2020 (Figure 6). Through the last three decades London has consistently outperformed in terms of economic growth when compared with the other regions of UK and this tendency seems to continue in the future with 1,2% and 1.8% growth projections to 2019 and 2020. A disorderly ‘no deal’ Brexit could lead to a significantly less favorable outcome for growth forecasts.
PESTEL analysis of the Industry
Political factors: European governments can affect the club's financial results
thought tax law at Foreign and Domestic income, including tax residence topics. With a favorable tax law, clubs can offer a bigger wage when compared to clubs based in other countries, which can be seen as an advantage to attract new key players. UK decision to leave EU has led the value of pound weakness against Euro, which leads to higher fees for player transfers from EU but also, on the other, increasing the sterling value of European competition distributions paid out to clubs by UEFA in Euros.
Economic factors: As we can observe from the financial crisis data (2007-08),
(Figure 7) the key drivers of profitability did not suffer any decrease, indicating that the industry is non-cyclical with an inelastic price demand curve, even with negative UK GDP. However, there are some cautions to be taken because a downturn of the economy in the future could be followed by an expenditure cut of some industries that are interconnected with football industry, leading to a decline in the revenues of football companies.
Socio-cultural factors: European football is more diverse than ever, with UEFA
5
18% 16% 10% 9% 7% 40%Nike Adidas Joma
Macron Puma Other
Source: UEFA Club licensing benchmarking report & AS computation
Figure 10: European Sponsors overview
Source: UEFA Club licensing benchmarking report
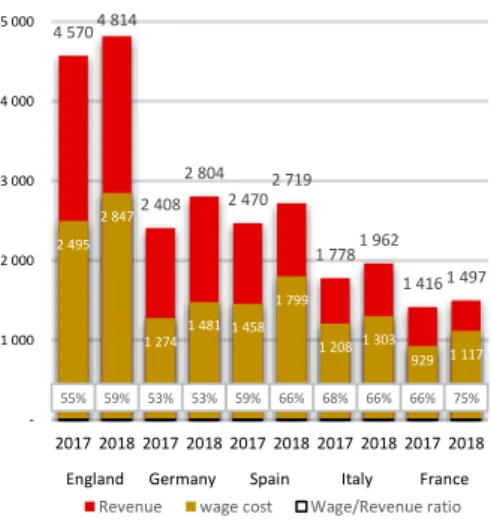
Figure 11: Big Five European league clubs ‘revenue and wage cost
4 5704 814 2 408 2 804 2 470 2 719 1 7781 962 1 416 1 497 2 495 2 847 1 2741 481 1 458 1 799 1 208 1 303 929 1 117 55% 59% 53% 53% 59% 66% 68% 66% 66% 75% 1 000 2 000 3 000 4 000 5 000 2017 2018 2017 2018 2017 2018 2017 2018 2017 2018 England Germany Spain Italy France
Revenue wage cost Wage/Revenue ratio
Source: Deloitte Football Report & AS computation
Figure 9: Market share of leading Kit
Manufactures are actively participating in campaigns related to society problems. Promoting
equality where all people can participate are some of the ideas behind the recent UEFA "no to racism" campaign. Also, the latest agreement between Stonewall and The Premier League to defend and promote LGBT inclusion not only in football but into the society. Football is an industry which protects and defends diversity and inclusion across all different ethics, genders, ages, orientations, abilities or social backgrounds.
Technological factors: Technological factors enhance football as sport due to
all the new devices used during the match, like VAR (video assistant referee) or goal-line, helping to construct a fair game to all the fans but also improving players performance due to EPTS (Electronic performance and Tracking Systems). Technology is more important than ever for the clubs because they can construct a permanent relationship with supporters, improving financial results. Social media platforms or official websites of the clubs can provide an excellent chance to not only secure their existing fans, but also attract potential ones. Top 15 clubs have an aggregate of 169m, 638m and 272m followers on
Twitter, Facebook and Instagram with Real Madrid in 1th.
Environmental factors: Although environmental factors are not an alerting topic
for the industry, football clubs are using their power to alert supports for the Climate changes, promoting some campaigns as a form of sensibilization. Some clubs like Arsenal has developed a commitment towards environmental responsibility.
Legal factors: The main body of European football has created Financial Fair
Play in 2009 to bring responsibility, rationality and transparency to club's financial management. Since 2009, this regulation has helped to reduce to less than 20% overdue debts and losses of the European clubs. The environment created encourages and attracts investors to look for this industry as it is increasingly financial attractive.
SWOT analysis
Strength: Football is the most famous sport in Europe, fascinating fans from all
around the countries to see the best players who are enticed by the best championships, played in Europe. Football visibility is a strength of the Industry since attract sponsors from all over the world. High barriers to entry into the industry due to league rules ally with supporter’s loyalty permit top clubs to continue increasing their name as a global Brand.
Weaknesses: To have the best players and staff, clubs incurred in elevated
wage costs with wage to revenues ratios of 55% between PL clubs in 2017, or 59% among clubs in the Spanish first division (Figure 11). Although the ratio has decreased in 2017 when compared with the previous years, the total amount spends in wages increased in 18 of 20 best European Leagues.
Opportunities: The power of the new technologies can be used by football
clubs, turning the supporters addicted to the club by doing a
continuous marketing forcing on the social media, creating a more personal relationship with fans which can permit an increase of the fan base as well as commercial revenues. Economies of scale, which did not appear to be possible in the football industry, is a reality due to the multi-club model, already used by Red Bull who owns clubs in Austria, Germany, United States and Brazil. This model can be very successful due to the possibility of a worldwide expansion, diversifying the markets, creating a super structure to scout young players and switching them across all the owned clubs.
Threats: The impediment of participate in the most recognized and lucrative
competitions due to relegation is a real threat between top-tier clubs, which could block them to contract top players because they want to play in top leagues with most visibility, to close sponsor contracts or nice broadcast agreements, which
6
61% 59% 31% 39% 52% 52% 60% 58% 50% 47% 26% 27% 51% 44% 29% 31% 30% 30% 39% 42% 14% 14% 18% 17% 19% 17% 10% 12% 11% 11% 4 5664 814 2 408 2 804 2 4602 719 1 7891 962 1 4161 497 0 1 000 2 000 3 000 4 000 5 000 6 000 2017 2018 2017 2018 2017 2018 2017 2018 2017 2018England Germany Spain Italy France
Broadcasting Sponsorship/Commercial Matchday Source: Deloitte Football Report & AS computation 53% 53% 61% 59% 59% 58% 29% 30% 26% 27% 28% 28% 17% 17% 14% 14% 13% 14% 3 350 3 639 4 552 4 819 5 050 5 240 0 1 000 2 000 3 000 4 000 5 000 6 000 2015 2016 2017 2018 2019F 2020F Broadcasting Sponsorship/Commercial Matchday
Figure 13: PL clubs ‘revenues
Source: Deloitte Football Report & AS computation 589 503 455 448 389 379 241 189 178 177 160 152 150 140 139 135 128 127 127 127 125 286 260 264 246 240 148 142 160 94 107 119 113 117 82 78 102 91 86 94 63 92 0 100 200 300 400 500 600 700 Man . Uni te d Man . C ity Li ver po o l C hel se a A rs enal To tt enha m A V ER A G E Ever to n N ew cas tl e W es t H am Le ic es ter So uth am pto n C rys ta l P al ac e B ur nl ey B ri ghto n B o um em o uth Swa ns ea C ity W at fo rd Sto ke C ity H udd er sf iel d W es t B ro m wi ch
Revenue Wage cost
Figure 14: PL clubs ‘revenues and wage costs
Source: Deloitte Football Report & AS computation
Figure 12: Top 5 leagues overview
could lead the club to a critical financial situation. The development of Chinese championship, ranked as the eighth country with highest transfer expenditures and also the highest outside Europe, could affect the future of European football if clubs would not be able to secure the best players due to salaries or visibility, affecting all the revenues sources. The replacement of football as top European sport is a possibility in the future which could drastically decrease the visibility of the clubs.
The “Porter’s Five Forces”
Bargaining power of Customers - Very Low
Consumer behavior are very special in the football industry due to loyalty. Supporters choose one team and never change for another rival/competitor. Bargain power of consumers are very low since demand does not decrease with higher prices (price sensitivity), meaning the existence of an inelastic curve of demand. During 2007 crisis the clubs continued to increase financial results. According to 2008 and 2009 Arsenal reports, the club reached two consecutive records of annual retained profit levels.
Threat of new Entrants - Low
In 2016/17 season 727 clubs were competed in men’s national championships in Europe. There are no barriers for new competitors in football industry, but the clubs have to start from the bottom division and there are a lot of competition to achieve the best league of each country, which can give access to international competitions, with better prizes and recognition. It is not easy to achieve top-tier competitions due to the rules of each country leagues. The only way to clubs enters into the market, top-tier leagues, is to be promoted, and the clubs participating in top-tier leagues are aware of the potential promoted clubs.
Threat of Substitute Products - Low
Football is a live entertainment like theater or others live sports, but fans do not prescind to see their football team, for them the final product of the industry, the intangible product “football game” cannot be compared with other kinds of entertainments. Football is the most followed sport in Europe, and now with the increase of interest from new regions around the world, like North America and mainly Asia, the football will continue to raise levels, increasing the revenues of the industry. The unique Threat is the football himself, with China or American championships valorization in the recent years, one day could fascinate more attention all around the world, attracting the world best players to play there, which could affect the European football, but in the near future these scenario does not seem to be a real problem.
Bargaining power of Suppliers - Median
There are different types of sponsorships across the football industry. Kit manufacture and shirt sponsors are the most popular thought the European clubs, with all the clubs having manufacturer deals and 88% shirt sponsor across the 16 biggest European leagues during 2017/18 season (Figure 10). The 30 major clubs have as average of kit manufacture and shirt sponsor deal duration of 7.9 and 4.4 years respectively. There are 62 different kit manufactures in the industry with the two main suppliers sharing 34% of all market (Figure 9). Just 13% of the clubs changed their kit manufacturer for the 2017/18 season however a higher number of clubs have changed the shirt sponsor, 22% or 25% if clubs without sponsor were excluded.
In addition, sleeve sponsor and stadium naming start to become an important source of income also, with 56% and 26% across 16 top European leagues with closed contracts (Figure10).
It does not seem to be difficult for clubs change sponsor or supplier when the contract finish. However, the amount involved in the contracts is a huge part of club's total revenues which gives some power to suppliers.
7
Figure 16: FIFA associations22% 21% 21% 20% 20% 21% 25% 26% 26% 27% 13% 13% 13% 14% 13% 12% 12% 12% 14% 14% 13% 13% 13% 13% 13% 14% 14% 14% 15% 14% 12% 13% 12% 12% 12% 12% 11% 11% 11% 11% 9% 9% 8% 9% 8% 9% 9% 8% 8% 8% 31% 31% 33% 32% 34% 32% 29% 29% 26% 26% 11 35111 718 12 77413 186 14 06615 006 15 87916 873 18 469 20 112 0 5 000 10 000 15 000 20 000 2008 2009 2010 2011 2012 2013 2014 2015 2016 2017
England Spain Germany Italy France Others Figure 15:Segmentation of European football revenues
Source: UEFA Club licensing benchmarking report & AS computation
Source: FIFA & AS computation
Source: UEFA & AS computation Table 3: UEFA Club coefficient Top 10
Competition within the industry - median low
Customers loyalty, with high emotional switching costs, seems to be an impediment for clubs to steal supporters from the other clubs, which decrease the competitiveness between them. However, results on the field are a key factor for the financial results of the club, meaning that every club wants to win, increasing the competition. However, no one wants to see a monopoly league, where the winner is known at the beginning of the season which would turn the league disinteresting to follow or invest. So, competition is beneficial for the clubs, leading to an increase of popularity which would be translated in higher revenues.
Key Drivers of Profitability
Football industry has three main sources of revenue leading clubs to successful results throw the years, to know: Broadcasting, Sponsors & Commercial and Matchday Revenues. Broadcasting rights are negotiated by the responsible bodies for organize the competition, UEFA for international competition like UEFA Champions league, Europa League and the UEFA Super Cup, and the domestic broadcasting rights are negotiated differently in each country. In UK, PL broadcasting rights are negotiated by the PL and half of the total value is equally distributed among all the participating clubs, the remaining 50% is divided in two parts, 25% for each one: “Facility Fees” based on the frequency of club games broadcasted during the season in the UK; "Merit Payments", based on the final classification of each club in the PL table. PL International broadcasting rights are equally distributed by all the participating clubs. Sponsors & Commercial Revenue are dependent on the club historical performance, global followers and brand power. Sponsors are interested to close agreements with top clubs that share the same values and that could add them value. These revenues are mainly supported by sponsorship deals through kit manufacturer, shirt sponsor, sleeve sponsor and more recently stadium naming rights. Matchday Revenues are translated in the ability of the clubs to generate revenue from the football game itself which can include the ticket sales and hospitality sales that are dependent on the stadium size, which can limit the stadium attendance. In the other hand the major part of expenses is due to staff costs, mainly paid to key players of the teams. Staff costs can include variables payments related to performance, with bonuses for specific achievements or cuts to poor results.
European key drivers outlook
Cumulative revenues between European clubs showed an increase of 8,47%
CAGR, an overall increase of 38% since 2013/14 till 2017/18 with ‘Big five’
European leagues sharing 55% of European Revenues last season (Figure 15).
In 2017/18 season the revenues across the ‘Big five’ European leagues clubs
were driven by domestic broadcasting rights with an average of 51%, sponsorship & commercial with 35% and gate receipts with 14% (Figure 12). All ‘Big five’ European leagues increased the cumulative revenue, 9.1% YoY, as well as the wage costs, 16.1% YoY, as a result the wage to revenue ratio increased to an average 62%, meaning that the wage cost growth outpaced revenue growth. PL continues to lead the rank as the one with highest Revenues as well
as Wage costs but with the 2th lowest wage to revenue ratio of 59%.
Premier League key drivers outlook
During 2017/18 the average revenue of £241m was reached among PL clubs, demonstrating the continually uptrend of the revenues with an increase of 5.7% YoY, or 48% when compared to 2013/14. Broadcasting represents 59% of total revenues with the ratio between the highest and lowest PL broadcast payment of 1.59, between Manchester United and West Bromwich Albion, which is a good measure to improve the competitivity (Figure 14). Commercial revenues
8
33% 32% 35% 28% 42% 24% 49% 46% 47% 53% 47% 47% 47% 55% 47% 58% 33% 38% 27% 27% 19% 21% 18% 16% 11% 19% 18% 16% 25% 20% 664 611 589 557 503 479 455 448 389 379 0 100 200 300 400 500 600 700Broadcast Commercial Matchday
Figure 17: Top10 Revenue segmentation
Source: Deloitte Football Report & AS computation
Source: KPMG Football Benchmark & AS computation
Table 4: KPMG EV Top 10
Table 5: Clubs ‘Operating Revenues Top10
Source: Deloitte Football Report & AS computation
represented 27% of total revenue with an increase of 11.7% YoY, where all the clubs were able to close kit manufacturer, shirt sponsor and sleeve agreements. Matchday revenue is the lowest one among PL clubs despite existing more people going to the stadium. UK clubs dropped the away ticket prices due to PL cap of £30 on away fan ticket, to get prices more accessible to everyone. Match attendances grew 7% in 2017/18 season to a total of 14.6m, an average matchday attendance of 38,500 and 96% of stadium utilization, with the revenue increasing 8%. Total wage costs of PL clubs increased 14.11% to £2,846.9m, representing an average of £142m, leading the wage to revenue ratio to 59% which is lower than UEFA limit recommendation of 70% but higher than the previous season.
Whilst the PL’s central distribution mechanism remains the most equal amongst the ‘big five’ leagues, there remains a significant revenue variance between groups of clubs within the league. The ‘big six’ clubs generated an average of £415m each in 2016/17, compared to just £147m across the rest of the clubs.
Prospects for the future - UK clubs
The new cycle of the PL tv rights, starting in 2019/20 and for a period of 3 seasons, will record an uplift of 8% overall, with the 30% increase of international rights offsetting the decline in domestic rights. The new contract will continue to
guarantee the 1th position as the richest league in the short term. In 2018/19
starts a new cycle of UEFA broadcasting rights as well as the new qualifying rules based on the association coefficient ranking which puts 7 PL’ Teams on UEFA tournaments, 4 in the UEFA Champions League and 3 in UEFA Europe League, which will increase the overall revenue among PL teams. PL clubs’ revenue are expected to rise to £5.05b in 2018/19 and to £5.24b in 2019/20 (Figure13). By looking for the wage costs and the final league position it is possible to see a high correlation, with all the top 6 having the highest wage costs. Although this correlation will lead the clubs to spend more money in wage in order to have the best player to fight for the best final position, it is not expected to increase much above 60% the wage costs/revenue ratio, which is a good measure to see the profitability of the clubs. Sponsorship & Commercial agreements are the way to clubs differentiate in the future, as broadcast are relatively equal and matchday is restricted to stadium capacity, supported by on-pitch performance and trophies.
Organization of professional football
Football is a global game and the football industry can be analyzed as a worldwide industry. FIFA was the main responsible for the expansion of the football all over the world. This association was founded at the start of the 20th century, in 1904, with the principal objective of unify the laws of the football game to make it fair for all. Global football is organized into six confederations, which are recognized by FIFA, to know: AFConf, CAF, CONCACAF, CONMEBOL, OFC and UEFA, with all of them having affiliated associations as representative of FIFA in each country, performing a total of 211 associations. (Figure16) Professional football competitions can be divided into 3 different types: national team competitions, international club competitions and national club competitions.
Mix of 3 Ratings– Sportive Peer Group
Since Arsenal is a European football Club based in UK, can compete for UEFA International Club competitions named UEFA Champions League, the most recognized football tournament, or for UEFA Europa League, the second level of UEFA International club competitions. Can also compete for UK competitions as Premier League, FA Cup, League Cup or FA Community Shield. Peer group should be a bunch of companies operating in similar business activities, affected by the same factors. Arsenal should be compared with European Clubs, who are influenced by European GDP and UEFA payments.
9
Table 6: UEFA Club coefficient top 25 &listed clubs
Source: UEFA; Bloomberg & AS computation
UEFA has developed a European club ranking based on the results achieved on UEFA competitions during previous seasons. Top 10 at the begin of 2018/19 season and based on the last 5 seasons is disclosed in Table 3. KPMG has ranked the clubs according to EV based on different factors like profitability, popularity, sportive potential or stadium ownership.
According to KPMG and based on the data at the end of 2017/18 season, Manchester United, Liverpool FC, Chelsea as well as Tottenham deserve a place at top ten (Table 4). To support these rank, total operating revenue from football activities was investigated. Top10 according to this criterion was fully complete by clubs between the other two methods (Table 5). The final list of sportive peers was composed by fourteen clubs, the European top ones (Table 6). These clubs are trying to transform their business, a natural entertainment companies, into global brands, fighting not also for prestigious trophies but also to attract fans, customers and audiences on a worldwide level.
Domination of European Football
Champions League winner during last 10 seasons was 9 times one of these 14 clubs, the only exception was in 2009/10 when Inter managed by José Mourinho beat Bayern Munich by 2-0. At National championship level, the League title was won 75% times by these teams, with Juventus, Bayern and Barcelona conquering 7 in 10 possible (Appendix 4).
All these clubs have stadium, which is a very important assets for clubs, giving the possibility of generating higher levels of revenues by different sources rather than just by hosting the club football games. With a stadium ownership, clubs can host a lot of different events like NFL games or music concerts, sell the naming rights or even develop different and innovative features to incentive tourists and locals to visit the stadium. This will enable the clubs to generate additional revenues with the stadium even in a non-matchday.
Top 10 by revenues generated £5,073.75m in operating revenues in 2018, an average increase of 6.81% YoY, being that commercial and broadcast revenues are the ones with the highest percentage with 44% and 38% of the total amount, furthermore the average match attendance was over 57 thousands which generated the remaining 18% of operating revenue (Figure 17). Between these ten clubs, Real Madrid was the one with highest revenues, £664m. During 2017/18 season these clubs were responsible for almost 23% of the total operating revenue generated by European clubs, which was £25b.
5. Investment Summary
Based on the valuation methods performed, I consider that the price paid by KSE UK Inc of £29,419.64 per share was 0.6% below my target price, £29,582.24. Popularity uptrend of the football industry, followed by new broadcast contracts of EPL as well as UEFA competitions, new closed sponsorship contracts and the ingoing liquidation of the Stadium financing debt are some of the reasons that support my valuation.
To perform AFC target price at the acquisition date I computed the FCFF method, discounting the cash flows through WACC rate. Enterprise Value was calculated as a whole, because it is expected that just the football business unit will continue to have ingoing operations. In order to get an alternative valuation that could reinforce/confirm the main method, multiples valuation was also performed, with the results suggesting a higher valuation than DCF, with a target price of £32,801.51 per share. To select comparable companies, I decided to use UEFA club´s ranking, related to sporting performance, and Bloomberg terminal to get financial data.
10
Figure 18: AFC PL broadcasting revenues0% 10% 20% 30% 40% 50% 60% 70% 80% 90% 100% 0 500 1 000 1 500 2 000 2 500 3 000 3 500 FY 2017 FY 2018 2019F 2020F 2021F 2022F 2023F
PL Broadcasting value Arsenal %
Source: AFC & AS computation
0% 10% 20% 30% 40% 50% 60% 70% 80% 90% 100% 0 500 1 000 1 500 2 000 2 500 3 000 3 500
European Broadcasting value Arsenal %
Figure 19: AFC UEFA broadcasting revenues
Source: AFC & AS computation
Source: AFC & AS computation Table 7: AFC Sponsor deals
Football Industry has risks, and both clubs and investors should be prepared and aware for the possible impact that some external factors could have on the company sustainability. Some variables and assumptions of the discounted cash flow model were stressed in order to understand how they could affect the target price. The risks for the club were also analyzed.
6. Valuation
Two valuation methods were used based on different valuation approaches: relative valuation with comparable multiples and absolute valuation with Discounted Cash Flow by FCFF. Arsenal have not paid dividends and so DDM was not taken into consideration.
Absolute Valuation – DCF Method
To perform the DCF Method some assumptions were done regarding the components of the Financial Statements. The forecast was done for a time frame of five years and with a final Terminal Value, which accounts for the major part of the company valuation by assuming a perpetuity for the club operations.
Revenue: To forecast Arsenal revenues, I followed what Arsenal have done in
previous Income Statements reports, by splitting them into two business units: Football and Property Development. Football area is composed by four different sources of revenue while Property Development is related with real estate activities associated with the stadium construction.
Football business unit
Broadcasting: Total Broadcasting Revenues includes PL and UEFA revenues. PL Broadcasting Revenues were forecasted based on an average of last 4 years ratio of arsenal revenue for total PL distributions among the clubs. This payment value is based on factors explained before. The value of the total payment is already disclosed for 2019 (present broadcast cycle) but also for the new cycle which starts in 2020 and for a period of three years. In 2023 I applied an increase of 8% based on last cycle upgrade. An adjustment of 0.88% YoY was done during each year of the cycles to reflect variations of new deals agreements as seen during last cycle (Figure 18). UEFA payments follow the same rational of looking to past receipts as a percentage of the total payment distribution to clubs, but in this case depending on the competition: UCL or UEL. It is assumed that Arsenal will play in UCL in all the forecasted periods except for the next season (2018/19) where they couldn’t get a qualification. This assumption was done based on Arsenal historical European performance. The new broadcast cycle starts next season and the value of the total distribution is public. To forecast the new contract value, I used an average of the uplift observed on the renegotiation of the last two cycles (50.18%). An adjustment of 2.5% YoY during each cycle was done (Figure 19).
Commercial and Retail: Commercial and Retail Revenues are agglomerated as it was done in the last Arsenal official report (2018). Arsenal Sponsorship contracts will suffer an upgrade in 2019 due to an addition of sleeve sponsor, but mainly in 2020 with the end of some contracts and the value of the new ones. Adidas will substitute Puma and Emirates will increase the payment to be the shirt sponsor. All these changes were accounted, with the addition of the assumption that all the remaining revenues increase 1.2% YoY based on retail and some new small local agreements (Table 7).
Gate and Other Match Day Revenues: This portion of Revenues is dependent on the stadium capacity. Arsenal have a record of 99% occupancy rate during last 3 seasons and it is expected to continue. An average of the last 5years was done and used as forecast.
Player Trading: The value receipt with Arsenal players loans is a small part of total revenue (around 1%), and it is not used as a source to obtain revenues but as a way to control wage cost by loaning surplus players. The average of last five years was applied as future forecasts.
11
Source: AFC & AS computation0 100 200 300 400 500 600 700
Gross PPE Accumulated Depreciation
Figure 20: Gross PPE vs Acc. Dep.
Source: AFC & AS computation.
Table 8: DCF Analysis
Property Development Area
Due to the construction of the new stadium in 2007, Arsenal has been using the properties of the old stadium as a source of revenue. Nearly all the properties were sold with just one remaining as a stock. I assumed the same cost and profit margins as the ones observed on the last property sale, in 2018. After this sale, no more revenues will be recorded by this source as no more properties will be available.
Staff cost: Staff costs are the largest cost within the industry. Historical average
of Arsenal staff costs was equal to 53.7% of total revenues. This relationship was used as staff costs forecast.
Total depreciation, amortization and impairment: Depreciations are
applicated to tangible fixed assets, which include the Emirates Stadium and all the remaining PP&E. As AFC report does not disclose detailed information about each asset net value, I utilized accumulated depreciation to get the depreciation of the period. It was assumed that depreciation shall follow the same CAGR recorded in the last 5 years (8.95%), based on the “disinvestment” in installations. Amortizations affect intangible fixed assets, mainly composed by PR. The amortization of PR is a stable percentage of total cost of player registrations and so it was assumed the average of the last five years of 17.11% for the forecasted period. Goodwill is no longer amortized, and his value is assumed to not increase in the future. Impairment of player registrations are related to players who suffered a career threatening, which are quite uncommon. In the last five years it was recorded values in this rubric just twice, the average of these years was used as the forecast value (Figure 20).
Disposal and acquisition of player registrations: The relation between
acquisitions and disposal of PR was assumed to be 1.54 based on peers’ transfer activity of the last three years (Appendix 6). The acquisition of player registrations was defined as 33.69% of total revenue following the average of last 4 years without 2016, as it was considered an outlier. Transfers revenue was calculated through the money spent in transfer divided by the transfer multiple. The value of the sold players was assumed to be 83.77% liquidate according to last year records. Total transfers income can be found by subtracting the net value to total transfers revenue.
Cost of Capital – WACC Assumptions
Weight Average Cost of Capital was used as discount rate based on the after-tax requirement rates of return of debt and equity, having into consideration the capital structure.
Cost of Debt was calculated as the interest expense over the total debt for each
year. AFC used financial instruments to fix interest rate of future debt payments, ranging from 5.82% to 5.85%.
Cost of Equity follow CAPM based on some assumptions: Income Tax rate was
considered to be 19% in 2019F and 17% in the remaining years according to AFC forecasts; RFR (Risk Free Rate) was established as the 10Y bond from UK, which reflect the Brexit context; From Damodaran database it was assumed the values of CRP (Country Risk Premium) at 0.69% and the value of UK MRP (Market Risk Premium) at 6.65%. Arsenal stocks were thinly traded, so the Pure-Play beta Method was applied based on peer’s data from Bloomberg, and the final value of 0.241 was achieved for the unlevered beta (Appendix 8). The levered beta is calculated for each year by considering capital structure and tax rate differences.
Terminal Value Assumptions
AFC still shows high increases of revenues throw the years, with broadcast and commercial contracts reaching new highs every time that they are renegotiated, outperforming the economy pace. However, the mature phase of the industry, which include AFC and all the other peers, should be considered and so a conservative TV growth rate approach was applied by adjusting the theoretical TV growth rate of 2.89%, with a reduction of 100bps. (Appendix 8)
12
0 100 200 300 400 500 600 700 FY 2014 FY 2015 FY 2016 FY 2017 FY 2018 2019F2020F2021F2022F Revenue Staff CostsFigure 21: AFC Revenue & Staff costs correlation
Source: AFC & AS computation Source: AS computation Table 9: EV/EBITDA Multiple valuation
Relative Valuation – Comparable Multiples
Comparable Multiples is an easy and useful instrument to complement Absolute Valuation Methods as DCF. With the aim to confirm the DCF valuation I did a cross check with the comparable multiples. Relative Valuation assumes that a company valuation can be achieved based on the value of comparable companies.
Comparable multiples consist on the valuation of a company based on ratios (multiples) of similar (comparable) companies. Comparable companies are known as peers.
Enterprise Value/EBITDA multiple was the selected to perform the relative valuation, as it has low sensitivity to effects of financial leverage/capital structure compared to price multiples.
𝐸𝑉 = 𝑀𝑎𝑟𝑘𝑒𝑡 𝑣𝑎𝑙𝑢𝑒 𝑜𝑓 𝑐𝑜𝑚𝑚𝑜𝑚 𝑒𝑞𝑢𝑖𝑡𝑦
+ 𝑀𝑎𝑟𝑘𝑒𝑡 𝑣𝑎𝑙𝑢𝑒 𝑜𝑓 𝑝𝑟𝑒𝑓𝑒𝑟𝑟𝑒𝑑 𝑠𝑡𝑜𝑐𝑘 (𝑖𝑓 𝑎𝑛𝑦)
+ 𝑀𝑎𝑟𝑘𝑒𝑡 𝑣𝑎𝑙𝑢𝑒 𝑜𝑓𝑑𝑒𝑏𝑡 − 𝑐𝑎𝑠ℎ 𝑎𝑛𝑑 𝑠ℎ𝑜𝑟𝑡 𝑡𝑒𝑟𝑚 𝑖𝑛𝑣𝑒𝑠𝑡𝑚𝑒𝑛𝑡𝑠 Peers are a vital piece to perform this method and so the process of selection should be carefully done to get the proper peer group. To pick Arsenal’s peer group an alternative approach was used to obtain the most similar companies. The resulting peer group reached was composed by seven firms from five different countries. Olympique Lyonnais Groupe SA, Sport Lisboa e Benfica-Futebol SAD ,Benfica-Futebol clube do Porto, Juventus Football Club SpA, Borussia Dortmund GmbH & Co KgaA, AS Roma SpA and Manchester United Plc were the final peer group. (Appendix 5; Table 6)
Based on data extracted from Bloomberg, a four years analysis was done. A weighted average was applied giving more importance to Manchester United data (66.66%) based on similarity of economic factors with Arsenal.
The final valuation of £32,801.51 per share was reached, indicating a discount in the price paid of 11.5% (Appendix 10; Table 9). The Multiples valuation suggests a higher value than DCF valuation. The percentage of 66.66% attributed to
Manchester United can biased the final valuation as it is the 3rd in the Operating
Revenues ranking (Table 5), 1.54 times Arsenal Revenues and also a lower staff costs to revenues ratio (0.48 instead of 0.55).
7. FINANCIAL ANALYSIS
AFC financial performance was evaluated by looking at historical and forecasted values, highlighting some KPIs illustrated by profitability, liquidity and solvency ratios (Appendix 3).
New era of broadcast and sponsor contracts - new achievements
Arsenal revenues increased from £301.87m to £403.27 since 2014 till 2018, an average YoY increase of 7.51%. This uplift can be justified based on new sponsorship contracts with 8.50% average YoY increase, but also due to new cycles of broadcast contracts which are renegotiated with huge increases with an average YoY increase of 10.51%. Gate & Other Match Day Revenues were relatively stable with an average YoY decrease of -0.33%. Revenues just recorded decreases in absolute values in 2018. This decrease was due to the fail in participate on UCL, decreasing the broadcast revenue in 9.33% or 35.5% when looking separately for UEFA broadcasting revenues. In the future the Revenues are expected to outpace the historical growth, with new sponsor deals and broadcast contracts justifying the average YoY increase of 9.74% and 11.71% respectively, driving the Revenues to 7.77% CAGR during 2018-23.
13
0 100 200 300 400 500 600Cash and cash equivalents Debt
Figure 23: AFC Debt vs Cash
Source: AFC & AS computation Table 11: AFC Profitability ratios
Source: AS computation Table 10: AFC Liquidity ratios
Source: AS computation 0 20 40 60 80 100 120 140
EBIT EBITPT Linear (EBIT)
Figure 22: AFC EBIT vs EBITPT
Source: AFC & AS computation
Major operating cost, staff costs, will keep following revenues pace
Staff costs were the major contributor of expenses during the past, with an average percentage of 53%. The increase of revenues lead clubs to invest in human resources to keep a competitive Football team. During 2014 to 2018 this operating expense suffer an average YoY increase of 7.58% which was very similar to Revenues increase. This correlation is expected to continue in the future with the staff costs following the Revenues tendency, with an YoY average increase of 7.15% (Figure 21)
EBIT vs EBITPT
Operating profit should be analyzed before and after player transactions as the clubs should be profitable without them as these operations are uncertain, volatile and in the case of AFC is not the core/crucial source of revenues. AFC has always recorded positive EBIT, increasing by 45.37% CAGR from 2014-18 to 78.98m. EBITPT is tendentially bigger than EBIT as the club sped more than gain in PT. Arsenal operating income is not dependent on player sales as the club adjust his purchases with the sales. The board of directors have expressed their desired to invest in the team to be even more competitive and is expected that this investment will increase soon but without putting in cause the financial sustainability of the club. Net book value of PRs are expected to record an CAGR of 13.80% from 2018-23F, climbing from 23.15% to 31.43% of Total Assets (Figure 22)
Liquidity
Current Ratio and Quick ratio have recorded values above 1 and it is expected to increase even more to 1.70 and 1.42 in 2023F, meaning that the club will be able to cover its short-term debt with its current assets. By looking at the cash flow statement it is easily observed that the company was generating cash in a sustainable way, with positive cash flows, and the forecast period follows the same path. (Table 10)
Profitability
The club has been able to generate positive net income in the past and I have predicted the same path for the future with an overall uplift of 36.57% from 2018-23F, increasing from £56,554m to £77,24m. Profitability ratios for 2023F are lower than 2018 values despite 6.4% CAGR for net income. The abnormal net income in 2018, justified by higher revenues than costs in PT can explained this decrease, as well as the higher CAGR of assets (7.05%) and equity (12.47%) (Table 11)
No more debt to finance CapEx in the near future
AFC assets enlarged over the last years due to the investment on PR, recorded as Intangible assets. The club has already constructed the stadium and the training camp, so is not expected to invest huge amounts in infrastructures in a near future. The players will be the responsible for the continually increase of the assets, with an expected average YoY of 7% for 2018-23F, or 13.8% by isolating PR. As AFC CapEx main items were the stadium and the training center, which needed to be financed by debt, now the club focused his investments in acquisitions of PR. Since this investment is dependent on revenues, the club does not need to contract more debt. In 2018FY the company recorded a negative net debt, and the difference between debt and cash will be bigger and bigger in the next few years (Figure 23).
14
8. Investment Risks
There are some risks that could potentially affect the company performance throughout the years. Risks were segmented into three main categories: Financial Risk (FR), Operational Risk (OR), Regulatory Risk (RR).
Financial Risk │ Credit risk (FR1)
Credit risk refers to the risk that a counterparty will not pay its obligations, being that the group will not recover the value of the sold assets at the agreed timeline. This risk arises from transfer activity or any other agreements with sponsors or for broadcast rights. The risk could be minimized by asking for instalments, advance payments or even a guarantee from the bank, being that the club should do a regular monitorisation with a creation of a reserve for uncertain accounts receivable.
Financial Risk │Liquidity risk (FR2)
Liquidity risk concerns the risk of the group could not has access to funds to meet its payment obligations at the maturity date, being that available cash flow could not be enough. To guarantee appropriate levels of funds, the club forecast the cash flow on a continuous basis considering the debt resulted of the stadium construction, ensuring the normal operation of the business with the required debt service reserves. AFC has more than 20% of assets in cash, turning liquidity ratios favourable with values over one.
Financial Risk │ Exchange rate fluctuations (FR3)
PL clubs can be exposed to exchange rate fluctuations through two sources: UEFA payments due to UCL or UEL participation; Player transactions with foreign clubs. Arsenal hedge his foreign exchange exposure by using derivative financial instruments.
Financial Risk │ Change in interest rates (FR4)
Football clubs with outstanding debt finance that are subject to floating rates that could sudden change and have an impact on the club financial results, normally enter into interest rate swaps to fix the rate and eliminate the interest rate risk such as Arsenal does.
Financial Risk │ Economic downturn (FR5)
Although multiyear contracts are present in the industry, an economic downturn in Europe or UK could affect revenues relative to personal disposable income like Matchday revenues. Broadcasting and Sponsorship revenues could also be affected if the companies affiliated to us suffer an economic impact and need to cut costs.
Operational Risk │ UCL Qualification (OR1)
Qualification for UCL is an important achievement for the clubs as it implies a relevant part of revenues but also increase the prestige of them. The qualification depends on internal factors like last season performance in the PL or even in UEFA competitions but also on external factors such as the total places for each national football association for the UEFA competition which is based on a ranking that can vary. If a club doesn’t qualify for UCL could see its ability to acquire or retain key players affected, as well as the interest of sponsors and supporters. To minimize this risk the clubs should include on the contract of player a clause related to the remuneration if the team fail to qualify for the group stage of the competition, which permit the club to adjust staff costs to the reduce of revenues.
Operational Risk │ Players physical health (OR2)
Injuries can force players to stop play for a long period or even to end up early the football career. As an asset of the club, if a player suffers an injury that forces him to stop play, the club would not make profit with a possible transfer or get the aimed sport returns. To mitigate this risk the clubs should have a nice medical department and a competitive team with players able to substitute the injured teammates.
15
Attract and maintain high-quality employees including managers, players or executives is crucial to achieve success inside and outside the pitch. The rivalry between clubs can lead clubs to incur in high salary expenses in order to attract top players, with the ones with higher revenues having also greater spending capacity. Transfer campaign is the way to control and manage the squad constitution, controlling also the wage costs. Any fail to acquire a key player or to sell an actual player can lead the club to unexpected costs or unsuccess seasons.
Operational Risk │ Negotiation of broadcast contracts (OR4)
Negotiation of broadcasting contracts are done by Premier League and UEFA on a centralized basis. The established final price and its distribution during the 3year cycle affect the clubs and they don’t have any direct influence alone on the outcome of the deal. Although the broadcast revenue is centralized and fix, there are always an additional variable value due to sporting performance. The duration of 3 years seems to be a way to mitigate the short-term risk.
Operational Risk │ Key sponsor agreements (OR5)
Sponsor deals are not permanent, and clubs should be aware that sponsor could not be interested in renewing the partnership. Change of interest from sponsors, reducing the investments, or difficult to find new sponsors with similar deal values could affect clubs' financial position with revenues recording an unexpected growth. Became a global club to attract sponsors worldwide, as well as close multiple-year contracts with large maturity dates can guarantee this source of revenue in the short-term, reducing this risk.
Operational Risk │ Football popularity (OR6)
Football is the most popular sport in UK, entitled the national game. All this popularity helps the industry to increase revenues in all the key drivers, mainly broadcasting. A decline in football popularity could lead to a decrease of matchday, broadcasting or sponsorship revenues since there could be fewer people interested.
Operational Risk │ Unexpected catastrophic events (OR7)
Companies within the industry can be affected by natural disasters, wars, terrorist acts or some incident like the airplane fall of the team which are out of clubs control. Although the European clubs' operations are in peaceful countries, players need to travel for promotional matches or to represent their national team in countries with a recent war history. Clubs should insure against any of these potential events with insurance policies, protecting their most valuable assets which are in the case of Arsenal, the Players, Emirates stadium and the training facilities.
Regulatory Risk │ Financial Fair Play (RR1)
Arsenal is subject to Company Law, F.A, Premier League, UEFA and FIFA rules concerning club finances, accounting and good governance. The Premier League has implemented financial rules regarding the payment of transfer fees, tax bills or wages at time or even loss limits to Earnings before taxes, being
obligated to submit accounts on an annual basis. The applicable sanctions
include fines, deduction of points in the premier League or transfers restrictions. To be illegible to participate in European championships clubs should satisfy sporting, infrastructure, personal and administrative, legal and also financial standards, obtaining the UEFA License, created in 2004, that is also constituted by the FFP. In September 2009 UEFA's Executive Committee created the FFP in order to promote an improvement of clubs’ financial conditions, increasing the credibility and transparency of them with the aim of ensure sustainability in the long-term for European football. Among the measures, break-even rule deserves a highlight. The acceptable deviation for the break-even is 5m euros or up to 30m euros if equity holders guaranteed funds to cover the difference. The break-even point should be calculated just with relevant costs without considering Capex in training facilities, stadiums, women´s football and also youth developments. If the relevant costs exceed revenues, considering a cumulative value over three years, clubs can also be subject to UEFA sanctions. UEFA CFCB disciplinary