PEDRO HENRIQUE GUIMARÃES PINTO PEIXOTO
FORESTS FOR MARKETS:
CAN A MARKET BAN ON SOYBEANS DETER
DEFORESTATION IN THE LEGAL AMAZON?
Rio de Janeiro
2017
FORESTS FOR MARKETS:
CAN A MARKET BAN ON SOYBEANS DETER
DEFORESTATION IN THE LEGAL AMAZON?
Dissertação para a obtenção do grau de Mestre em
Economia apresentado à Escola Brasileira de
Economia e Finanças
Área de concentração: Economia do Meio
Ambiente e dos Recursos Naturais
Orientador: Francisco Junqueira Moreira da Costa
Rio de Janeiro
2017
Peixoto, Pedro Henrique Guimarães Pinto
Forests for markets: can a market ban on soybeans deter deforestation in the legal Amazon / Pedro Henrique Guimarães Pinto Peixoto. – 2017.
42 f.
Dissertação (mestrado) - Fundação Getulio Vargas, Escola de Pós- Graduação em Economia.
Orientador: Francisco Junqueira Moreira da Costa. Inclui bibliografia.
1. Economia ambiental. 2. Desenvolvimento sustentável - Amazônia Legal. 3. Desmatamento. 4. Soja - Mercado. I. Costa, Francisco Junqueira Moreira da. II. Fundação Getulio Vargas Escola de Pós-Graduação em Economia. III. Título.
To Clarissa Gandour, who helped me find an idea not only interesting but meaningful to me. To my advisor, who bought this idea and whose comments enhanced my work and saved me from all the research’s quicksand I have fallen.
To EPGE, whose extremely difficult courses helped me build the skills and knowledge required to carry out my essay from the first step to the last.
To my parents, for all their support through the ups and downs of this journey with many downs and a few, but sometimes bright, ups.
And finally, to my colleagues and friends, who shared many of my fears and anguishes and have never judged me as harshly as I have.
“There are three kinds of lies: lies, damned lies and statistics.” Benjamin Disraeli Former Prime Minister of the United Kingdom (1804 - 1881)
in the Amazon Biome. Under this agreement, all signatories commit to not buy soybeans produced in lands deforested after July 2006. There is no effective evaluation of this program and the literature in economics have not addressed the question of whether a market ban could reduce deforestation. My main specification is a triple-difference estimate and I find that, unlike previous evaluations, the moratorium had no effect to reduce deforestation.
o desmatamento no Bioma Amazônia. Sob esse acordo, todos os signatários se comprometem a não comprar a soja produzida em terras que foram desmatadas a partir de julho de 2006. Até hoje, não foram feitas boas avaliações desse programa e a literatura de economia desconhece a efetividade de embargos a produtos como ferramenta de combate ao desmatamento. A principal especificação econométrica deste trabalho consiste numa estimação em diferenças triplas e resulta, diferentemente das avaliações anteriores, na avaliação de que a moratória não foi capaz de reduzir o desmatamento na Amazônia.
1 INTRODUCTION ... 8
2 RELATED LITERATURE ... 11
3 BACKGROUND ... 15
3.1 Deforestation in the Amazon ... 15
3.2 The Soy Moratorium ... 16
4 DATA ... 19
4.1 Deforestation Measures ... 20
5 EMPIRICAL STRATEGY... 21
5.1 Differences-in-differences equations ... 24
5.2 Triple-differences ... 25
5.3 Testing pre-trend assumptions ... 27
6 RESULTS ... 29
7 DISCUSSION ... 32
8 CONCLUSION ... 34
REFERENCES ... 35
1 INTRODUCTION
The Amazon forest is the world’s biggest tropical forest and losing it may have grave effects on the South American climate. Nobre (2014) makes a review of the literature on the relation between climate and the Amazonian forest cover and describes the forest’s importance to the hydrologic cycle of the south-central part of South America. According to the report, “[f]or the most deforested portion of the Amazon a progressive delay is already observed in the onset of the wet season, which has a profound effect on the agricultural sector”.
In Brazil, there are many efforts to reduce deforestation and most of them happen under the Action Plan for the Prevention and Control of Deforestation in the Legal Amazon (Plano de Prevenção e Controle do Desmatamento na Amazônia Legal, PPCDAm), a holistic plan that integrates the actions of many government institutions. Some efforts, however, are not government led as the PPCDAm.
One factor that has been seen as an important deforestation driver is the soybean expansion into the Amazon Biome (Fearnside (2001), Casa Civil (2004), Watts (2005), Greenpeace (2006)). After Greenpeace organizing a protest at the port of one of the main soy exporters in the Amazon and releasing a report on the threats posed by the soy expansion into the forest, the industry signed an agreement in response to the reputational threat it then faced. Under the Soy Moratorium, as it is known, the members of the two biggest buyers’ associations in the Amazon Biome committed to not buy any soy produced in areas deforested after July 2006. Although it has been seen as a successful initiative to reduce deforestation, many of its evaluations are flawed for not using a careful empirical methodology and, therefore, cannot distinguish between the moratorium’s and the PPCDAm’s effects1. To address this problem, I estimate the effect of
the Soy moratorium on annual forest loss using a triple-difference identification strategy. The literature points that conservation policies are highly dependent on location targeted (Andam et al. (2008); Pfaff et al. (2009)). Also, there is evidence that a market ban may be effective to stop the commercialization of the banned good (Schlenker and Villas-Boas (2009), Lemieux and Clarke (2009)). This effectiveness, however, depend on the producers’ capacity to escape the ban (Lemieux and Clarke (2009), Soares and Chimeli (2011)). Also, a market ban
may as well as have unintended consequences, such as the increase of violence related to the now illegal good (Soares and Chimeli (2011)).
The Soy Moratorium, unlike the previous studied bans, is an industry led initiative and the question is if it can be effective even without the coercive power of the State. The Fair Trade literature, as presented by Nunn et al. (2014), hints that it can. What raises concern, however, is the fact that the firms enforcing the moratorium are the same potentially harmed by it, since it could result in higher soy prices. Another reason the agreement may fail is poor land tenure, as it makes difficult for proper accountability: if the monitoring can’t correctly identify the owner of a non-complying soy plantation, then they won’t fear being excluded from the market. My empirical strategy uses the design of the Soy Moratorium monitoring to select treatment and control groups. The monitoring focus on lands inside the Amazon Biome and only on the states of Mato Grosso, Rondônia and Pará. It also restricts to counties inside those states with over 5,000 hectares in soy planted. Therefore, I use non-soy producing counties (those with less than 5,000ha in soy planted) to control for soy producing ones (those with at least 5,000ha in soy planted) hoping to net out any effect on deforestation caused by other factors occurring inside the Amazon Biome, such as the PPCDAm policies. Since this does not net out effects due to factors differentially affecting producers and non-producers, I also use the Cerrado Biome to control for the Amazon Biome.
For each county in these groups I use georeferenced data for the Legal Amazon on soy planted area to sort them into soy producers and non-soy producers. I also use georeferenced data on deforestation to calculate two different measures: deforestation rate, defined as the share of the current deforestation increment on the previous year remaining forest and the normalized deforestation, defined as the deviation in standard deviations from the time mean of each county deforestation increment. I then use these measures in two different specifications: two double-differences and one triple-difference. One double-difference captures differential effects of the PPCDAm policies on each biome while the other captures differential effects on soy producing and non-producing counties. The triple-difference captures the causal effect of the Soy Moratorium on deforestation.
Since soy production is mainly concentrated near the biomes’ frontier, I also estimate those same equations for three different samples. One includes all counties inside the Amazon Biome while the other two exclude non-producing counties inside the Amazon Biome more than 100km and 10km away, respectively, from producers.
My identification assumption is that, on the absence of the agreement, the difference in the deforestation measure between soy producing and non-soy producing counties inside the Amazon Biome would have followed the same trend as the difference in the deforestation measure between soy producing and non-soy producing counties on the Cerrado portion of the Legal Amazon. To test it, I test for pre-trends equality in all estimations. I do not reject the common pre-trends assumption for the sample of Amazon Biome’s counties within 10km from soy producers and, therefore, my results are drawn from it. I find evidence that the Soy Moratorium had no effect to reduce deforestation in soy producing counties relative to non-producers. This result, however, is not robust: in the full sample, the pre-trends estimates’ significance is sensitive to functional form.
I interpret this finding as evidence that either the Soy Moratorium cannot curb deforestation at all or that PPCDAm policies are already doing everything the moratorium could have done and the agreement cannot contribute any further. This may be due to lack of enforcement or because producers are able to escape the moratorium by displacing less lucrative agricultural products into native forests and then planting soy on the now vacant land. If, for example, the farmer produces both soybeans and cattle, it could expand soy production into the pasturelands and displace the cattle to another area, which may need to be deforested prior to the displacement. The remainder of this work is organized as follows: in Section 2, I describe the related literature; in Section 3, I provide the background on the deforestation in the Amazon at the time of the moratorium’s implementation and on the agreement itself; in Section 4, I describe the data used and the deforestation measures; in Section 5, I present my empirical strategy and tests for the pre-trends assumption, also explaining how I use the moratorium’s monitoring criteria to sort counties into treatment and control groups; results are presented in Section 6 and discussed in Section 7; Section 8 concludes.
2 RELATED LITERATURE
This work is related to the literatures on deforestation policies, labelling and market bans. Soybean is a major cash crop in Brazil and the Soy Moratorium acts upon a well-established market, where producers are well integrated with the rest of the supply chain. Pfaff (2013) makes an overview of studies on policy impacts on deforestation in this kind of setting. In the classic land use model, producers decide whether to deforest a land site or to manage the forest to maximize expected profits. Factors that affect profits include input and output prices, transportation costs and risk of expropriation, in the case of insecure land tenure. The empirical evidence on conservation policies of these studies is that they are highly dependent on the location targeted: protected areas, for instance, have greater impact the less isolated are the lands at which they are instated (Andam et al. (2008); Pfaff et al. (2009)).
Other studies have shown the role a broader policy, the Action Plan for the Prevention and Control of Deforestation in the Legal Amazon (Plano de Prevenção e Controle do Desmatamento na Amazônia Legal, PPCDAm), has played on the sharp reduction of deforestation in the Legal Amazon. Assunção, Gandour and Rocha (2015) disentangle the effects of prices and PPCDAm policies and show that it has saved 56%, from 2005 to 2009, of lands that would have been cleared if this plan had not been implemented. Burgess, Costa and Olken (2016) use RDD on the Brazilian borders with other seven South American countries, where 35% of the Amazon forest is, to show these policies were impactful even on lands where the state officials have a difficult access.
The Soy Moratorium, however, is not one these policies and, to the best of my knowledge, the economics literature has not studied yet the effects of a market ban on deforestation. There are works, on the other hand, that analyze its effects on different settings and outcomes, such as cattle prices (Schlenker and Villas-Boas (2009)) and illegal poaching (Lemieux and Clarke (2009)), and they suggest its effectiveness is not assured and can have unintended consequences. For instance, Schlenker and Villas-Boas (2009) use a detailed scanner dataset from a large U.S. grocery chain and from the Chicago Mercantile Exchange to assess the effect of two warnings on the mad cow disease: first on the Oprah Winfrey Show and, seven years later, by government officials. They document a decrease in beef sales and abnormal price drops for future cattle following the warnings. Lemieux and Clarke (2009) shows a positive effect of the 1989 ivory sales ban on the African elephant population, intended to stop its fast decline
due to illegal poaching, although 37 countries were not able to enforce it and continued to watch their elephant population decline.
Soares and Chimeli (2011) studies the effect on violence of a ban on big leaf mahogany sales in Brazil in 2004. They show that homicides rates have increased as consequence of the illegalization of this market. They also show that sales had persisted over the time, as sellers could mask the mahogany cargoes as “other tropical timber species”. Also, Dell (2014) find a positive effect of crackdowns in violence in Mexico after conservative National Action Party’s (PAN) candidates have won close elections. The relative increased action to combat drug trafficking following these victories have led rival factions to fight over control over territories previously occupied by the now weakened incumbent and have also led criminals to fight over alternative routes to transport drugs, leading to higher homicides rates where these fights occurred.
The Soy Moratorium, however, is not a government policy, but an agreement between private companies. Although state policies can work, could a private initiative also curb deforestation? The literature on Fair Trade can help answering this question. Fair Trade certifications are made mostly by private association and NGOs and the Moratorium can be seen as a certification on an environmental standard. Nunn et al. (2014) provide an overview of studies on Fair Trade certifications and concludes that Fair Trade-certified producers do receive higher prices for roughly the same amount sold by similar non-certified producers and, although they understand that selection evidence is incomplete, they interpret previous results as indicative that the least able producers are the most likely to be certified and this imply correlational evidence may understate the effects of certification. I interpret this as evidence that consumers do change their choices in response to a mechanism to signal a socially responsible product. Nunn et al. (2014) also find that producers aiming for environmental certification adopt more environmental friendly practices and I interpret this as indicative the environmental certification acts on environmental practices the same way Fair Trade certification acts on other producer’s practices. Therefore, the fact that the Soy Moratorium is carried out and enforced by private companies is not a reason to believe it will not work. What raises concern, however, is that the companies enforcing the moratorium are the same potentially harmed by it, since it could result in a scarcer or more capital intensive input for them, both possibilities resulting in higher prices. Another reason the moratorium could fail is poor land tenure. If clearance can ensure tenure or if it can make physically defending the lands easier, farmers will have an incentive to clear and occupy forest areas. This is a serious problem in Brazil, where overlapping properties are
common: in some states, like Acre, officially registered rural properties sum up to more than 200% of available lands. Also, if the lands overlap, accountability will be more difficult to apply: farmers could plant soybeans on deforested lands if they think the probability of the non-compliant soy being attributed to them is low enough. Since the annual reports on the moratorium’s monitoring does not cite this difficulty, it may not be a real threat to the agreement, but these reports are on the monitoring only, never citing the enforcement of the agreement. For further reading, Chiavari and Lopes (2016) makes a report on the history and present state of Brazilian lands occupation and legislation.
Therefore, there is enough evidence on the literature that the effect on deforestation of a market ban on soybeans is not obvious. In one hand, deforestation policies have been documented to work, the moratorium targets economically important and integrated areas, and the fact that it is a private agreement does not imply in its failure. On the other hand, the moratorium can be ineffective if producers can escape its monitoring by masking their soybeans, exploiting loopholes on the agreement, have stronger incentives to plant soy on deforested lands or even if the soy buyers do not have the incentive to enforce the moratorium.
Although I do not know other works on the economics literature to assess the effect of a market ban on deforestation, I must acknowledge the work from Gibbs et al. (2015). This paper asks if the Soy Moratorium could reduce deforestation on the Amazon Biome but do not control adequately for possible confounders. They compare the deforestation evolution inside the Amazon Biome with the deforestation evolution in the entire Cerrado and the region known as MATOPIBA. Therefore, they are saying that Cerrado regions as far as in the São Paulo state are good controls for the Amazon, as well as the new soybean frontier, a region with a possibly very different dynamic from the Amazon itself. In particular, they do not control for the PPCDAm policies, since none of them are in force in most of the Cerrado, which means their result may be due to either the Soy Moratorium or any of the plan’s policies. In this regard, the authors argue that “[f]ederal enforcement mechanisms are unlikely to be an effective substitute for the [Soy Moratorium] in the near term, because there is no simple way to identify properties that are in compliance with the [Forest Code]”. However, even if compliance is not easily addressed, the Forest Code is but one of the measures taken to control illegal deforestation and Assunção, Gandour and Rocha (2015), as well as Burgess, Costa and Olken (2016), gives evidence that PPCDAm is working despite this difficulty. Also, even if the Soy Moratorium has a role in reducing deforestation, not all of it is caused by soy: cattle raising, illegal logging
and the appropriation of public-owned lands by private actors, a practice known as grilagem, are also important drivers and the PPCDAm acts upon all of them (Casa Civil (2004)).
To disentangle the effects of the moratorium from those of PPCDAm, I use two levels of controls: the Cerrado portion of the Legal Amazon to control for the Amazon Biome and the soy producing counties to control for the non-producing ones within each biome. Since only the counties with at least 5000ha of soy planted are monitored by the Soy Moratorium, in this work I define as “soy producers” all counties with at least 5000ha of soy planted. By restricting the study area to the Legal Amazon, I eliminate all influence from factors other than the PPCDAm outside the Amazon Biome. Comparing this biome with the Cerrado, I control for the effects of the plan’s policies since all of them are in force within it but the moratorium is not. Since PPCDAm may have had differential effects on the Amazon Biome than on the Cerrado2, I compare deforestation outcomes between soy producers and non-soy producers
within each biome to control for these differences. This way, I hope to select better comparison groups and estimate a cleaner effect than Gibbs et al. (2015).
3 BACKGROUND
3.1 Deforestation in the Amazon
From 1991 to 2004, deforestation in the Legal Amazon has grown in almost every year, going from 11,030 km² to 27,772 km² (MMA (2017)). By that time, some characteristics of the deforestation evolution were emphasized such as its geographic concentration and two of its economic drivers. It was identified that most of the deforestation was concentrated along an “Arc”, extending from the Acre’s southeast to the Maranhão’s southeast, passing through Rondônia, Amazonas’ south, Mato Grosso’s north and Pará’s south (Casa Civil (2004)). In the 2000-2001 period, nearly 70% of the deforestation in the Legal Amazon occurred in Rondônia, Mato Grosso and Pará states. Also, cattle raising and soybean planting were identified as important deforestation drivers in the Legal Amazon (Casa Civil (2004)). While cattle raising was blamed for 80% all deforestation in the Legal Amazon, a 57% increase in planted area in 1999-2001 period was seen as a threat to the forest.
Then, in 2004, the Brazilian government launched the PPCDAm, a holistic plan to decrease the deforestation rates. It is an integrative plan in which thirteen Ministries coordinate under the Brazilian Chief of Staff, the Brazilian Executive Office’s highest-ranking member. It “sought to inhibit forest clearings and promote forest conservation by focusing on three main policy efforts: strengthening monitoring and law enforcement; expanding protected territory; and adopting a conditional rural credit policy” (Assunção et al. (2015)).
The creation of DETER (Real Time Detection) system greatly improved the deforestation monitoring, since it allowed authorities to detect deforestation occurring in 15-day time windows. Previously, they were dependent of voluntary reports of threatened areas, making timely location and accessing to deforestation hotspots a difficult task (Assunção et al. (2013)). Besides, law has changed to make deforestation a crime punishable by imprisonment and to increase the required native vegetation inside every rural property from 35% to 80%. It became illegal, then, to deforest more than 20% a private property. Also, the demarcation of over 60 million hectares of Protected Lands and Indigenous Lands, areas where any deforestation is either illegal or heavily restricted, further increased the size of the land unavailable for production.
In 2008, two other major efforts were made: a conditional rural credit policy and the blacklisting of some counties for high priority action. Rural credit in Brazil is heavily subsidized and, for
all producers inside the Amazon Biome, it became conditional on them to meet certain environmental criteria. Also, counties with a recent history of very high deforestation rates were blacklisted to be assigned a stronger monitoring and to suffer sanctions. In 2008, 36 counties were blacklisted for high priority action, in 2009, seven were added and, in 2011, seven more. Although this blacklisting could affect any county inside the Legal Amazon, almost all of the blacklisted counties are inside the Amazon Biome.
3.2 The Soy Moratorium
As we can see in Table 1, soybean farming has been expanding into the Amazon at least since 2001, with a major increase in 2005, nearly doubling the 2004 planted area. Deforestation as well (Figure 1), grew from 2001 to 2005, reaching a peak in 2004, and many blamed the soy expansion for this increase (Fearnside (2001), Casa Civil (2004), Watts (2005), Greenpeace (2006)). Then, in April 2006, Greenpeace organized protests at a Cargill’s soybean terminal in Santarém, Pará, and published the report “Eating up the Amazon”. Cargill is an important soy exporter in the Amazon and these actions helped raise international awareness over the claimed relation between deforestation and the soybean expansion into the Amazon Biome. In July of the same year, the two greatest Amazon’s soybean traders, the Brazilian Association of Vegetable Oil Industries (ABIOVE) and the National Association of Cereal Exporters (ANEC) (Gibbs et al. (2015)), signed an agreement in response to the reputational risk posed to the soybean industry by this increased attention. Under the Soy Moratorium, as it was named, these associations pledged to no longer buy soybeans produced in areas of the Amazon Biome deforested after July of 2006. It is important to note that, although the agreement officially cites the non-commercialization of soy coming from non-compliant areas3(ANEC website), the ADM’s website, one of ABIOVE’s associates, clearly states that companies do not commercialize soy from non-compliant producers, even if their non-compliant soy is only a small fraction of its total production4.
3 http://www.anec.com.br/pt-br/informacoes/moratoria-da-soja. Accessed in 03/19/2017.
The table shows the evolution of non-compliance to the Soy Moratorium in monitored counties for all years in the sample. The moratorium was signed in 2006 but monitoring began only in 2007. In 2008 Inpe became officially part and leader of the monitoring team. Soy data comes from Gibbs et al. (2015) while non-complying area and the number of monitored counties comes from the 2013/2014 harvest report. The non-complying percentage is the division of the non-complying area in each year by the planted soy area for that same year.
Year Planted Soy (ha) Non-complying (ha) Non-complying (%) Monitored
counties 2001 302724.7 NA NA 0 2002 287678.5 NA NA 0 2003 477656.1 NA NA 0 2004 558299.6 NA NA 0 2005 1145954.9 NA NA 0 2006 1086840.4 NA NA 0 2007 1039393.2 0 0 37 2008 1286591.8 1384 0.107571 46 2009 1290505.3 6295 0.4877934 52 2010 1318709.2 11698 0.8870796 53 2011 1770975.7 18410 1.03954 58 2012 1726239.6 29295 1.6970413 62 2013 1934465 47028 2.4310598 73
Table 1: Non-compliance in monitored counties
Figure 1 - Deforestation by Biome
The figure uses data from Hansen et al. (2013) to show the yearly deforestation increment for the Legal Amazon. Data is shown separately for both biomes.
The traders wrote the agreement in cooperation with high profile environmental groups, such as Greenpeace and WWF-Brasil, forming the Soybean Working Group (GTS), responsible for overseeing its implementation and monitoring. The group was then divided into three subgroups: one responsible for farmer education and campaigning, one responsible for garnering greater support from businesses, NGOs and the federal government and one responsible for the monitoring itself. The first monitoring occurred for the 2007/2008 harvest and did not find any non-compliant soy on monitored lands. The company hired, Globalsat Monitoramento Agrícola, monitors PRODES polygons within counties which satisfies a few criteria, detailed below, and used a combination of aerial surveys and field visits to identify land use within each monitored polygon. The criteria used to select which polygons to monitor were the following:
a) The polygon must be located within the Amazon Biome and in the states with significant soy acreage: Mato Grosso, Pará and Rondônia;
b) It must be located outside of protected areas (Conservation Units and Indigenous Reserves);
c) Be larger than 100ha;
d) It must be in counties with at least 5,000ha of soy in 2006 and in the 2007/2008 crop estimate (prepared by ABIOVE); and
e) The polygon must be wholly or partially contained within the Amazon Biome.
These criteria remained roughly the same throughout the years: in 2009 criterion “c” changed the threshold to 25ha5; criterion “b” included rural settlements also in 2009, only to be dropped
in 2013; criterion “d” changed in the following years to monitor all counties with at least 5,000ha planted at the current monitoring year or estimated to cross this threshold on the following. Note that the monitoring area overlaps the deforestation “Arc”.
The most important change in the monitoring process occurred in 2008, when the Brazilian Environment Ministry (MMA) officially joined the GTS, making the Space Research Institute (INPE) the leader of the efforts to monitor the soybean growth at the areas deforested after the cut-off date. Satellite image analysis, then, were used to guide aerial surveys and field visits and, eventually, substituted both as its reliability increased to the point of making them
5 From the 4th monitoring on, the criterion was to monitor aggregated polygons, instead of polygons, greater than
25ha. Aggregated polygons are composed by smaller ones from previous years, e.g., if PRODES registered two separate 10ha polygons in previous years and, in the current year, another 10ha between those such that they are all adjacent, the three are aggregated to create a single 30ha polygon.
redundant. Since then, year by year, the monitoring has been accusing an increasing number of non-compliant soy areas, although it is very small even at its peak6. Part of this increase is due
to the inclusion of counties in the monitoring group throughout the years. Table 1 also show this evolution.
Originally, the moratorium was a two-year agreement, but it has been renewed annually since 2008. As of May 9, 2016, the agreement was renewed indefinitely and this shows the importance given to the agreement by the government, the environmental groups and the soybean buyers and exporters. The confidence on its effectiveness comes mainly from the high compliance rate and the reports’ analyses showing a decrease in deforestation rates on the Legal Amazon and on monitored counties after 2008. However, I believe the analyses are flawed for not considering alternative causes, like PPCDAm policies, and for questionable treatment group definitions.
4 DATA
In this work, I use georeferenced data for deforestation and soy production from Hansen et al. (2013) and Gibbs et al. (2015) respectively.
Hansen et al. (2013) make available georeferenced data for world’s annual tree cover loss. From 2001 to 2013, it registers for each pixel the first year after 2000 that it lost canopy. Each pixel’s resolution is 1 arc-second, which is equivalent to 30m at the Equator, and “tree” is defined as all vegetation taller than 5m. I restrict attention to the area within the Legal Amazon, to both the Amazon and the Cerrado Biomes7.
To track the soy farming across the Legal Amazon, I use georeferenced data for soy farming in the Amazon biome and crop farming in the Brazilian Cerrado, respectively, taken from Gibbs et al (2015). The soy data comes from the analysis of the biome portion of 88 counties with at least 1000ha in soy production, comprising the three states of Mato Grosso, Pará and Rondônia.
6 There was only one drop after the study period, however: in 2014 the cut-off date moved from July 2006 to
July 2008, in accordance with the new Forest Code, and amnesty was given to all deforestation occurred up to the new date.
The GTS (Soy Working Group) monitors only those counties with over 5000ha in soy production, meaning this data can capture actions at unmonitored lands. Since 73 counties were monitored in the 2013/2014 harvest season, the data contains 15 counties more and provide almost 72.000km² of additional area, or 34% of monitored counties’ area. This data also ranges from 2001 to 2014.
Gibbs et al (2015), used machine learning to identify crop farming for the entire Cerrado at 250m resolution, beginning in 2001 and ending in 2013. The algorithm identified areas of at least 1km² of mechanized crop production. It is important to emphasize that I don’t have spatial data for soy production at this biome, only for crop farming, which can potentially include any crop planted in the region, such as cotton and rice. However, as the authors argue, the classification approach targeted the soy growing season and, as they write:
In much of the soy-producing region of the Amazon and the Cerrado, two and sometimes three crops are planted per year, but in nearly all cases one of those crops is soy. Soy is by far the most reliably profitable crop produced at large scales; as such, most farmers produce only soybeans during the soybean “season” (roughly September to January, with some variation across the regions). Commercial silos are also unlikely to accept crops other than soy at the beginning of the year, further discouraging production of other crops. Cotton is the only other major crop planted at roughly the same time as soy in the Cerrado. However, cotton is typically planted 30-60 days after soybeans because of the different end dates of the obligatory “sanitary periods” for the two crops. In regions where only one crop per year is typical, soybean is part of most interannual rotational systems at the large scales our analysis targeted.
Therefore, I also assume the most part of the crop raster data is comprised of soy and use the crop data as if it was equivalent to soy.
4.1 Deforestation Measures
Triple-differences estimates’ significance, as well as DD ones, depends on the functional form of the outcome variable. Hence, to better assess the effects of the Soy Moratorium, I use two deforestation measures: the deforestation rate and the normalized deforestation increment. The deforestation rate is defined as the lost fraction of previous year remaining forest. For instance, let be the annual deforestation increment and the total forested area at county and year . The deforestation rate is then defined as
Note that since Hansen’s deforestation data marks a given pixel as either “not deforested since 2000” or “deforested in ”, where ranges from 2001 to 2013, I can calculate the deforestation rate for all years in the sample.
The normalized deforestation, in turn, is defined as the deviation from the time mean, in standard deviations, of the deforestation increment. Then, if and are the average deforestation increment and the standard deviation of the deforestation increment of unit from 2001 to 2013, the normalized deforestation is defined as
= −
Note that both measures account for variations in the deforestation increment due to different unit sizes.
5 EMPIRICAL STRATEGY
A simple before-after estimate would confound the effects of the Soy Moratorium with the effects of PPCDAm policies. Since the moratorium is valid only for the Amazon Biome, I use the Cerrado portion of the Legal Amazon as a control group to the Amazon Biome. To eliminate differences in deforestation changes due to differences between biomes, I compare, within each biome, soy producing counties and non-soy producing ones. Therefore, I make a triple-difference (DDD) estimate by comparing the double-triple-difference between soy producing and non-soy producing counties inside the Amazon Biome with the same double-difference inside the Cerrado.
Soy producer and non-producer definitions are based on the monitoring criteria presented in section 3.2, which I modify to better suit my data. In particular, since I have only raster data there were no polygons for the deforestation at the Cerrado to classify as producer or non-producer for all the studied years. Therefore, I define counties, not polygons, as being soy producers or non-soy producers and alter the criteria accordingly. For the Amazon Biome, I drop criterion “c”, since it only makes sense for polygons and substitute “county” for “polygon” in criteria “a” and “e”. I also drop criterion “b”, for my objective is to capture both direct and
indirect deforestation caused by the soy expansion. Criterion “d” is then modified to classify as soy producing those counties with at least 5,000ha of soy in 2006, when the agreement was signed. I adopt these same modified criteria to the Cerrado, except criterion “a”, which I drop completely. Then, the criteria for each biome becomes the following:
1) Amazon Biome
a) The county must be located within the Amazon Biome and in the states with significant soy acreage: Mato Grosso, Pará and Rondônia;
b) The county must have at least 5000ha of soy in 2006; and
c) The county must be wholly or partially contained within the Amazon Biome. 2) Cerrado
a) The county must have at least 5000ha of soy in 2006; and
b) The county must be wholly or partially contained within the Cerrado.
Note that since the Soy Moratorium affects only counties with at least 5000ha of soy, these are also the criteria used to assigned counties into treatment and control groups for each biome. Although the moratorium is only valid to the Amazon Biome, I assume counties which satisfy the criteria for the Cerrado would also be affected by the agreement if it was extended to this biome. Hence, in this work, “treated” and “untreated” are synonyms to “soy producer” and “non-soy producer” respectively.
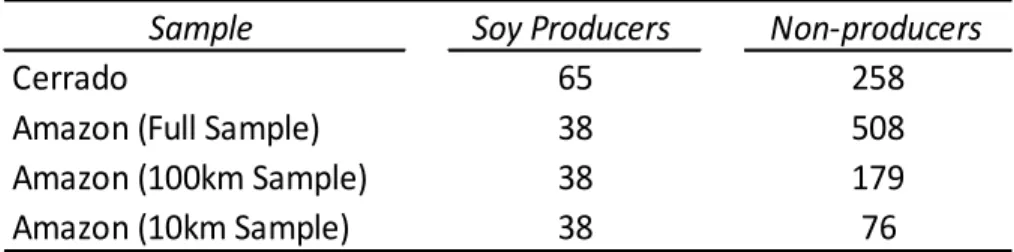
In total, there are 82 soy producing and 691 non-soy producing counties in all Legal Amazon. However, 96 of them lies simultaneously on both biomes. Hence, my observation unit is not the county, but the county portion contained in each biome. Therefore, a soy producing county lying in both biomes generate two observation units, one on the Amazon Biome and the other on the Cerrado, both counting as soy producing units. Table 2 shows the number of observation units for each biome, sample and category.
The table shows the number of soy producing and non-producing observation units in each sample. Each unit is one “county x biome” combination. Soy producer is defined as a county with at least 5000ha in soy planted, according to the criteria presented in section 5. The full sample includes all Amazon Biome counties. The 10km and 100km samples include all soy producers and all non-producers in a 10km and 100km buffer, respectively, from soy producers. Administrative and biome data comes from IBGE. Soy data comes from Gibbs et al. (2015).
Sample
Soy Producers
Non-producers
Cerrado
65
258
Amazon (Full Sample)
38
508
Amazon (100km Sample)
38
179
Amazon (10km Sample)
38
76
Table 2: Observation units per biome, sample and
category
From now on, I will simply use “county” as equivalent to the combination “county x biome”. For each county, I calculate the three measures defined in the Data section: the deforestation rate, deforestation increment’s natural logarithm and the normalized deforestation. The treatment group is defined as all the counties satisfying the eligibility criteria described in the Background section and the control group is comprised of all counties inside the Amazon Biome that do not satisfy them. To further control for differences between soy producing and non-soy producing counties, I use the Cerrado as a comparison group to the Amazon Biome, also applying the eligibility criteria for its counties.
To study the effect of the Soy Moratorium, I use two different empirical specifications. Two differences-in-differences (DD), one for the Amazon Biome and other for the soy producing counties, are used to better understand the dynamics affecting the counties in each of these groups. My main specification is a triple-differences estimation with year and county fixed effects. Placebos to test the parallel trends assumption are presented at the end of this section.
5.1 Differences-in-differences equations
To better capture the dynamics of deforestation in the Legal Amazon concerning the differences between the soy producing counties and the biomes, the first two estimating equations are the following DD
= + + { } { ∈ }+
and
= + + { } { ∈ }+
where is the deforestation measure at county and year , and are the county and year fixed effects, { ∈ } and { ∈ } indicates if county is inside the Amazon Biome and if it is a soy producer, { } indicates the period after the moratorium was signed and is the error. The coefficient of interest in both equations is as it captures any change in mean after 2006 for each of those groups.
With equation (1) I try to capture differential effects on soy producing counties relative to non-producing, such as those of rural credit conditioning for producers inside the Amazon Biome. Assunção et al. (2013), finds the credit conditioning affected differently cattle producers credit concession and crop producers’.
Similarly, equation (2) tries to capture differential effects on Amazon counties relative to Cerrado ones. The said conditioning is one example but as well as the blacklisting of Legal Amazon counties with high deforestation rates. Assunção et al. (2014) shows the priority action has reduced the deforestation in the Legal Amazon from 2008 to 2011 by 35%. Assunção et al. (2013) also shows that the credit conditioning curbed deforestation in the Amazon Biome. Note this is a slight modification to the strategy used by Gibbs et al. (2015): while it compares the Amazon Biome with the entire Cerrado, I compare the former only with the Cerrado portion of the Legal Amazon.
Note that neither (1) nor (2) tries to capture causal effects but, if the Soy Moratorium had any effect on deforestation, both estimations may give significant estimates for .
(1)
5.2 Triple-differences
Using the same definitions as before, my main estimation equation is
= + + { } { ∈ }+ { } { ∈ }+
{ } { ∈ } { ∈ }+
The coefficient of interest is as it captures the change in the mean deforestation, measured by , in soy producing counties and inside the Amazon Biome after the Soy Moratorium began. The identifying assumption needed for to be the causal effect of the Soy Moratorium on deforestation is that, on the absence of the agreement, the difference in the deforestation measure between soy producing and non-soy producing counties inside the Amazon Biome would have followed the same trend as the difference in the deforestation measure between soy producing and non-soy producing counties on the Cerrado portion of the Legal Amazon. The coefficient nets out any difference in the mean , starting in 2006, due to any change other than the Soy Moratorium occurring inside the Amazon Biome. The coefficient , on its turn, nets out any difference in the mean , starting in 2006, due to changes other than the moratorium affecting soy producing counties. If any of the previous DD estimations finds a significant effect I expect the coefficients for the Amazon Biome and for soy producing counties to lose at least part of their significance if the moratorium was indeed effective.
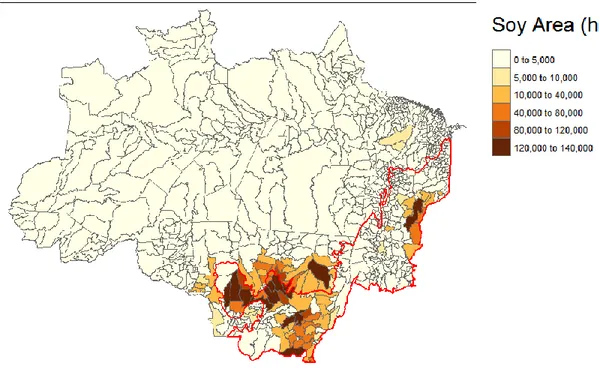
Note, however, as we can see in Figure 2, soy farming is concentrated close to the border between biomes. Therefore, lands too far away from it may not be good controls for soy producing counties. I account for this estimating the triple-differences, as well as both double-differences, for three different samples inside the Amazon Biome: the Full Sample, the 100km Sample and the 10km Sample. The Full Sample includes all counties within the biome. The 100km sample include all soy producing counties and all non-soy producing that intersect a 100km buffer around the soy producing ones. The 10km Sample include all soy producing counties and all non-soy producing that intersect a 10km buffer around the soy producing ones. The Cerrado sample was kept intact and was used alongside each of those samples.
Figure 2 - Soy planted area at each biome in 2006
The figure shows how the soy production was distributed at the Cerrado portion of the Legal Amazon (within the red border), and the Amazon Biome in 2006. Soy data for the Legal Amazon comes from two datasets: one contains soy data for the Amazon Biome and the other contains crop data for the Cerrado. The crop data may show not only soy, but also cotton and rice. However, since it was collected in the soy growing season and it is unlikely that any other crop is extensively produced at the same time, I use crop as if it were composed only by soy. Administrative data comes from IBGE and soy and crop data comes from Gibbs et al. (2015).
5.3 Testing pre-trend assumptions
Before turning to the results, it is useful to see how the specifications fare in tests for the pre-trend equality in all the three specifications, for both measures and for the main sample, the 10km sample. The tests for the other samples are in the Appendix (Tables A1 and A2).
In this test, I use equations (1), (2) and (3) with data ranging from 2001 to 2005 to detect possible differences in trends before the Soy Moratorium came into effect. The cutoff year is 2004 and I test the null hypothesis that trends before 2006 are equal for the treatment and control groups. For specifications (1) and (2), the double differences for soy producers and the Amazon Biome respectively, this means that should be equal zero and for specification (3), the triple differences, should be equal zero. Note that while these tests check for differences in deforestation trends in the first two specifications, in specification (3) it checks for different trends in the deforestation difference between soy producer counties and non-producers. For instance, rejecting the null hypothesis in the triple differences is to say the deforestation difference between soy producer counties and non-producers inside the Amazon biome follows a different path than the deforestation difference between soy producers and non-producers at the Cerrado portion of the Legal Amazon.
As we can see in Table 3 the tests reject the equal trends hypothesis for specification (1) with both measures but do not reject for specifications (2) and (3). This means deforestation in soy producing counties were already following a different path than non-producers at the Legal Amazon even prior to the Soy Moratorium but deforestation in Amazonian counties had the same trend than in those within the Cerrado. Note that even with parallel trends, the double difference for the biomes still cannot yield a causal effect for the moratorium, since it does not separate its effects from the PPCDAm. Also, the tests find no evidence of differential trends in the deforestation differences between soy producers and non-producers at the Amazon biome and between producers and non-producers at the Cerrado. Therefore, there are evidence that, in this sample, the counties at the Cerrado portion of the Legal Amazon form a good control group for the soy producer counties within the Amazon biome and their neighbors.
This table shows the results of the common pre-trend tests for the 10km sample. The data ranges from 2001 to 2005 and “post” means that year is greater than or equal 2004. The observation unit is the combination county x biome and there are 405 of them for all estimations. The specifications are two DD and one DDD. The two DD compare the Amazon and the Cerrado biomes and soy producing observation units with producers respectively. The DDD use the comparison between producing and non-producing units within the Cerrado as a control to the comparison between producers and non-producers within the Amazon Biome. For each specification and measure, I test the null hypothesis that trends before 2006 are equal and fixed effects are used for year and the “county x biome” combination. Errors are clustered by “county x biome” and are shown in parenthesis. Significant estimates indicate pre-trends are not equal. Significance levels are (***) 0.01 (**) 0.05 (*) 0.1.
DD Soy Producer DD Biomes DDD
(1) (2) (3)
Panel A. Deforestation Rate
Post2004*Producer -0.0017322** -0.001863** (0.0008429) (0.0009104) Post2004*InsideAmazon 0.0006951 0.0014164 (0.0009234) (0.0009119) Post2004*InsideAmazon*Producer -0.0005025 (0.0020251)
Panel B. Normalized Deforestation
Post2004*Producer -0.4485981*** -0.4783583*** (0.1142289) (0.1528194) Post2004*InsideAmazon -0.0903799 0.0032621 (0.1048613) (0.1263996) Post2004*InsideAmazon*Producer 0.0826396 (0.2290898) Table 3: Testing for pre-trends equality
6 RESULTS
Here I present the estimates for specifications (1), (2) and (3) for the 10km sample. Results for the 100km and the full samples are presented in the Appendix (Tables A3 and A4, respectively). As we can see in Table 4 the estimations for the deforestation rate gives negative and significant results for both differences-in-differences estimates of × and × . This is consistent with the belief the moratorium would have the effect to slowdown deforestation in the affected units. However, when we turn to the DDD estimates, we see that the coefficient for the agreement is not significant and the other two coefficients keep their direction and significance. Since the pre-trends test for this estimation did not reject the equal trends hypothesis, I interpret this as evidence the Soy Moratorium had no effect to slowdown the deforestation rate and, instead, that something else had a differential impact on counties inside the Amazon Biome and on soy producing counties in both biomes. This can also be seen on Table 5, which shows the non-parametric estimates for the Soy Moratorium: from 2001 to 2012, almost all coefficients, before and after 2006, are zero. The results for the normalized deforestation follow a similar pattern, with the coefficients for
× o and × o negative and significant for the three specifications. The difference, however, is that the coefficient for the moratorium is positive and significant. Since the pre-trend test did not reject the equal trends hypothesis for this estimation, I interpret this as indicative that the Soy Moratorium has caused an increase in deforestation. This can be seen in Table 5, where the coefficient’s mean from 2001 to 2005 is -1.5 and, from 2006 to 2012, close to -0.85.
Although these two results, the zero and the positive effects, are contradictory, both agree with the idea that the Soy Moratorium has not helped to reduce deforestation in the Amazon Biome.
This table shows the regression estimates of the coefficients of interest in specifications (1), (2) and (3) for the 10km sample. Panel A shows the estimates for the Deforestation Rate as the outcome, while Panel B does the same for the Normalized Deforestation. Soy producer is defined as a county with at least 5000ha in soy planted. The observation unit is the combination county x biome and there are 405 of them for all estimations. Fixed effects for year and observation units are used. Errors are clustered by observation units and are shown in parenthesis. The data ranges from 2001 to 2013 and "post" means that year is greater than or equal 2006. Significance levels are (***) 0.01 (**) 0.05 (*) 0.1
DD Soy Producer DD Biomes DDD
(1) (2) (3)
Panel A. Deforestation Rate
PostSoyM*Producer -0.0065563*** -0.0052455*** (0.0009397) (0.0008723) PostSoyM*InsideAmazon -0.0073783*** -0.0060542*** (0.0010589) (0.0009863) PostSoyM*InsideAmazon*Producer 0.0001103 (0.0022103)
Panel B. Normalized Deforestation
PostSoyM*Producer -0.9503369*** -1.007037*** (0.0841492) (0.1046186) PostSoyM*InsideAmazon -0.9116445*** -0.998959*** (0.0847608) (0.1091874) PostSoyM*InsideAmazon*Producer 0.7581451*** (0.1708812)
The table shows the nonparametric estimates for effect of the Soy Moratorium for each year from 2001 to 2012. Estimates for 2013 are omitted because of collinearity. The observation unit is the combination county x biome and there are 405 of them for both estimations. Estimates comes from the 10km sample and fixed effects for year and observation unit are used. Errors are clustered by county x biome and are shown in parenthesis. Significance levels are (***) 0.01 (**) 0.05 (*) 0.1.
Year Deforestation Rate Normalized Deforestation
2001 -.0039488 -1.5812830*** (.0028326) (0.3009085) 2002 -.0031698 -1.5787620*** (.0035494) (0.319287) 2003 .0003541 -1.4314480*** (.0041193) (0.3598853) 2004 .0001019 -1.4074830*** (.0039686) (0.3302261) 2005 -.0056167*** -1.4882340*** (.0018185) (0.2571988) 2006 -.0046523*** -1.1408860*** (.0014649) (0.2338658) 2007 -.0044376*** -0.6040136** (.0015242) (0.2353803) 2008 -.0020989 -0.8958685*** (.0014633) (0.2277223) 2009 -.002441 -0.7516933*** (.0015142) (0.2104639) 2010 -.0039172* -1.0708410*** (.0022905) (0.2746936) 2011 -.001451 -0.8944029*** (.0023411) (0.252769) 2012 .0002336 -0.5760932** (.0021235) (0.2697113)
Table 5: Nonparametric estimates for the effect of the Soy Moratorium on deforestation for each year
7 DISCUSSION
As argued before, the Soy Moratorium could fail to reduce deforestation for two reasons: low enforcement and the possibility for the producer to avoid its sanctions.
Table 1 shows that compliance to the agreement has been extremely high throughout the years, that is to say that only a small fraction of the soy planted in each year were raised in lands deforested after July 2006. But the idea criticized by the present work to the previous evaluations is that compliance is not enough evidence to support the claim that the Soy Moratorium has curbed deforestation at the studied period. If any other policy to reduce deforestation, namely those under the PPCDAm, were effective by the time of the moratorium, then compliance could have happened anyway and, as stated before, Assunção et al. (2014), Assunção et al. (2015) and Burgess et al. (2016) presents evidence they did work.
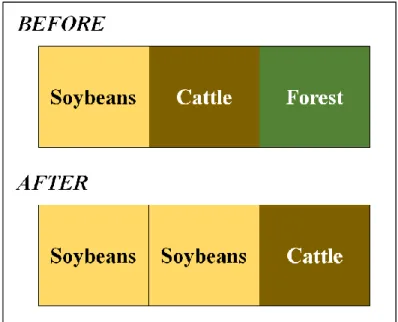
It is important to note, also, that previous evaluations looked only at direct deforestation. Therefore, even if the Soy Moratorium had inhibited soybeans into native forests, it may have caused indirect deforestation elsewhere. Let’s say there is a producer owning three plots of land: one with soy, one with cattle and one with a native forest that could be legally deforested. Under the agreement, the producer can be punished if they plant soy into the forest plot, but he could, instead, burn down the area, transfer the cattle raising to it and then plant soy into the now vacant plot without any punishment, as depicted in Figure 3. Indeed, Rudorff et al. (2011) and Brown and Koeppe (2013) points that soy is often not the first crop to be planted in recently deforested areas: rice is an alternative, usually to prepare the land to receive soybeans, as well as raising cattle if crop prices are too low (Rudorff et al. (2011)). Hence, it is possible that the soybean is displacing less lucrative products as a response to the moratorium.
Under the Soy Moratorium, the owner of three plots of lands as depicted at the top, in which the forest plot could be legally deforested under the Brazilian law, could increase its soy production by deforesting the forest plot, transferring the cattle to the now vacant area and then planting soy where the cattle was. All of it suffering none of the moratorium’s sanctions.
8 CONCLUSION
Many have pointed to the soybean expansion into the Amazon Biome as an important driver of its deforestation and to fight it, Greenpeace has pressed the soy industry to halt the production inside the biome. In response to the reputational threat, two of the biggest soy buyers’ associations has signed the Soy Moratorium. Seen as a successful program, it has been renewed annually despite the lack of effective evaluation.
In this work, I estimate double-differences and triple-differences regressions comparing the Amazon Biome to the Cerrado and soy producing counties with non-soy producing to study if a market ban on soybeans, and market bans in general, can help reduce deforestation. My results suggest the moratorium had no effect to curb deforestation.
Although only a first approach, this work may be seen as another evidence that a market ban may not work if there are forms of escaping its sanctions. Future research may look for another strategy such as changing the comparison groups, fining the observation unit from counties to pixels and even change the estimating equations. All to avoid possible confounders that were not eliminated by the chosen strategy.
REFERENCES
Andam, K. S., Ferraro, P. J., Pfaff, A., Sanchez-Azofeifa, G. A., & Robalino, J. A. (2008). Measuring the effectiveness of protected area networks in reducing deforestation. Proceedings of the National Academy of Sciences, 105(42), 16089-16094.
Antonaccio, L., Braga, N., Chiavari, J., Lopes, C. & Marques, D. (2016). Panorama dos direitos de propriedade no Brasil rural: legislação, gestão fundiária e Código Florestal. CPI. NAPC.
Assunção, J., Gandour, C., Hemsley, P., Rocha, R., & Szerman, D. (2013). Production & Protection: A First Look at Key Challenges in Brazil. CPI. NAPC.
Assunção, J., & Rocha, R. (2014). Getting greener by going black: The priority municipalities in brazil. CPI. NAPC Working Paper.
Assunção, J., Gandour, C., & Rocha, R. (2015). Deforestation slowdown in the Brazilian Amazon: prices or policies? Environment and Development Economics, 20(06), 697-722.
Brown, J. C., & Koeppe, M. (2013). Debates in the environmentalist community: The soy moratorium and the construction of illegal soybeans in the Brazilian Amazon.
Environment and the Law in Amazonia: A Plurilateral Encounter. Sussex Academic, pp.110-126
Burgess, R., Costa, F., & Olken, B. A. (2016). The Power of the State: National Borders and the Deforestation of the Amazon. Unpublished paper.
Casa Civil (2004). Plano de Ação para a Prevenção e Controle do Desmatamento na Amazônia Legal.
Chimeli, A., & Soares, R. R. (2011). The use of violence in illegal markets: Evidence from mahogany trade in the Brazilian Amazon. Institute for the Study of Labor. IZA discussion paper
Dell, M. (2014). Trafficking Networks and the Mexican Drug War. Working Paper
Dragusanu, R., Giovannucci, D., & Nunn, N. (2014). The economics of fair trade. The Journal of Economic Perspectives, 28(3), 217-236.
Fearnside, P. M. (2001). Soybean cultivation as a threat to the environment in Brazil. Environmental Conservation, 28(01), 23-38.
Gibbs, H. K., Rausch, L., Munger, J., Schelly, I., Morton, D. C., Noojipady, P., Soares-Filho, B., Barreto, P., Micol, L. & Walker, N. F. (2015). Brazil's soy moratorium. Science,
347(6220), 377-378.
Greenpeace (2006). Eating Up the Amazon. Greenpeace International.
G. Trabalho da Soja (2008). Mapping and Monitoring of the Soy Moratorium. www.abiove.org.br
G. Trabalho da Soja (2009). 2º Ano de Mapeamento e Monitoramento da Soja no Bioma Amazônia. www.abiove.org.br
G. Trabalho da Soja (2010). 3º Ano de Mapeamento e Monitoramento do Plantio Soja no Bioma Amazônia. www.abiove.org.br
G. Trabalho da Soja (2011). 4º Ano de Mapeamento e Monitoramento do Plantio Soja no Bioma Amazônia. www.abiove.org.br
G. Trabalho da Soja (2012). 5º Ano de Mapeamento e Monitoramento do Plantio Soja no Bioma Amazônia. www.abiove.org.br
G. Trabalho da Soja (2013). Mapeamento e Monitoramento do Plantio Soja no Bioma Amazônia - 6º ano. www.abiove.org.br
G. Trabalho da Soja (2014). 7º Ano de Mapeamento e Monitoramento do Plantio Soja no Bioma Amazônia. www.abiove.org.br
G. Trabalho da Soja (2015). Moratória da Soja. www.abiove.org.br
G. Trabalho da Soja (2016). Moratória da Soja – Safra 2015/2016. www.abiove.org.br
Hansen, M. C., Potapov, P. V., Moore, R., Hancher, M., Turubanova, S. A., Tyukavina, A., Thau, D., Stehman, S. V., Goetz, S. J., Loveland, T. R., Kommareddy, A., Egorov, A., Chini, L., Justice, C. O., Townshend, J. R. G. (2013). High-resolution global maps of 21st-century forest cover change. Science, 342(6160), 850-853.
Lemieux, A. M. & Clarke, R. V. (2009). The international ban on ivory sales and its effects on elephant poaching in Africa. British Journal of Criminology, 49(4), 451-471.
Ministério do Meio Ambiente (2017). Controle e Prevenção do Desmatamento.
http://www.mma.gov.br/florestas/controle-e-preven%C3%A7%C3%A3o-do-desmatamento. Accessed in 3/25/2017.
Nobre, A. D. (2014). The future climate of Amazonia, Scientifc Assessment Report. Sponsored by CCST-INPE, INPA and ARA. São José dos Campos, Brazil.
Pfaff, A., Robalino, J., Sanchez-Azofeifa, A., Andam, K., & Ferraro, P. (2009). Location affects protection: Observable characteristics drive park impacts in Costa Rica. The BE Journal of Economic Analysis & Policy, 9, 1-24.
Pfaff, A., Amacher, G. S., & Sills, E. O. (2013). Realistic REDD: Improving the forest impacts of domestic policies in different settings. Review of Environmental Economics and Policy, 7(1), 114-135.
Rudorff, B. F. T., Adami, M., Aguiar, D. A., Moreira, M. A., Mello, M. P., Fabiani, L., Amaral, D. F. & Pires, B. M. (2011). The soy moratorium in the Amazon biome monitored by remote sensing images. Remote Sensing, 3(1), 185-202.
Schlenker, W., & Villas-Boas, S. B. (2009). Consumer and market responses to mad cow disease. American Journal of Agricultural Economics, 91(4), 1140-1152.
This table shows the results of the common pre-trend tests for the 100km sample. The data ranges from 2001 to 2005 and “post” means that year is greater than or equal 2004. The observation unit is the combination county x biome and there are 491 of them for all estimations. The specifications are two DD and one DDD. The two DD compare the Amazon and the Cerrado biomes and soy producing units with non-producers respectively. The DDD use the comparison between producers and non-producers within the Cerrado as a control to the comparison between producers and non-producers within the Amazon Biome. For each specification and measure, I test the null hypothesis that trends before 2006 are equal and fixed effects are used for year and observation unit. Errors are clustered by “county x biome” and are shown in parenthesis. Significant estimates indicate pre-trends are not equal. Significance levels are (***) 0.01 (**) 0.05 (*) 0.1.
APENDIX – ROBUSTNESS CHECKS
DD Soy Producer DD Biomes DDD
(1) (2) (3)
Panel A. Deforestation Rate
Post2004*Producer -0.0015127* -0.001863** (0.0008427) (0.0009099) Post2004*InsideAmazon 0.0001299 -0.0000392 (0.0006259) (0.0006164) Post2004*InsideAmazon*Producer 0.0009531 (0.0019094)
Panel B. Normalized Deforestation
Post2004*Producer -0.3629223*** -0.482062*** (0.1118377) (0.1527513) Post2004*InsideAmazon -0.1821915** -0.2483661** (0.0871073) (0.0967199) Post2004*InsideAmazon*Producer 0.3457398 (0.2153592) Table A1: Testing for pre-trends equality in the 100km sample
This table shows the results of the common pre-trend tests for the full sample. The data ranges from 2001 to 2005 and “post” means that year is greater than or equal 2004. The observation unit is the combination county x biome and there are 869 of them for all estimations. The specifications are two DD and one DDD. The two DD compare the Amazon and the Cerrado biomes and soy producing observation units with non-producers respectively. The DDD use the comparison between non-producers and non-non-producers within the Cerrado as a control to the comparison between producers and non-producers within the Amazon Biome. For each specification and measure, I test the null hypothesis that trends before 2006 are equal and fixed effects are used for year and observation unit. Errors are clustered by “county x biome” and are shown in parenthesis. Significant estimates indicate pre-trends are not equal. Significance levels are (***) 0.01 (**) 0.05 (*) 0.1.
DD Soy Producer DD Biomes DDD
(1) (2) (3)
Panel A. Deforestation Rate
Post2004*Producer -0.0011857 -0.001863** (0.0008334) (0.0009088) Post2004*InsideAmazon -0.0001683 -0.0005129 (0.0004088) (0.0003968) Post2004*InsideAmazon*Producer 0.0014268 (0.0018483)
Panel B. Normalized Deforestation
Post2004*Producer -0.2461099** -0.482062*** (0.1073348) (0.1525785) Post2004*InsideAmazon -0.2103889*** -0.3016168*** (0.0708272) (0.0745134) Post2004*InsideAmazon*Producer 0.3989905* (0.2061391) Table A2: Testing for pre-trends equality in the full sample
This table shows the regression estimates of the coefficients of interest in specifications (1), (2) and (3) for the 100km sample. Panel A shows the estimates for the Deforestation Rate as the outcome, while Panel B does the same for the Normalized Deforestation. Soy producer is defined as a county with at least 5000ha in soy planted. The observation unit is the combination county x biome and there are 491 of them for all estimations. Fixed effects for year and observation units are used. Errors are clustered by observation units and are shown in parenthesis. The data ranges from 2001 to 2013 and "post" means that year is greater than or equal 2006. Significance levels are (***) 0.01 (**) 0.05 (*) 0.1
DD Soy Producer DD Biomes DDD
(1) (2) (3)
Panel A. Deforestation Rate
PostSoyM*Producer -0.0058644*** -0.0052455*** (0.0009391) (0.0008719) PostSoyM*InsideAmazon -0.0051104*** -0.0046977*** (0.0007091) (0.0006403) PostSoyM*InsideAmazon*Producer -0.0012462 (0.0020782)
Panel B. Normalized Deforestation
PostSoyM*Producer -0.8403373*** -1.007037*** (.0823994) (0.1045694) PostSoyM*InsideAmazon -0.6697808*** -0.7626985*** (0.0810957) (0.0902988) PostSoyM*InsideAmazon*Producer 0.5218846*** (0.1594242) Table A3: Effect of Soy Moratorium on Deforestation (100km Sample)
This table shows the regression estimates of the coefficients of interest in specifications (1), (2) and (3) for the full sample. Panel A shows the estimates for the Deforestation Rate as the outcome, while Panel B does the same for the Normalized Deforestation. Soy producer is defined as a county with at least 5000ha in soy planted. The observation unit is the combination county x biome and there are 869 of them for all estimations. Fixed effects for year and observation units are used. Errors are clustered by observation units and are shown in parenthesis. The data ranges from 2001 to 2013 and "post" means that year is greater than or equal 2006. Significance levels are (***) 0.01 (**) 0.05 (*) 0.1
DD Soy Producer DD Biomes DDD
(1) (2) (3)
Panel A. Deforestation Rate
PostSoyM*Producer -0.0054106*** -0.0052455*** (0.000919) (0.0008711) PostSoyM*InsideAmazon -0.0025679*** -0.0030576*** (0.0004162) (0.00035713) PostSoyM*InsideAmazon*Producer -0.0028863 (0.00201)
Panel B. Normalized Deforestation
PostSoyM*Producer -0.9019522*** -1.007037*** (0.0762412) (0.1044686) PostSoyM*InsideAmazon -0.1562603** -0.2924196*** (0.0635452) (0.0635852) PostSoyM*InsideAmazon*Producer 0.0516057 (0.1458494)