© FECAP
DOI: 10.7819/rbgn.v16i50.959
Subject Area: Marketing
RBGN
Consumer involvement with products:
comparison of pii and Nip scales
in the Brazilian context
Envolvimento do consumidor com o p
roduto: comparação das escalas pII e NIp no
contexto brasileiro
Envolvimiento del consumidor con productos: una comparación de las escalas pII
y NIp en el contexto brasileño
Victor Manoel Cunha de Almeida1 Natalie Bragança Düsenberg2
Received on May 6, 2011 / Approved on March 11, 2014 Responsible editor: João Maurício Gama Boaventura, Dr. Evaluation process: Double Blind Review
1. Doctor in Administration and Professor at Federal University of Rio de Janeiro [[email protected]]
2. Master in Administration and Researcher at Federal University of Rio de Janeiro [[email protected]]
Authors’ address: Rua Pascoal Lemme, 355 - Ilha do Fundão - CEP 21941-918 - Rio de Janeiro – RJ - Brazil
ABSTRACT
This study aims to evaluate the extent to which two scales of consumer involvement with products converge: PII (Personal Involvement Inventory), by Zaichkowsky (1994), and NIP (New Involvement Profile), by Jain and Srinivasan (1990). The literature review encompasses the main studies on measuring the involvement of consumers with products. Data was collected through a survey that was applied to a non-probabilistic quota sample of undergraduate students from different institutions across the state of Rio de Janeiro. A total of 1,122 questionnaires were collected, of which 1,025 (91.4%) were considered valid. In order to investigate the different levels of consumer involvement through
the convergence of the scores of these scales suggests the possibility of comparing results of studies, using either scale.
Keywords: Consumer behavior. Consumer involvement with products. PII scale. NIP scale.
RESUMO
O estudo objetiva avaliar o grau de convergência de classificação entre os escores de duas escalas de envolvimento do consumidor: PII (Personal Involvement Inventory) de autoria de Zaichkowsky (1994) e NIP (New Involvement Profile) de autoria de Jain e Srinivasan (1990). O referencial teórico contempla os principais estudos sobre a mensuração do envolvimento do consumidor com o produto. Os dados foram coletados por meio de uma survey aplicada a uma amostra não probabilística, selecionada por cotas, composta por estudantes de instituições de ensino superior do estado do Rio de Janeiro. Foram coletados 1.122 questionários, sendo 1.025 válidos (91,4%). Para investigar diferentes níveis de envolvimento dos consumidores em relação às categorias de produtos, foram utilizados quatro produtos − tênis, telefone celular, bebida esportiva e refrigerante. Utilizando-se a Anova e os testes post hoc, verificou-se a existência de diferenças significativas nas respostas entre os grupos de produtos. Para testar a hipótese substantiva do estudo, avaliou-se o grau de convergência de classificação das escalas PII e NIP utilizando-se o teste de correlação de Spearman, bem como a observação da proporção de coincidência de classificação dos escores. A independência dos escores foi avaliada por meio do teste Qui-quadrado. Os resultados suportam uma alta convergência de classificação dos casos. A contribuição principal do estudo reside, portanto, no teste empírico das escalas PII e NIP no contexto brasileiro. Adicionalmente, a convergência dos escores dessas escalas sugere a possibilidade de comparação de resultados de estudos, que utilizem quaisquer dessas escalas.
Palavras-chave: Comportamento do consumidor. Envolvimento do consumidor com o produto. Escala PII. Escala NIP.
RESUMEN
El objetivo de este estudio es evaluar el grado de convergencia de dos escalas de implicación del consumidor con el producto: PII (Personal Involvement Inventory) de autoría de Zaichkowsky (1994) y NIP (New Involvement Profile) de autoría de Jain y Srinivasan (1990). El referencial teórico contempla los principales estudios sobre la medición de la implicación de los consumidores con el producto. Los datos fueron recogidos a través de una encuesta aplicada a una muestra no probabilística por cuotas, compuesta por estudiantes de las instituciones de educación superior en el estado de Río de Janeiro. Se recogieron 1.122 cuestionarios, de los cuales 1.025 cuestionarios fueron válidos (91,4%). Para investigar los diferentes niveles de implicación de los consumidores en relación con las categorías de productos, hemos utilizado cuatro productos - zapatillas de deporte, teléfono celular, bebidas deportivas y gaseosas. Utilizando análisis de la varianza (ANOVA) y pruebas post hoc, se comprobó la existencia de diferencias significativas en las respuestas entre los grupos de productos. Con el objetivo de probar la hipótesis de fondo del estudio, se evaluó el grado de convergencia para la clasificación de las escalas PII y NIP utilizándose el test de correlación de Spearman, así como la observación de la proporción de la coincidencia de calificación de las puntuaciones. La independencia de las puntuaciones fue evaluada mediante el test de Chi-cuadrado. Los resultados muestran una alta convergencia de la clasificación de los casos. La contribución principal del estudio consiste, por lo tanto, en el test empírico de las escalas PII y NIP en el contexto brasileño. Además, la convergencia de la puntuación de las escalas sugiere la posibilidad de comparación de los resultados de estudios que usen cualquiera de las escalas.
Palabras clave: Comportamiento del consumidor. Implicación del consumidor con los productos. Escala PII. Escala NIP.
1 INTRODUCTION
field, and specifically of the consumer behavior field from the studies of Krugman (1965, 1966). With the increase of researches on the consumer’s behavior field in the 1980’s, the conceptualization and measuring of consumers’ involvement became the focus of researchers’ attention (MICHAELIDOU, DIBB, 2006), transforming the topic on a key concern in the consumer research field (JAIN, SRINIVASAN, 1990; McQUARRIE, MUNSON, 1987).
Literature provides several scales to measure the consumer involvement with products (ZAICHKOWSKY, 1985, 1994; LAURENT, KAPFERER, 1985; McQUARRIE, MUNSON, 1987, 1992; JAIN, SRINIVASAN, 1990), also adapted to the Brazilian context (FONSECA, ROSSI, 1998, 1999; ROCHA, 1988; HEPP, 2008).
Despite the various mentioned studies, there is no peaceful agreement in marketing literature about which scale would be more appropriate to measure consumer involvement with products. Consequently, different studies have been using different scales, turning results comparison difficult, since there is no clear evidence of how convergent such different scales results are.
The contribution of this study is thus to empirically test two consumer involvement scales in the Brazilian context: PII (Personal Involvement Inventory), by Zaichkowsky (1994), and NIP (New Involvement Profile),by Jain and Srinivasan
(1990). Three are the specific objectives of this study: a) examining the reliability and validity of the PII scale; b) examining the reliability and validity of the NIP scale; and c) comparing the scores of such scales to check their degree of convergence.
This study answers the demands of Fonseca and Rossi (1998), who make an alert about the limited number of researches on involvement in Brazil, and suggest the use of the scale by Jain and Srinivasan (1990) to reinforce its validation or even to develop other scales on the consumer involvement with the aim of proceeding with researches on the subject. Rocha (1988) suggests the development of researches on the influence of the consumer involvement on
the decision-making process, on the pursuit of information and on the extension of the influence of reference groups. At last, Hepp (2008) suggests that subsequent studies validate Zaichkowsky scale (1994) by using more sophisticated statistical techniques.
2 THEORETICAL REFERENTIAL
There are various different applications of the word “involvement” in literature, and this is possibly the consequence of several definitions and measurements of involvement (ZAICHKOWSKY, 1985). Despite the existence of several definitions for involvement, there is though a certain consensus that the high degree of involvement means personal relevance or importance. (GREENWALD, LEAVITT, 1984). To Engel, Blackwell and Miniard (2000), involvement is the degree of perceived personal relevance of a product or service in a given context. According to Czinkota (2001, p. 148), “involvement is a matter of degree – how relevant or central a product is”. The definition of involvement most found in literature is proposed by Zaichkowsky (1985, p. 342): “Perceived object relevance based on needs, values and interests inherent to the person”. Other authors use the same definition (CELSI, OLSON, 1988; SOLOMON, 2002; FONSECA, ROSSI, 1998; BAUER, SAUER, BECKER, 2006).
Zaichkowsky (1985) proposes the existence of three types of involvement: with the advertisement, with the product and with the buying decision. The involvement with advertisement, also called message-response involvement by Solomon (2002), is related to the degree of attention given to the advertisement. The involvement with the product is related to the degree of interest of a consumer in a certain product, and the involvement with the purchase is related to the differences in buying the same object in different contexts (SOLOMON, 2002).
be followed”. Quester and Smart (1998) report that consumer’s behavior is influenced by the degree of involvement with the product and by the anticipated consumption situation. To Michaelidou a Dibb (2006), the background of the involvement with the product seems to vary according to the product category. According to Schiffman and Kanuk (1997, p. 154), “the degree of involvement of a consumer depends on the degree of personal applicability such product offers him/her”. High involvement purchases are those with high risk involved, and thus resulting in a higher information processing.
Several scales were proposed to measure the involvement of consumers, which shows the complexity of measuring it (FONSECA, ROSSI, 1998). In 1985, Zaichkowsky developed the Personal Involvement Inventory (PII) scale. Back in that same year, Laurent and Kapferer developed the Consumer Involvement Profile (CIP) scale. In 1990, Jain and Srinivasan proposed and validated the New Involvement Profile (NIP) scale. According to Fonseca and Rossi (1998), the proposition of Zaichkowsky and Laurent and Kapferer scales is a major event in the development of the involvement concept and its measurement. McQuarrie and Munson (1987) also highlight the great contribution given by such authors to the topic.
2.1 Personal Involvement Inventory (PII) scale
The PII developed by Zaichkowsky (1985) is bipolar, composed of 20 items, which despite having two dimensions – affective and cognitive – generates a single score corresponding to the degree of consumer involvement. According to the author, the scale can be used to measure the involvement with advertisement, with product and with the buying decision.
McQuarrie and Munson (1987) have tested the PII scale, purifying it from 20 to 14 items, stating that such action would reduce the respondents’ tiredness and would save time for interviewers. In a subsequent study, McQuarrie and Munson (1992) validated the PII scale and observed that it is reliable and capable of
predicting behaviors associated to involvement, in addition to discriminate various products and different situations. The scale resulting from the study has ten items and use shorter and simpler words. Authors though highlight limitations of the PII scale, such as the incapacity of discriminating degrees of temporary involvement in different situations, being too long and difficult to understand.
To answer the critics and show the applicability of the scale, Zaichkowsky (1994) revised her original scale, reducing from 20 to 10 the measurement items, with no significant damages to its reliability.
2.2 Consumer Involvement Profile (CIP) scale
single dimension for the product sneakers. For the product ballpoint pen, the symbolic value and pleasure resulted in a single dimension. In the research by Rodgers and Schneider (1993), where the CIP scale was tested in four product categories (electronic equipment, audio recorders, cars and clothing), the union of the importance and pleasure dimensions was observe in all those products.
2.3 New Involvement Profile (NIP) scale
Jain and Srinivasan (1990) conducted an empirical test of comparison between the scales proposed by Ratchford (1987), Higie and Feick (1989), McQuarrie and Munson (1987), Zaichkowsky (1985) and Laurent and Kapferer (1985). Authors have concluded that a unidimensional scale is not capable of capturing the complexity of involvement. Furthermore, the authors observed that, collectively, the set of items used in such studies encompasses the same aspects captured by the items used by Laurent and Kapferer (1985). The authors thus propose a new scale with 15 items and five dimensions: relevance, pleasure, symbolic value, risk importance and risk probability. The dimension relevance was proposed based on Zaichkowsky work (1985), and the other dimensions were proposed as a way to perfect the original work by Laurent and Kapferer (1985), acknowledged in the own name of the proposed scale: NIP.
2.4 Hypothesis of this study
Despite of the NIP scale being validated in the Brazilian context at the end of the 1990s, (FONSECA, ROSSI, 1998), which would be an evolved alternative based on the CIP and PII scales (JAIN, SRINIVASAN, 1990), the use of the PII scale is still observed to measure the consumer involvement with products (HEPP, 2008). Therefore, in view of the critics to the PII scale (MCQUARRIE, MUNSON, 1987, 1992; JAIN, SRINIVASAN, 1990), despite the argumentations to the contrary given by Zaichkowsky (1994), and also considering that
there is no peaceful agreement in literature on which would be the most appropriate scale to measure the degree of the consumer involvement with products, the proposition of the following substantive hypothesis is opportune:
Hypothesis: In the Brazilian context, the scores of the consumer involvement with products, measure with the PII scale significantly differ from the scores measured with the NIP scale.
3 METHOD
3.1 Sample and data collection
This study uses a non-probabilistic sample, selected per quotas, composed of undergraduate students, from public and private superior education institutions (IES). Data were collected through a self-administered survey held with undergraduate students of the state of Rio de Janeiro. Questionnaires were applied in 47 classrooms of 13 IES (9 private and 4 public), of Rio de Janeiro state. The access to classrooms was possible through a prior contact with various professors from 26 different undergraduate courses. We can say, in favor of the use of a students’ sample in this study, that this bias has equally affected the responses of respondents in measuring both scales, thus not affecting the comparison of PII and NIP scores. The sample with college students was also used in other studies related with the involvement with products (PETTY, CACIOPPO, SCHUMANN, 1983; SALEEM, 2007; SCHAEFER, KEILLOR, 1997).
of the investigated products: 253 about sneakers, 259 about mobile phone, 255 about sports drink, and 258 about soft drink.
3.2 Operationalization of variables
In this study, it was decided to analyze both scales of consumer involvement with products most used in Brazilian studies: New Involvement Profile (NIP), by Jain and Srinivasan (1990), and the revised Personal Involvement Inventory (PII), developed by Zaichkowsky (1994). NIP scale was adapted to Portuguese by Fonseca and Rossi (1999), and has 15 items measured through the seven scores semantic differential scale, three for each of the five dimensions: relevance, pleasure, symbolic value, risk importance and risk probability. The PII scale measure the consumer involvement with products through 10 items, measured through a seven scores semantic differential scale, five for each of its two dimension: affective and cognitive. This scale was adapted to Portuguese by Hepp (2008).
Different from the NIP scale, which has one score for each dimension, the PII scale has a single general score. Therefore, for comparison effect, a General NIP score was operationalized from the scoring obtained for each dimension in each product.
3.3 Categories of products
The choice of test categories for this study – sneakers, mobile phone, sports drink and soft drink – was motivated by the different involvement degrees expected from consumers in regard to the product categories. In addition, products already used in previous researchers were preferred. Products were introduced without mentioning brands to prevent influencing the perception of respondents.
The category “sports drink” was used in Shuart (2007) and Garland and Ferkins (2003) studies to check the effectiveness of sports celebrities endorsement in the United States and New Zealand, respectively. Sawatari (2005) in his study investigates the impact of the
sports celebrity gender on the consumption of “sports sneakers”. “Clothing and sneakers” were considered high involvement categories in the research by Keillor, Parker and Schaefer (1996). The categories “mobile phone” and “clothing” are presented as high involvement products in the research conducted by Larán and Rossi (2006) in Brazil about the role of surprise in the satisfaction formation process. Saleem (2007) uses the category “mobile phone” as a high involvement product in his study with the aim of comparing the effect of using one or several celebrities in advertisements of high and low involvement products. Freire, K; Freire, W and Nique (2005) have used the category “soft drink” in their study about the loyalty to brands with a low involvement product.
3.4 Analysis of results
Firstly, a univariate analysis of data was conducted. Subsequently, the existence of significant difference in the groups (different products) answers was checked by using Anova and post hoc tests. When the homogeneity of the sample variance was not supported, the post hoc
test T2 of Tamhane (TAMHANE, 1977) was used.
The validity of constructs was also appraised. To Hair Jr et al. (2006, p. 137) “validity is the degree to which a scale or set of measurements precisely represent the concept of interest”. The most commonly used three forms of validity are the convergent, the discriminating and the nomological ones. The nomological validity, which examines whether the scale faithfully reproduces the relations established by the theory or prior studies, was not examined in this study, because it was already broadly discussed by the creators of the PII and NIP scales. The convergent and discriminating validity was done through the examination of the factorial analysis load factors and of the correlation factors among the variables composing each construct, and among the variables belonging to the different constructs (HAIR JR et al., 2005).
At last, an investigation about the homoscedasticity of the scales scores was conducted. According to Hair Jr (2006, p. 83), the homoscedasticity assumption implies that the dependent variable (in this case, the score) has equal levels of variance for different levels of predicting variables. According to this author, the homoscedasticity is desirable because “the variance of the dependent variables explained in a given dependency relation.
3.5 Test of the study substantive hypothesis
The substantive hypothesis of the study that proposes that the scores of the consumer involvement with the product, measured with the PII scale, significantly differ of the scores measured with the NIP scale, was tested through the analysis of the PII score correlation with the General NIP score, by using the non-parametric correlation test (ρ) of Spearman (SIEGEL, 1975). In addition, the substantive hypothesis was retested through the analysis of the score classification convergence. For that, two dummy variables were operationalized to dichotomically represent the degree of involvement with the product respectively using the General NIP score and the PII score. The median of each score was used as parameter to separate
respondents into two groups: low involvement and high involvement. The evaluation of the score classification convergence was done by means of the analysis of the score classification coincidence proportion. To check the statistical proportion significance, the non-parametric Chi-square (χ2)
test of Pearson was used, for being appropriate to test the independence of inherently categorical variables (SIEGEL, 1975). The Phi (φ) coefficient was used to evaluate the strength of the association among dichotomic variables (DANIEL, 1990; COHEN, 1988).
4 RESULTS
4.1 Personal Involvement Inventory scale
To validate the Personal Involvement Inventory (PII) scale of Zaichkowsky (1994), an Exploratory Factorial Analysis (EFA) was conducted, using the principal axis factoring
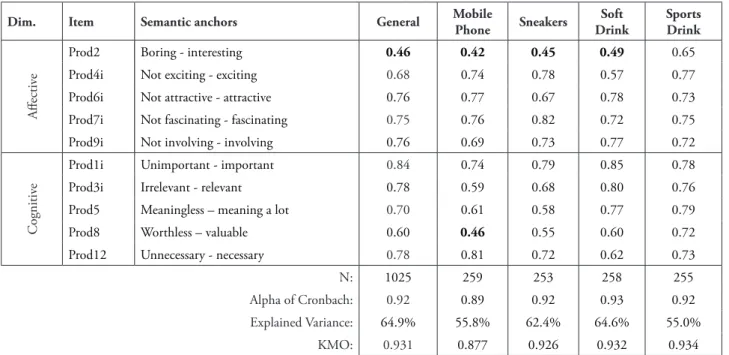
technique, to preserve the correlation among factors, with orthogonal rotation (Varimax), thus reproducing the procedures used by the scale creator. To extract the factors, a self-value criterion (eingenvalue) higher than 1 was used, resulting in two dimensions for the scale (KMO = 0.931), with total explained variance of 64.9% (see Table 1).
in English to Portuguese, and obtains the most expressive opposed adjectives for the construction of a bipolar scale. To the anchor interesting, the adjective “uninteresting” was more relatively frequent (66.2%), followed by “boring” (18.5%), and all the other adjectives had low frequencies, totalizing 15.4%. We can thus speculate that the use of the adjectives “uninteresting” / “interesting” to anchor the poles of the Prod2 variable could me more adequate.
4.1.1Test of the PII scale per product
In the study by Zaichkowsky (1994), the test of the scale for the ice-cream and fitness equipment products suggests two dimensions, as expected by the author. However, the test with the soft drink product showed only one dimension, with extracted variance of 71%, and with all load factors higher than 0.66. In her conclusions, the authors highlights that the separation between the affective and cognitive dimensions is not clear, suggesting new studies. It is also noteworthy that, in the study by this author, the fitness equipment, the item Prod9i (not involving) had a load factor of 0.23 in the affective dimension, and 0.52 in the cognitive dimension, opposed to the expected (see Table 1). In this study, the PII scale was tested by using four different products, splitting the sample into four sub-samples (mobile phone, sneakers, soft drink and sports drink). An EFA was conducted for each of the sub-samples. The two-dimensionality of the scale was observed for three products: Mobile phone (KMO = 0.877 and total explained variance = 55.8%); sneakers (KMO = 0.926 and total explained variance = 62.4%); and
soft drink (KMO = 0.932 e and total explained variance = 64.6%). For the sports drink product though, a single dimension was observed (KMO = 0.934 and total explained variance = 55.0%). Some items had load factors below the suggested limit of 0.50 according to the practical rule (HAIR JR et al., 2006).
4.1.2Reliability
TABLE 1 - Exploratory factorial analysis
Dim. Item Semantic anchors General Mobile
Phone Sneakers
Soft Drink
Sports Drink
Affectiv
e
Prod2 Boring - interesting 0.46 0.42 0.45 0.49 0.65
Prod4i Not exciting - exciting 0.68 0.74 0.78 0.57 0.77
Prod6i Not attractive - attractive 0.76 0.77 0.67 0.78 0.73
Prod7i Not fascinating - fascinating 0.75 0.76 0.82 0.72 0.75
Prod9i Not involving - involving 0.76 0.69 0.73 0.77 0.72
Cognitiv
e
Prod1i Unimportant - important 0.84 0.74 0.79 0.85 0.78
Prod3i Irrelevant - relevant 0.78 0.59 0.68 0.80 0.76
Prod5 Meaningless – meaning a lot 0.70 0.61 0.58 0.77 0.79
Prod8 Worthless – valuable 0.60 0.46 0.55 0.60 0.72
Prod12 Unnecessary - necessary 0.78 0.81 0.72 0.62 0.73
N: 1025 259 253 258 255
Alpha of Cronbach: 0.92 0.89 0.92 0.93 0.92
Explained Variance: 64.9% 55.8% 62.4% 64.6% 55.0%
KMO: 0.931 0.877 0.926 0.932 0.934
Source: the authors.
4.1.3Convergent and discriminating validity
Spearman’s ranks correlation tests conducted support the convergent validity, since all the correlations between the scale items were significant (p value < 0.01), and had values above the suggested limit of 0.30 (HAIR JR et al., 2006; BEARDEN, NETMEYER, 1999). The analysis of the load factor of the variables composing each factor (general EFA for all the products) also allows to support the convergent validity of the scale, since nine of the ten scale items had a load factor equal or above 0.50, the limit suggested according to the practical rule (HAIR JR et al., 2006). The item Prod2 (boring) had a load factor equal to 0.46, although above 0.40, the acceptable limit for samples with more than 200 cases (N = 1025) (HAIR JR et al., 2006). The discriminating validity was observed through the test of Spearman’s ranks correlation between the items of different dimensions of the scale (HAIR JR et al., 2006). We though observe that it is not possible to support the discriminating validity between the affective and cognitive dimensions of the scale. All the correlations between the items of the scale’s two dimensions were significant (p value < 0.01), and exceeded the suggested limit of
0.30 (HAIR JR et al., 2006, p. 137; BEARDEN, NETMEYER, 1999). However, considering that the calculation of score of the PII scale disregards the two-dimensional nature of the scale (because it results from the sum of all variables), it is not so relevant to criticize the discriminating validity of constructs.
4.1.4 PII score of the involvement with the product
TABLE 2 – PII score per product
Product N Score (PII) Low involvement Medium involvement High involvement
Average SD N % N % N %
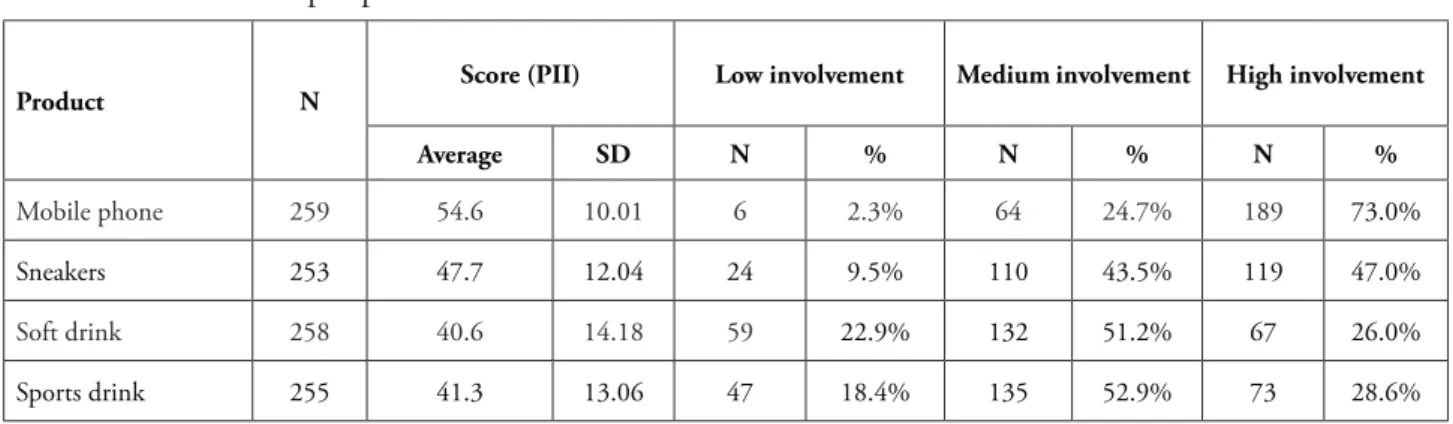
Mobile phone 259 54.6 10.01 6 2.3% 64 24.7% 189 73.0%
Sneakers 253 47.7 12.04 24 9.5% 110 43.5% 119 47.0%
Soft drink 258 40.6 14.18 59 22.9% 132 51.2% 67 26.0%
Sports drink 255 41.3 13.06 47 18.4% 135 52.9% 73 28.6%
Source: the authors.
4.1.4.1Differences in the PII score per product
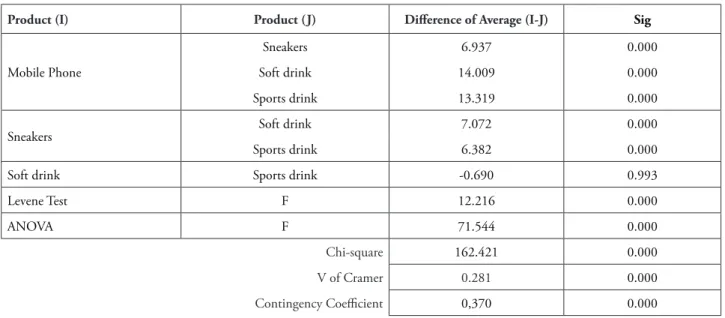
It was observed through the Anova (see Table 3) that there is a significant difference of averages among the four types of products investigated (F = 71.544; p value < 0.01). The hypothesis of variance homogeneity was rejected through the Levene test (F = 12.216; p value < 0.01). The existence of average differences between each pair of product groups was investigated by the T2 test of Tamhane, which
allowed the observation of a significant difference of score averages between all the studied products, except for the soft drink and sports drink pair. The existence of differences in the degree of involvement with the product (low, medium or high) was also investigated for the four product groups. The χ2 test allowed to reject the hypothesis
of sample homogeneity (χ2 = 162.421; p value
< 0.01). It was thus observed the existence of significant differences in the degree of involvement with the product for different products. The V indicator of Cramer (0.28; p valor < 0.01) and the Contingency Coefficient (0.37; p valor < 0.01) thus reveal that the association strength is from weak to moderate. A possible explanations would be the heteroscedasticity characteristic of the PII scale.
TABLE 3 – Anova and levene test
Product (I) Product (J) Difference of Average (I-J) Sig
Mobile Phone
Sneakers 6.937 0.000
Soft drink 14.009 0.000
Sports drink 13.319 0.000
Sneakers Soft drink 7.072 0.000
Sports drink 6.382 0.000
Soft drink Sports drink -0.690 0.993
Levene Test F 12.216 0.000
ANOVA F 71.544 0.000
Chi-square 162.421 0.000
V of Cramer 0.281 0.000
Contingency Coefficient 0,370 0.000
Source: the authors.
In Graph 1 we can see the distribution of frequencies of the PII score for each investigated product. It is noteworthy that products with a smaller average PII score have a bigger dispersion. We can thus speculate that the predicting power of the PII scale for products with high involvement is perhaps bigger than for the products of low involvement.
4.1.4.2 Heteroscedasticity of the PII score
Levene tests conducted for the PII score average per product revealed the heterogeneity of the variance, showing the violation of the homoscedasticity assumption. In this study, we observed that the dispersion of the PII score is not equal for the different groups, therefore, the relationship should be regarded as heteroscedastic.
In fact, in the original study by Zaichkowsky (1985), in which the author proposes and tests the scale of 20 items, taking the 14 products analyzed by the author, we
can observe that there is a significant relation (r = -0.854, p value < 0.01) between the average of the PII score and the standard deviation, as observed in Graph 2.
13
– –
d
5 15 25 35 45
20 30 40 50 60 70 80 90 100 110 120 130 140
Sta
nd
a
rd Dev
ia
tio
n
Average PII score of each product
GRAPH 2 – average and sd of PII score (1985) Source: Elaborated from Zaichkowsky (1985)
4.2 New Involvement Profilescale
To validate the NIP scale, an Exploratory Factorial Analysis (EFA) was conducted, using the
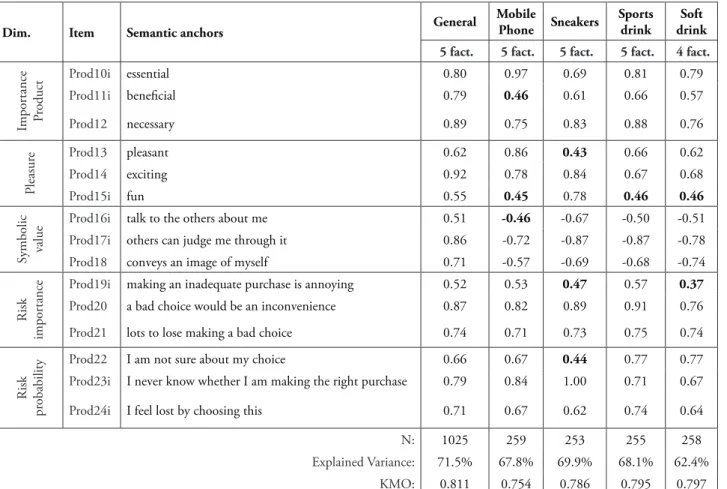
principal axis factoring technique, to preserve the correlation among factors, with oblique rotation, thus reproducing the procedures used by the scale creator. To extract the factors, a self-value criterion (eingenvalue) higher than 1 was used, resulting in five dimensions proposed by the authors for the scale (KMO = 0.811), with total explained variance of 71.5% (see Table 4).
4.2.1Test of the NIP scale per product
The NIP scale was tested for each product, by splitting the sample into four sub-samples. The five dimensions of the scale were observed
TABLE 4 – Exploratory factorial analysis – new involvement profile
Dim. Item Semantic anchors General
Mobile
Phone Sneakers
Sports drink
Soft drink
5 fact. 5 fact. 5 fact. 5 fact. 4 fact.
Impor
tance
Pr
oduct
Prod10i essential 0.80 0.97 0.69 0.81 0.79
Prod11i beneficial 0.79 0.46 0.61 0.66 0.57
Prod12 necessary 0.89 0.75 0.83 0.88 0.76
Pleasur
e Prod13 pleasant 0.62 0.86 0.43 0.66 0.62
Prod14 exciting 0.92 0.78 0.84 0.67 0.68
Prod15i fun 0.55 0.45 0.78 0.46 0.46
Symbolic value
Prod16i talk to the others about me 0.51 -0.46 -0.67 -0.50 -0.51
Prod17i others can judge me through it 0.86 -0.72 -0.87 -0.87 -0.78
Prod18 conveys an image of myself 0.71 -0.57 -0.69 -0.68 -0.74
Risk
impor
tance
Prod19i making an inadequate purchase is annoying 0.52 0.53 0.47 0.57 0.37
Prod20 a bad choice would be an inconvenience 0.87 0.82 0.89 0.91 0.76
Prod21 lots to lose making a bad choice 0.74 0.71 0.73 0.75 0.74
Risk
pr
obability
Prod22 I am not sure about my choice 0.66 0.67 0.44 0.77 0.77
Prod23i I never know whether I am making the right purchase 0.79 0.84 1.00 0.71 0.67
Prod24i I feel lost by choosing this 0.71 0.67 0.62 0.74 0.64
N: 1025 259 253 255 258
Explained Variance: 71.5% 67.8% 69.9% 68.1% 62.4%
KMO: 0.811 0.754 0.786 0.795 0.797
Source: the authors.
0.69 and 0.85 for pleasure; 0.56 and 0.71 for symbolic value; 0.56 and 0.74 for risk importance; and 0.63 an d0.78 for risk probability. It was also observed that typically the inter-item correlation was above the suggested limit of 0.30 (HAIR et al., 2006, p. 137) and the corrected inter-item correlation was above the suggested limit of 0.50 (BEARDEN; NETMEYER, 1999), showing a high degree of internal consistence. Therefore, it would be reasonable to accept the reliability of the NIP scale constructs.
4.2.3Convergent and discriminating validity
The convergent validity examines the degree to which the items measuring the same concept are correlated (HAIR JR et al., 2006). The results of the Spearman’s ranks correlation tests in this study partially support the convergent validity. For the mobile phone and sneakers products, all the items showed correlation > 0.30 4.2.2Reliability of the NIP scale
In this study, for nearly all the dimensions of investigated products, it was observed that the α of Cronbach reached a value above 0.70, a typically accepted limit (HAIR JR et al., 2006). The only two exceptions were observed in the symbolic value dimension, in the mobile phone product (α = 0.662); and in the risk importance dimension, in the soft drink product (α = 0.651).
In fact, the results obtained in this study do not differ a lot from those observed in the original study by Jain and Srinivasan (1990), in which the following values were respectively observed for the dimensions product importance, pleasure, symbolic value, risk importance and risk probability: 0.80, 0.84, 0.84, 0.80 and 0.56.
in all the constructs. However, the following items had some correlation < 0.30: for the sports drink product, the item Prod15i (fun); for the soft drink product, the items Prod13 (pleasant), Prod15i (fun) and Prod21 (lots to lose for a bad choice).
The convergent validity was also evaluated through the analysis of the load factor of the component variables of each factor. The general EFA results (for all the products) allow support the convergent validity of all the constructs, with all the items having a load factor > 0.50. However, the EFA results for each product highlight variables with load factor < 0.50: for the mobile phone product, Prod11i (beneficial), Prod15i (fun) and Prod16i (talk to the others about myself ); for the sneakers product, Prod13 (pleasant), Prod19i (it is annoying to make an inadequate purchase) and Prod22 (when buying it, I am sure about my choice); for the sports drink product, Prod15i (fun); and for the soft drink product, Prod15i (fun) and Prod19i (it is annoying to make an inadequate purchase). Thus, it was only possible to partially support the convergent validity of the scale constructs.
The discriminating validity, which evaluates the degree to which two similar concepts are different, was checked through the correlation test between items of different dimensions of the scale (HAIR et al., 2006).
For the mobile phone product, it was observed that items belonging to the symbolic value dimension had a high correlation with the items of the pleasure dimension (r > 0.30). I addition, it was observed in the EFA that the item Prod16i (talks to others about myself ) had its load factor split the dimension symbolic value (FC = -0.460) and pleasure (FC = 0.313).
For the sneakers product, it was observed that the items belonging to the pleasure dimension had high correlations with the items of the product importance dimension (r > 0.30), and the items belonging to the symbolic value dimension had high correlation with the items of the product importance and pleasure dimensions (r > 0.30). Also, it was observed in the EFA that the item Prod13 (pleasant) had its load factor split between the dimensions pleasure (FC = 0.433) and product importance (FC = 0.372).
For the sports drink product, it was observed that the items belonging to the symbolic value dimension had high correlation with the items of the product importance and pleasure dimensions, which formed a single dimension for this product (r > 0.30), and the items belonging to the symbolic value dimension also had high correlation with the items of the pleasure dimension (r > 0.30). Also, it was observed in the EFA that the item Prod16i (talks to the others about myself ) had its load factor split between the dimensions symbolic value (FC = -0.498), and product importance and pleasure (FC = 0.414).
For the soft drink product, it was observed that the items belonging to the symbolic value dimension had high correlation with the items of the product importance and pleasure dimensions, which formed a single dimension for this product (r > 0.30), and the items belonging to the symbolic value dimension also had high correlation with the items of the product importance and pleasure dimensions (r > 0.30). Also, it was observed in the EFA that the item Prod16i (talks to the others about myself ) had its load factor split between the dimensions symbolic value (FC = -0.512), and product importance and pleasure (FC = 0.331).
Thus, as shown, the factorial structure obtained for the general sample (N = 1025) possibly does not faithfully represent the factorial structure underlying each type of analyzed product. The five dimensions proposed by Jain and Srinivasan (1990) were reproduced for the mobile phone and sneakers products, but this doesn’t happen to the sports drink and soft drink products, in which only four dimensions were observed. In addition, a high correlation was observed between items of different constructs, as well the split of the load factor of several items among conceptually different constructs. Thus, it was only possible to partially support the discriminating validity of the scale constructs.
4.2.4 Nip score of the involvement with the product
the dimensions as being an average of three items for each of the scale dimensions, standardized for the basis 100. In this study, a similar process was used to operationalize the score of each dimension for each investigated product. For each of the products, an average was calculated for each of the five dimensions, weighing the average of each dimension variable through its respective load factor. Subsequently, the weighted averages of each dimension were standardized for a base 100, thus obtaining a “NIP score per dimension at the base 100” for each product. At last, a “NIP score per product at the base 100” was calculated, weighting the “NIP score per dimension at the base 100” of each product by its respective self-value.
The calculation was thus made with the aim of preserving the relative weight of each dimension for each investigated product. It is noteworthy that, to obtain the self-value as well as the load factors of the variables composing the product importance and pleasure dimensions for the sports drink and soft drink products (which resulted in a single dimension in the EFA), it was necessary to conduct two new EFA, forcing the formation of five factors. Thus, the results obtained for the scores should be taken with some caution.
4.2.4.1 Nip score per dimension and per product
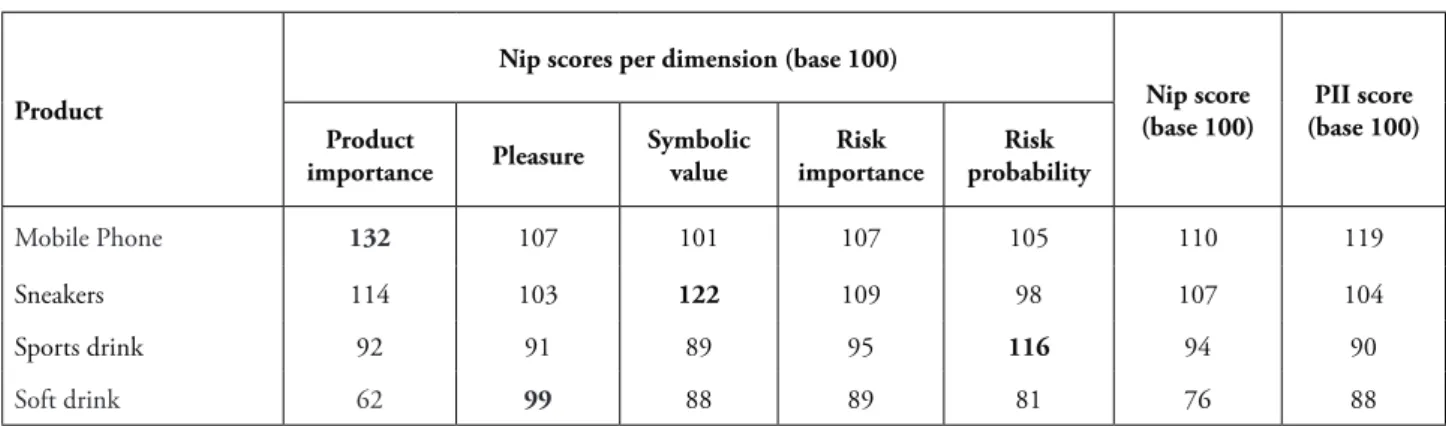
Table 5 summarizes the results obtained for the NIP score per product. We observe that for the mobile phone product, the product importance had the higher score (NIP = 132).
For the sneakers product, the symbolic value had the higher score (NIP = 122). This result is in line with the findings by Ferla and Silveira (2008). For the sports drink product, the risk probability had the higher score (NIP = 116). This result is possibly related to the product association to health risks. The soft drink product had the smaller score for all the dimensions, except for the pleasure dimension, which score (NIP = 99) was higher than the respective score of the sports drink product (NIP = 91).
Jain and Srinivasan (1990) showed in their study a table with NIP scores obtained for each dimension of each product, compared to the respective scores obtained from the original PII scale by Zaichkowsky (1985). In this study, to allow a direct comparison, we decided to present the NIP and PII scores obtained in the same format, i.e., the PII scores obtained for each product (which originally vary from 10 to 70) were also standardized for the base 100 (see Table 4).
When comparing the standardized scores obtained from NIP and PII scales, we observe an alignment in the score order per product, showing a convergence between scales. The mobile phone product had the highest score in both scales (NIP = 110 and PII = 119). The sneakers product had the second higher score (NIP = 107 and PII = 104) and the sports drink product, had the third score (NIP = 94 and PII = 90). Soft drink had the lowest score (NIP = 76 and PII = 88), being regarded as the product with lower involvement of consumers among the studied ones.
TABLE 5 – PII and nip scores compared per product (base 100)
Product
Nip scores per dimension (base 100)
Nip score (base 100)
PII score (base 100) Product
importance Pleasure
Symbolic value
Risk importance
Risk probability
Mobile Phone 132 107 101 107 105 110 119
Sneakers 114 103 122 109 98 107 104
Sports drink 92 91 89 95 116 94 90
Soft drink 62 99 88 89 81 76 88
4.2.4.2 Operationalization of the general NIP score
In this study, a General NIP score was calculated, and was operationalized to reflect the involvement with the product of each sample respondent from the factorial scores of the general EFA (five factors), weighed by the respective self-values (product importance, A = 4.524442;
risk probability, A = 2.033747; risk importance, A = 1.770907; symbolic value, A = 1.384023; pleasure, A = 1.015884).
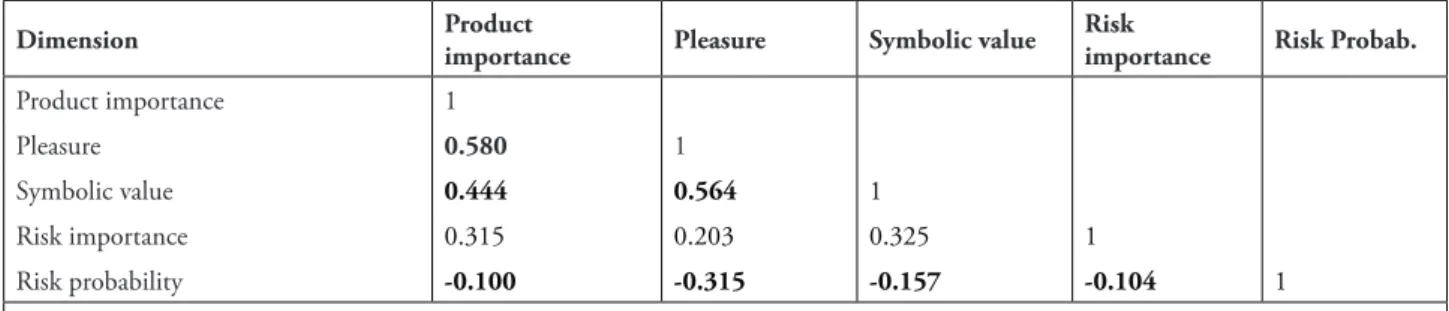
For effect of confrontation with the results by Jain and Srinivasan (1990), in this study, the correlation between the General NIP scores obtained for each of the dimensions was calculated (see Table 6).
TABLE 6 – Matrix of correlation between the dimensions for all the products
Dimension Product
importance Pleasure Symbolic value
Risk
importance Risk Probab.
Product importance 1
Pleasure 0.580 1
Symbolic value 0.444 0.564 1
Risk importance 0.315 0.203 0.325 1
Risk probability -0.100 -0.315 -0.157 -0.104 1
All the correlations are significant to level 0.01
Source: the authors.
We observe that the dimensions product importance, pleasure and symbolic value are strongly correlated. The same effect can be seen in the study by Jain and Srinivasan (1990), in which product importance and pleasure have r = 0.42; product importance and symbolic value have r = 0.33; and pleasure and symbolic value have r = 0.58. In this study, it was also observed that the dimension risk probability has a negative correlation with all the other dimensions. Again, in the study by Jain and Srinivasan (1990), risk probability and product importance have r = -0.02. The results of this study are also aligned with the results obtained for the CIP scale in the study by Kapferer and Laurent (1985), in which interest (product importance) and pleasure have r = 0.55; interest (product importance) and symbolic value have r = 0.38; and pleasure and symbolic value have r = 0.47. Once again, we observe the challenge posed by the NIP scale in terms of discriminating validity of the constructs.
4.3 Convergence between the PII and NIP scales
With the purpose of evaluating the convergence of the PII and NIP scales, an
analysis of the correlation of the PII Score with the General NIP Score was conducted. The non-parametric Spearman’s correlation (ρ) test shows a high correlation between both scales scores (r = 0.730).
Furthermore, two dummy variables were operationalized to dichotomically represent the degree of involvement with the product respectively using the General NIP score and the PII score. The median of each score was used as parameter to separate respondents into two groups: low involvement and high involvement. Matos (2003), who used part of the Zaichkowsky’s scale (1985) in his research to measure the moderating effect of the involvement of the product, has used the same procedure in his study.
group, the others with score above 48 (N = 509, representing 49.7% of the cases) were included in the high involvement group.
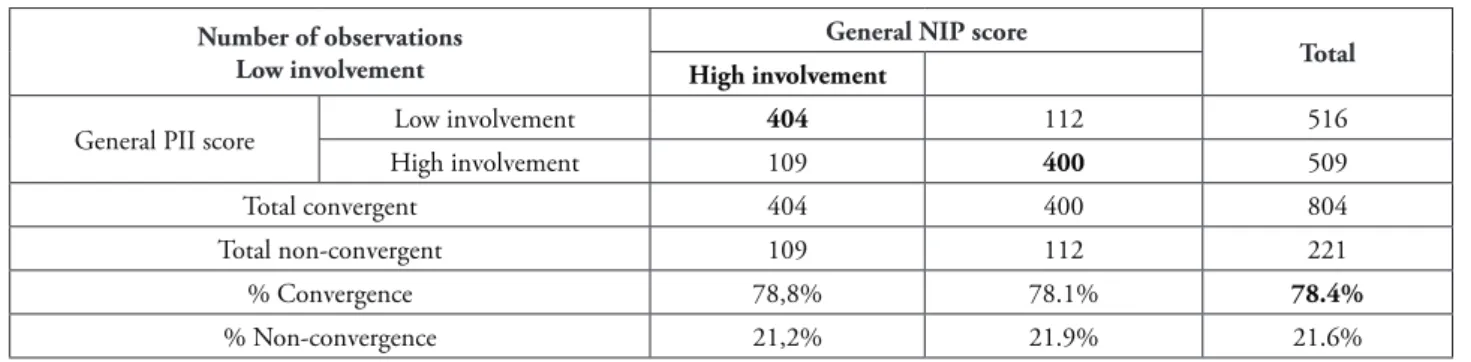
We obser ved the convergence of classification in 78.4% of the cases. 404 cases
(78.8%) were equally classified as of high involvement, and 400 cases (78.1%), as of low involvement, according to the PII and General NIP scores (see Table 7).
TABLE 7 – Matrix of classification convergence
Number of observations Low involvement
General NIP score
Total
High involvement
General PII score Low involvement 404 112 516
High involvement 109 400 509
Total convergent 404 400 804
Total non-convergent 109 112 221
% Convergence 78,8% 78.1% 78.4%
% Non-convergence 21,2% 21.9% 21.6%
Source: the authors.
The non-parametric Chi-square (χ2) test of
Pearson, appropriate to test the independence of inherently categorical variables, was used to check the independence of the classification criteria. The H0 of the χ2 test was rejected (χ2 =331.61; p value
< 0.01), showing that the two classification criteria (dichotomic variables derived from PII and NIP scores) are dependent. The variables association strength can be considered strong (φ= 0.569;
p value < 0.01) (DANIEL, 1990; COHEN, 1988).
5 CONCLUSIONS
The conclusions regarding the three specific objectives of this study are reported as follows: a) reliability and validity of the PII scale in the Brazilian context; b) reliability and validity of the NIP scale in the Brazilian context; and c) degree of convergence of the PII and NIP scales scores.
a) Reliability and validity of the PII scale in the studied Brazilian context
We came to the conclusion that the PII scale has reliability and convergent validity. However, this is a scale with two dimensions (affective and cognitive), which for the sports
drink product showed to be one-dimensional. Considering that the calculation of score of the PII scale disregards the two-dimensional nature of the scale (because it results from the sum of all variables), it is not so relevant to criticize the discriminating validity of constructs component of the scale sub-dimensions. The main difficulty related to the PII scale is the fact that its score does not represent the homoscedasticity characteristic. Thus, it is possible that the predicting power of the PII scale for products regarded as of high involvement is bigger than for those regarded as of low involvement.
b) Reliability and validity of the NIP scale in the studied Brazilian context
Srinivasan (1990) were reproduced for the mobile phone and sneakers products, but this doesn’t happen to the ports drink and soft drink products, in which only four dimensions were observed. In addition, a high correlation was observed between items of different constructs, as well the split of the load factor of several items among conceptually different constructs. Thus, it was only possible to partially support the discriminating validity of the scale constructs.
Other studies have also observed a high correlation between the items of the product importance, pleasure and symbolic value dimensions. Kapferer and Laurent (1985) called the attention for that, in some product categories, the interest (afterwards renamed as product importance) and pleasure dimensions can be united, forming a single dimension. In the study by these authors, this union took place in the food category. In the study by Quester and Lim (2003), the interest (product importance) and pleasure dimensions resulted in a single dimension for the sneakers product, and the symbolic value and pleasure dimensions also resulted in a single dimension for the ballpoint pen product. Rodgers and Schneider (1993) observed the union of the interest (product importance) and pleasure dimensions in electronic equipment, audio recorders, cars and clothing. In the Brazilian context, Fonseca and Rossi (1999) observed the union of the product importance and pleasure dimensions for the product beer.
c) To which degree the PII and NIP scales scores are convergent?
The non-parametric correlation (ρ) test of Spearman showed a high correlation between the scores of both scales (r=0.730). In addition, the classification convergence was observed in 78.4% of the cases, which shows the existence of a strong dependence between the classification criteria (χ2
=331.61; φ= 0.569). Therefore, the results allow to empirically reject the substantive hypothesis of this study, that the scores of consumer involvement with the product, measured with the PII scale, are significantly different from the scores
measured with the NIP scale. In other words, the scales produce a high degree of classification convergence of the studied cases.
6 CONTRIBUTIONS TO MANAGEMENT,
LIMITATIONS AND SUGGESTIONS FOR NEW STUDIES
The management contribution of this study is to offer tools, translated and tested scales, which can be used in consumers’ surveys, helping companies in their marketing decisions, more specifically for the segmentation of customers. The knowledge about the importance of different dimensions of the consumers’ involvement with products can contribute to a higher quality decision. Furthermore, as observed by Laurent and Kapferer (1985), and by Jain and Srinivasan (1990), the classification of products as of high and low involvement might not be entirely appropriate, since each individual can show a different degree of involvement with each product category. Marketing executives should consider this difference when conducting consumers’ surveys to orient marketing investments, considering that the type of involvement can interfere with their preferences.
The study used a non-probabilistic sample, not allowing to state it represented the surveyed population, thus limiting the possibilities of generalization (MALHOTRA, 2006). In addition, the decision to restrict the sample to undergraduate students also introduces an important limitation for the generalization of the results.
reliability, convergent and discriminating validity of first order constructs. For such a purpose, we suggest the use of methodological procedures recommended by Churchill Jr. (1979), ant the use of the modeling technique of structural equations to examine the second order model, using the approach proposed by Kline (2005), Byrne (2010) and Koufteros, Babbar and Kaighobadi (2009).
Furthermore, this study highlighted that the PII scale has no homoscedasticity characteristics, which shows the need to critically evaluate the composition of the scale items. The same can be suggested for the NIP scale, which showed problems of convergent and discriminating validity. A possible explanation for such finding would be the heterogeneity of the population, or even the heterogeneity of the product categories. In other words, the items of the investigated scales might be not equally appropriate to measure the low and high degrees of involvement with the product. For new researches, we thus suggest an approach based on the Item Response Theory (IRT), which simultaneously considers the influence of the individual features and the difficulty inherent to each item, which could allow a progress in measuring such construct (FURR, BACHARACH, 2014).
REFERENCES
BAUER, H. H.; SAUER, N. E.; BECKER, C. Investigating the relationship between product involvement and consumer decision-making styles. Journal of Consumer Behaviour, London, v. 5, n. 4, p. 342-354, Aug. 2006.
BEARDEN, W. O.; NETMEYER, R. G.
Handbook of marketing scales: multi-item measures for marketing and consumer behavior research. USA: Sage Publications, 1999.
BYRNE, B. M. Structural equation modeling with AMOS: basic concepts, applications and programming. 2nd ed. Otawa: Routledge, 2010.
CELSI, R. L.; OLSON, J. C. The role of involvement in attention and comprehension
processes. Journal of Consumer Research, Chicago, v. 15, n. 2, p. 210-224, Sept. 1988.
CHURCHILL JR, G. A. A paradigm for developing better measures of marketing constructs. Journal of Marketing Research, v. 16, n. 1, p. 64-73, Feb. 1979.
COHEN, J. Statistical power analysis for the behavioral sciences. Hillsdale, NJ: Lawrence Earlbaum Associates, 1988.
CZINKOTA, Michael R. Marketing: as melhores
práticas. Porto Alegre: Bookman, 2001.
DANIEL, W. W. Applied nonparametric statistics. Boston: PWS-Kent Publishing Company, 1990.
ENGEL, J. F.; BLACKWELL, R. D.; MINIARD, P. W. Comportamento do consumidor. 8. ed. Rio de Janeiro: JC Editora, 2000.
FERLA, D. A.; SILVERA, T. A relação entre os benefícios simbólicos do consumo e a formação da identidade dos jovens consumidores através de uma abordagem metodológica mista. In: ENCONTRO DE MARKETING DA ANPAD, 3, 2008, Curitiba, PR. Anais...Curitiba, PR: ANPAD, 2008.
FREIRE, K.; FREIRE, W.; NIQUE, W. M. O papel do envolvimento com o produto e do comprometimento com a marca em diferentes fases da lealdade. In: ENCONTRO NACIONAL DOS PROGRAMAS DE PÓS-GRADUAÇÃO EM ADMINISTRAÇÃO, 29., 2005, Brasília.
Anais... Brasília: ANPAD, 2005.
F U R R , R . M . ; B AC H A R AC H , V. R .
Psychometrics: an introduction. 2nd ed. Los Angeles: Sage, 2014.
GARLAND, R.; FERKINS, L. Evaluating New Zealand sports stars as celebrity endorsers: intriguing results. Dec. 2003. Australian and New Zealand Marketing Academy Conference.
GREENWALD, A.G.; LEAVITT, C. Audience involvement in advertising: four levels. Journal of Consumer Research, Chicago, v. 11, n. 1, p. 581-592, June 1984.
HAIR JR, J. F. et al. Fundamentos de métodos de pesquisa em administração. Porto Alegre: Bookman, 2005.
______. Multivariate data analysis. 6th ed. New Jersey: Upper Saddle River, 2006.
HEPP, C. P. T. Satisfação, lealdade e envolvimento do consumidor: um estudo no varejo de vestuário. In: ENCONTRO NACIONAL DOS PROGRAMAS DE PÓS-GRADUAÇÃO EM ADMINISTRAÇÃO, 32., 2008, Rio de Janeiro.
Anais... Brasília: ANPAD, 2008.
HIGIE, R. A.; FEICK, L. F. Enduring involvement: conceptual and measurement issues.
Advances in Consumer Research, [S. l.], v. 16, n. 1, p. 690-696, Jan. 1989.
JAIN, K.; SRINIVASAN, N. An empirical assessment of multiple operationalizations of involvement. Advances in Consumer Research, [S. l.], v. 17, n. 1, p. 594-602, 1990.
KAPFERER, J.N.; LAURENT, G Consumer’s involvement profile: new empirical results.
Advances in Consumer Research, [S. l.], v. 12, n. 1, p. 290-295, Jan. 1985.
KEILLOR, B. D.; PARKER, R. S.; SCHAEFER A. Influences on adolescent brand preferences in the United States and Mexico. Journal of Advertising Research, New York, v. 36, n. 3, p. 47-56, May/June 1996.
KLINE, R. B. Principles and practice of structural equation modeling. New York: The
Guilford Press, 2nd ed., 2005.
K O U F T E R O S , X . ; B A B B A R , S . ; KAIGHOBADI, M. A paradigm for examining second-order factor models employing structural equation modeling. International Journal of Production Economics, Amsterdam, v. 120, n. 2, p. 633-652, Aug. 2009.
KRUGMAN, H. E. The Impact of Television Advertising: Learning Without Involvement.
Public Opinion Quarterly, Chicago, v. 29, n. 3, p. 349–356, 1965.
______. The measurement of advertising involvement. Public Opinion Quarterly, Chicago, v. 30, n. 4, p. 583–596, 1966.
LARÁN, J. A.; ROSSI, C. A. V. Surpresa e a formação da satisfação do consumidor. RAE-eletrônica,São Paulo, v. 5, n. 1, jan./jun. 2006.
LAURENT, G., KAPFERER, J. N. Measuring consumer involvement profiles. Journal of Marketing Research, Chicago, v. 22, n. 1,
p. 41-53, Feb. 1985.
MALHOTRA, N. K. Pesquisa de marketing: uma orientação aplicada. 4. ed. Porto Alegre: Bookman, 2006.
MATOS, C. A. O efeito do recall de produtos nas atitudes dos consumidores. Revista de Administração, Belo Horizonte, v. 2, n. 2, p. 24-36, jul./dez., 2003.
MCQUARRIE, E. F.; MUNSON, J. M. A revised product involvement inventory: improved usability and validity. Advances in Consumer Research, [S. l.], v. 19, n. 1, p. 108-115, Jan.
______. The Zaichkowsky personal involvement inventory: modification and extension. Advances in Consumer Research, [S. l.], v. 14, n. 1, p.
36-40, Jan. 1987.
MICHAELIDOU, N.; DIBB, S. Product involvement: an application in clothing. Journal of Consumer Behavior, London, v. 5, n. 5,
p. 442-453, Sept./Oct. 2006.
PEREIRA, C. A. A. O diferencial semântico: uma técnica de medida nas ciências humanas e sociais. São Paulo: Ática, 1986.
PETTY, R. E.; CACIOPPO, J. T.; SCHUMANN, D. Central and peripheral routes to advertising effectiveness: the moderating role of involvement.
Journal of Consumer Research, Chicago, v.10,
n. 2, p. 135-146, Sept. 1983.
QUESTER, P; LIM, A. L. Product involvement/ brand loyalty: is there a link? Journal of Product and Brand Management, Bradford, v. 12, n. 1,
p. 22-38, 2003.
QUESTER, P. G; SMART, J. The influence of consumption situation and product involvement over consumers’ use of product attribute. Journal of Consumer Marketing, Bradford, v. 15, n. 3, p. 220-238, 1998.
RATCHFORD, B. T. New Insights About The FCB Grid. Journal of Advertising Research,
New York, v. 27, n. 4, p. 24-38, Aug./Sept. 1987.
ROCHA, L. M. C. Proposta de mensuração de envolvimento do consumidor. 1988. 97 f. Dissertação (Mestrado em Administração)-Pontifícia Universidade Católica do Rio de Janeiro, Rio de Janeiro, 1988.
RODGERS, W. C.; SCHNEIDER, K. C. An empirical evaluation of the Kapferer-Laurent consumer involvement profile scale.Psychology and Marketing, New York, v. 10, n. 4, p. 333-345, July/Aug. 1993.
SALEEM, F. Effect of single celebrity and multiple celebrity endorsement on low involvement
and high involvement product advertisements.
European Journal of Social Sciences, [S. l.], v. 5, n. 3, p. 125-132, 2007.
SAWATARI, Y. The impact of the gender of celebrity athlete endorser on consumers of athletic shoes. 2005. 102 f. Thesis (Master of Science)-Florida State University, College Education, 2005.
SCHAEFER, A.; KEILLOR, B. The effective use of endorsements in advertising: the relationship between “match-up” and involvement. The Journal of Marketing Management, London,
v. 7, n. 2, p. 23-33, Fall/Winter, 1997.
SCHIFFMAN, L., G., KANUK, L., L.
Comportamento do consumidor. 6. ed. Rio de Janeiro: LTC, 1997.
SHUART, J. Heroes in sport: assessing celebrity endorser effectiveness. International Journal of Sport Marketing and Sponsorship, [S. l.], v. 8, n. 2, p. 126-140, Jan. 2007.
SIEGEL, S. Estatística não-paramétrica: para
as ciências do comportamento. São Paulo: Mc-Graw-Hill, 1975.
SOLOMON, M. R. O comportamento do consumidor. São Paulo: Editora Bookman, 2002.
TAMHANE, A. C. Multiple comparison in model I: one-way anova with unequal variances, Communicatios in Statistics Theory and Methods, [S. l.], v. 6, n. 7, p.15-32, 1977.
Z AICHKOWSKY, J. L. Measuring the involvement construct. Journal of Consumer Research. Bradford, v. 12, n. 3, p. 341-352, Dec. 1985.
______. The personal involvement inventory: reduction, revision, and application to advertising.