Júri:
Margarida Santos Nobre Félix
Licenciatura em Ciências de Engenharia Biomédica
A comparison between digital breast tomosynthesis and
mammography: dosimetric and image quality
characterization of a clinical system
Dissertação para obtenção do Grau de Mestre em Engenharia Biomédica
Orientador: Doutor José Pedro Miragaia Trancoso Vaz Campus Tecnológico e Nuclear, IST/UL Co-orientador: Doutor Salvatore Di Maria
Campus Tecnológico e Nuclear, IST/UL
Presidente: Doutor Mário António Basto Forjaz Secca Arguente: Doutor Nuno Miguel de Pinto Lobo Matela
Vogais: Doutor Salvatore Di Maria
A comparison between digital breast tomosynthesis and mammography: dosimetric and image quality characterization of a clinical system
Copyright © Margarida Santos Nobre Félix, Faculdade de Ciências e Tecnologia, Universidade Nova de Lisboa.
“Que difícil é a vida dos homens”, pensou ela. “Eles não têm asas para voar por cima das coisas más.” - Sophia de Mello Breyner Andresen, in “A Fada Oriana”
“La semplicità è l’ultima sofisticazione.” - attibuitta a Leonardo da Vinci
Acknowledgements
This work represents the end of a very special and important stage of my life. I couldn’t
have concluded it without the support, guidance and friendship of all the people who, in so diverse moments, crossed my path during the years.
So, first of all I would like to thank to both my thesis advisors, Dr. Salvatore Di Maria and Dr. Pedro Vaz. Thanks to them, this work was a challenge that I was able to defeat. Thank you very much for all the guidance and support!
I would also like to thank to Hospital da Luz, where all the data acquisitions were performed. Special thanks to diagnostic radiologist Dr. Lurdes Orvalho and to radiologist technicians Armanda Silva and Ana Marta Sarmento, whose availability and patient were of crucial importance.
I also have to thank to the Metrology Laboratory of Ionising Radiations (Campus Tecnológico e Nuclear, IST/UL) who borrowed, calibrated and read the TLDs used in this work.
Special thanks to Mariana Baptista who has always been available to help me, discuss with me some eventual results and talk about tomosynthesis and life in general. And thanks to
all the people I’ve met in Campus Tecnológico e Nuclear, I really felt welcome!
I must say a distinctive ‘thank you’ to all my friends who had the patient to listen to me in my darkest hours, and who always believe in me, in my abilities and in my work…
sometimes even more than myself! No need to say names, you all know well who you are…
and I assure you that you are in a special space in my heart!
Acknowledgements
Obrigada à Fátima que teve imensa paciência e, sem esperar, tornou-se uma especialista em mamografia e tomossíntese.
Obrigada aos meus avós, Maria dos Anjos e José, que já cá não estão, mas a quem devo tanto da pessoa que sou hoje.
Obrigada à minha avó, Maria Luísa, que tem uma fé inabalável em mim e cujo apoio e carinho constantes inspiram-me todos os dias a continuar a esforçar-me e tentar fazer melhor.
Obrigada à minha tia, “Tiné”, que sempre me ajudou a manter os pés no chão, não permitindo que me perdesse em vias de divagações desnecessárias e de pessimismo.
Obrigada ao meu irmão, José Duarte, que é uma presença apaziguadora constante… e que por vezes me surpreende ao dizer precisamente as palavras que eu, mesmo sem ter noção, precisava de ouvir.
Obrigada ao meu pai, Fernando, que sempre acreditou que eu conseguiria.
Um grande obrigada à minhã mãe, com quem me orgulho de partilhar o nome Margarida. Sem o seu amor, a sua força e fé em mim, seria impossível que eu alguma vez tivesse chegado tão longe.
For those who were mentioned, and for those who weren’t but keep an important spot in
my life: thank you very much! This work wouldn’t have been possible without your care,
Abstract
Breast cancer (BC) is the leading cause among females worldwide: only in Portugal there are 4500 new cases and 1500 deaths per year. BC screening mammography is, according to some authors, responsible for up to 45% reduction in BC mortality rate. Nowadays, another technique is being studied: Digital Breast Tomosynthesis (DBT). This technique, in the future might be able to overcome and substitute Digital Mammography (DM) as either a screening or diagnostic tool. It is then, very important to carry out dosimetric and image quality studies using DBT systems. In this work, a comparison between DM and DBT was performed. It was used a dual imaging system (which allows both DM and DBT functionalities) and two different breast shaped phantoms. Acquisitions ranging from 24-34 kV, and using W/Rh and Mo/Mo as target/filter combination on DM and only W/Rh on DBT were performed. Entrance Dose was measured with TLDs. Using two different formalisms, Mean Glandular Dose (MGD) was assessed. Considering the acquired images, Contrast-to-Noise Ratio (CNR) and Signal-to-Contrast-to-Noise Ratio as well as two Figures-of-Merits (FOMs) were calculated. Also a compression study was carried out, acquiring images when performing a 5%, 12.5% or 20% reduction of the compression force.
It was concluded that DM is still superior to DBT, but, there are good prospects concerning the last one. It was seen that MGD is higher for DBT than for DM (considering W/Rh filter combination), though both respect the internationally established limits. Moreover MGDDBT is lower than the two-view MGDDM acquisitions (MLO, CC). FOMs
reach higher values for DM, though the analysed microcalcifications equivalent details look brighter in a DBT image. Finally the DBT examination is less affected by a compression reduction with respect to the DM one, and this could suggest a comfort increase from the patient point of view.
Keywords: Mammography; Digital Breast Tomosynthesis; Mean Glandular Dose;
Resumo
O Cancro da Mama (BC) é o principal responsável pela morte de um elevado número de mulheres em todo o mundo: só em Portugal há 4500 novos casos e 1500 mortes por ano. O rastreio mamográfico, de acordo com alguns autores originou uma redução de 45% da taxa de mortalidade. Presentemente, outra técnica tem sido estudada: a Tomossíntese Digital Mamária (DBT). No futuro, esta poderá ser capaz de ultrapassar e substituir a Mamografia Digital (DM) quer no rastreio quer no diagnóstico de BC. É pois, de extrema importância realizar estudos dosimétricos e de qualidade de imagem com este sistema. Neste trabalho, foi então feita uma comparação entre as duas técnicas, utilizando um sistema que pode funcionar como DM ou DBT e dois fantomas mamários. As aquisições foram realizadas com as combinações alvo/filtro W/Rh e Mo/Mo para a DM e W/Rh para a DBT, e a voltagem variada entre 24-34 kV. A dose de entrada foi medida por TLDs. A Dose Glandular Média (MGD) foi calculada através de dois formalismos diferentes. As relações Contraste-Ruído (CNR) e Sinal-Ruído (SNR) bem como duas Figures-of-Merits (FOMs) foram também calculadas. Realizou-se também um estudo de compressão: adquiriram-se imagens com reduções da força de compressão iguais a 5%, 12.5% e 20%.
Concluiu-se que a DM é ainda superior à DBT, mas existem boas perspectivas em relação à evolução da última. Constatou-se que a MGD é maior para a DBT do que para a DM (para a combinação alvo/filtro W/Rh), ainda que ambos os valores respeitem os limites estabelecidos internacionalmente e a MGDDBT seja inferior à MGDDM para aquisições
two-view (MLO, CC). As FOMs atingiram valores mais elevados para a DM, mas observou-se que os detalhes equivalentes às microcalcificações aparecem mais brilhantes com a DBT. Por fim, observou-se que o desempenho da DBT é menos afectado por uma redução da compressão, o que poderá significar melhorias a nível de conforto para o paciente.
Palavras-chave: Mamografia; Tomossíntese Digital Mamária; Dose Glandular Média;
Contents
1. INTRODUCTION ... 1
1.1 MOTIVATION AND OBJECTIVES ... 1
1.2 THESIS OVERVIEW ... 2
2. BREAST IMAGING ... 3
2.1 BREAST CANCER SCREENING ... 3
2.1.1 Screening Age and Frequency ... 5
2.1.2 Breast Cancer Screening Harms ... 6
2.2 BREAST TISSUES AND PATHOLOGIES ... 7
2.3 BREAST IMAGING TECHNIQUES ... 7
2.3.1 Mammography ... 8
2.3.2 Digital Breast Tomosynthesis (DBT) ... 9
3. X-RAY PHYSICS IN DIAGNOSTIC ENERGY RANGE ... 13
3.1 INTERACTION OF RADIATION WITH MATTER ... 13
3.1.1 Interaction of Photons with Matter ... 13
3.1.1.1 Cross Section ... 13
3.1.1.2 Interactions Processes ... 14
3.1.1.2.1 Phototelectric Effect ... 15
3.1.1.2.2 Compton Effect (Incoherent Scattering) ... 16
3.1.1.2.3 Rayleigh Scattering (Coherent Scattering) ... 17
3.1.1.2.4 Pair Production ... 18
3.1.1.3 Photon Beam Attenuation ... 19
3.1.1.3.1 Attenuation Coefficients ... 19
3.1.1.3.2 Mass Energy-Absorption Coefficient ... 20
3.1.1.5 Mean Free Path ... 21
3.2 QUANTITIES AND UNITS ... 21
3.2.1 Radiometric Quantities and Units ... 21
Contents
3.2.1.1.1 Inverse Square Law ... 21
3.2.1.2 Energy Fluence ... 22
3.2.2 Dosimetric Quantities and Units ... 22
3.2.2.1 Kerma ... 22
3.2.2.2 Entrance Dose ... 23
3.2.2.3 Absorbed Dose ... 23
3.2.2.4 Relationships between Dosimetric Quantities ... 23
3.2.2.4.1 Kerma and Energy Fluence (Photons) ... 23
3.2.2.4.2 Kerma and Dose (Charged Particle Equilibrium – CPE) ... 24
3.3 BIOLOGICAL EFFECTS OF RADIATION ... 25
4. DOSIMETRY ... 27
4.1 MEAN GLANDULAR DOSE (MGD) ... 27
4.1.1 MGD Assessment Formalisms ... 28
4.1.1.1 Dance(1990), Dance et al.(2000) and Dance et al.(2011) ... 28
4.1.1.2 Boone(1999) ... 30
5. MATERIALS AND METHODS... 33
5.1 DATA ACQUISITION: MATERIALS AND PARAMETERS ... 33
5.1.1 DBT and DM System ... 33
5.1.2 Phantoms ... 35
5.1.3 Thermoluminescent Dosimeters (TLDs) ... 36
5.1.4 Acquisition Modes and Peak Tube Voltage ... 38
5.2 DATA ANALYSIS: MATERIALS AND METHODS ... 39
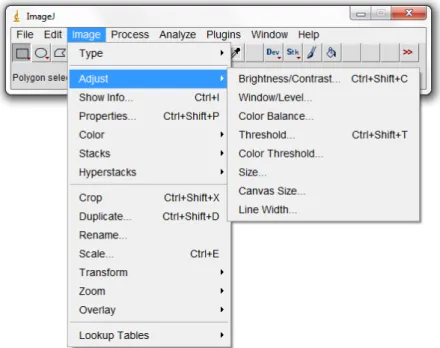
5.2.1 Software ... 39
5.2.2 Noise Evaluation ... 39
5.2.3 Determination of CNR and SNR ... 40
5.2.4 Determination of MGD ... 42
5.2.5 Determination of FOMs ... 43
5.2.6 Assessment of Uncertainties ... 44
6. RESULTS ... 45
6.1 NOISE EVALUATION ... 45
6.2 FACTORS ASSESSMENT ... 46
6.3 DETERMINATION OF MGD ... 52
6.4 DETERMINATION OF CNR AND SNR ... 54
6.5 DETERMINATION OF FOMS ... 56
6.6 COMPRESSION STUDY ... 64
7. CONCLUSION ... 67
REFERENCES ... 71
APPENDIX ... 83
APPENDIX A: FACTORS FOR MGD ASSESSMENT ... 83
List of figures
Figure 1.1: Scheme of the thesis overview. ... 2
Figure 2.1: Age-Standardized BC Incidence and Mortality Rates by World Area. Source:[17]. ... 4
Figure 2.2: Schematic of the DBT process. Source: [57]. ... 10
Figure 2.3: Tissues overlap in conventional DM (2D - left image) and hide pathologies (blue lesion) are less likely to be obscured using DBT (3D – right image). Source:[61]... 12
Figure 3.1: Schematic representation of the photoelectric effect, where the left image is before the interaction and the right image is after the interaction[71]. ... 15
Figure 3.2: Schematic representation of the photoelectric effect where the Auger electron emission can be observed[70]. ... 15
Figure 3.3: Schematic representation of the Compton Effect. ... 16
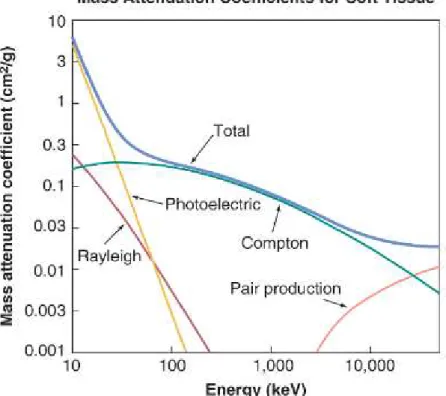
Figure 3.4: Graph of the Rayleigh, Photoelectric, Compton, Pair Production and total (sum
of all effects’ contributions) mass attenuation coefficient for soft tissue. Source:[73]. ... 20
Figure 5.1: Picture of the MAMMOMAT Inspiration system (Siemens), Hospital da Luz (Departamento de Imagiologia), Lisbon, Portugal ... 33
Figure 5.2: Diagram of the phantom used during the acquisitions. 1-7: microcalcifications; 8-14: tumour mass; 22: contrast (on the right: 100% glandular and on the left: 100% adipose tissue). Source: [102]. ... 36
Figure 5.3: Stereotactic Breast Biopsy Phantom, Gammex 164 A. Source: [103]. ... 36
List of figures
Figure 5.5: Picture of a phantom acquisition setting. As it is possible to observe, TLDs are taped on the upper face of the phantom. ... 37
Figure 5.6: Picture of the compression paddle where TLDs are taped. ... 37
Figure 5.7: ImageJ interface. ... 39
Figure 5.8: The ROIs shown are the ones used by Williams et al. (2008) to calculate SNR. Source:[111]. ... 40
Figure 5.9: Chosen ROIs used to calculate SNR in the contrast detail: phantom perspective (on the left) and in more detail (on the right). ... 41
Figure 5.10: Example of ROI used to calculate the t-factors. ... 43
Figure 6.1: Plot of the square of SD as a function of ED (in mGy), in order to carry out the
system noise evaluation. As the data don’t completely follow a linear behavior (R2
=0.9959) there is an indication of the presence of QN, EN and SN. ... 45
Figure 6.2: Plot of the square of SD as a function of ED (in mGy), in order to carry out the system noise evaluation. The polynomial fit equation, shows that other sources of noise, besides the quantum one, may affect the images. ... 46
Figure 6.3: Plot of g-factors for a 4 cm thick breast/phantom against peak tube voltage values used on this work. The values on this plot come from Appendix A: Table 4.2[99]. ... 48
Figure 6.4: Plot of the calculated t-factors to each projection angle (-24-+24) and to each peak tube voltage (24-34kV). In this graph it is also plotted the Dance t-factors for a 4 cm thick breast/phantom[100]. ... 51
Figure 6.5: (above) Tumor mass and (below) microcalcifications cluster at 24 kV in a W/Rh DM system. ... 56
Figure 6.6: (above) Tumor mass and (below) microcalcifications cluster at 26 kV in a Mo/Mo DM system. ... 56
Figure 6.7: (above) Tumor mass and (below) microcalcifications cluster at 30 kV in a W/Rh DBT system. ... 56
Figure 6.8: Plot of FOM1, and its uncertainties, as a function of peak tube voltage, to the W/R DBT system and contrast detail. FOM1 was calculated using MGDDance and MGDBoone,
which originated two different series, Dance and Boone, respectively. In this graph the maximum is set on 26 kV. ... 57
Figure 6.9: Plot of FOM2, and its uncertainties, as a function of peak tube voltage, to the W/R DBT system and contrast detail. FOM2 was calculated using MGDDance and MGDBoone,
List of figures
Figure 6.10: Plot of FOM1, and its uncertainties, as a function of peak tube voltage, to the W/R DBT system and tumor masses detail. FOM1 was calculated using MGDDance and
MGDBoone, which originated two different series, Dance and Boone, respectively. In this
graph the maximum is set on 26 kV. ... 57
Figure 6.11: Plot of FOM2, and its uncertainties, as a function of peak tube voltage, to the W/R DBT system and tumor masses detail. FOM2 was calculated using MGDDance and
MGDBoone, which originated two different series, Dance and Boone, respectively. In this
graph the maximum is set on 34 kV. ... 57
Figure 6.12: Plot of FOM1, and its uncertainties, as a function of peak tube voltage, to the W/R DBT system and microcalcifications detail. FOM1 was calculated using MGDDance and
MGDBoone, which originated two different series, Dance and Boone, respectively. In this
graph the maximum is set on 30 kV. ... 58
Figure 6.13: Plot of FOM2, and its uncertainties, as a function of peak tube voltage, to the W/R DBT system and microcalcifications detail. FOM2 was calculated using MGDDance and
MGDBoone, which originated two different series, Dance and Boone, respectively. In this
graph the maximum is set on 30 kV. ... 58
Figure 6.14: Plot of FOM1, and its uncertainties, as a function of peak tube voltage, to the W/R DM system and contrast detail. FOM1 was calculated using MGDDance and MGDBoone,
which originated two different series, Dance and Boone, respectively. In this graph the
maximum is set on 30 kV to Dance’s series and 26 to Boone’s series. ... 58
Figure 6.15: Plot of FOM2, and its uncertainties, as a function of peak tube voltage, to the W/R DM system and contrast detail. FOM2 was calculated using MGDDance and MGDBoone,
which originated two different series, Dance and Boone, respectively. In this graph the maximum is set on 30 kV. ... 58
Figure 6.16: Plot of FOM1, and its uncertainties, as a function of peak tube voltage, to the W/R DM system and tumor masses detail. FOM1 was calculated using MGDDance and
MGDBoone, which originated two different series, Dance and Boone, respectively. In this
graph the maximum is set on 30 kV. ... 59
Figure 6.17: Plot of FOM2, and its uncertainties, as a function of peak tube voltage, to the W/R DM system and tumor masses detail. FOM2 was calculated using MGDDance and
MGDBoone, which originated two different series, Dance and Boone, respectively. In this
graph the maximum is set on 30 kV. ... 59
Figure 6.18: Plot of FOM1, and its uncertainties, as a function of peak tube voltage, to the W/R DM system and microcalcifications detail. FOM1 was calculated using MGDDance and
MGDBoone, which originated two different series, Dance and Boone, respectively. In this
graph the maximum is set on 34 kV. ... 59
List of figures
MGDBoone, which originated two different series, Dance and Boone, respectively. In this
graph the maximum is set on 28 kV. ... 59
Figure 6.20: Plot of FOM1, and its uncertainties, as a function of peak tube voltage, to the Mo/Mo DM system and contrast detail. FOM1 was calculated using MGDDance and MGDBoone,
which originated two different series, Dance and Boone, respectively. In this graph the maximum is set on 26 kV. ... 60
Figure 6.21: Plot of FOM2, and its uncertainties, as a function of peak tube voltage, to the Mo/Mo DM system and contrast detail. FOM2 was calculated using MGDDance and MGDBoone,
which originated two different series, Dance and Boone, respectively. In this graph the maximum is set on 26 kV. ... 60
Figure 6.22: Plot of FOM1, and its uncertainties, as a function of peak tube voltage, to the Mo/Mo DM system and tumor masses detail. FOM1 was calculated using MGDDance and
MGDBoone, which originated two different series, Dance and Boone, respectively. In this
graph the maximum is set on 26 kV. ... 60
Figure 6.23: Plot of FOM2, and its uncertainties, as a function of peak tube voltage, to the Mo/Mo DM system and tumor masses detail. FOM2 was calculated using MGDDance and
MGDBoone, which originated two different series, Dance and Boone, respectively. In this
graph the maximum is set on 34 kV. ... 60
Figure 6.24: Plot of FOM1, and its uncertainties, as a function of peak tube voltage, to the Mo/Mo DM system and microcalcifications detail. FOM1 was calculated using MGDDance and
MGDBoone, which originated two different series, Dance and Boone, respectively. In this
graph the maximum is set on 26 kV. ... 61
Figure 6.25: Plot of FOM2, and its uncertainties, as a function of peak tube voltage, to the Mo/Mo DM system and microcalcifications detail. FOM2 was calculated using MGDDance and
MGDBoone, which originated two different series, Dance and Boone, respectively. In this
graph the maximum is set on 26 kV. ... 61
Figure 6.26: Plot of FOM1 as a function of peak tube voltage. Results refer to a detail 100%
glandular (as this work’s contrast detail) embedded in a 50% glandular 4 cm thick phantom,
obtained using a Lorad – Hologic DM system and several target/filter combinations (Mo/Mo, Mo/Rh, W/Rh and W/Ag). Source:[94]. ... 61
Figure 6.27: Plot of FOM2 as a function of peak tube voltage. Results refer to a detail 100%
glandular (as this work’s contrast detail) embedded in several 50% glandular phantoms of
different thicknesses (3cm, 5cm and 7 cm), used with a Siemens MAMMOMAT Novation DR DM system and several target/filter combinations (Mo/Mo, Mo/Rh, W/Rh). Source:[111]. ... 62
Figure 6.28: Plot of FOM1, and its uncertainties, calculated with both MGDDance and
MGDBoone as a function of compression force reduction (%) to the W/Rh DM system.
List of figures
Figure 6.29: Plot of FOM2, and its uncertainties, calculated with both MGDDance and
MGDBoone as a function of cmpression force reduction (%) to the W/Rh DM system.
Highlighted, and in order to facilitate the comparison, there are lines representative of FOM2 values to standard compression force (0% reduction). ... 66
Figure 6.30: Plot of FOM1, and its uncertainties, calculated with both MGDDance and
MGDBoone as a function of compression force reduction (%) to the W/Rh DBT system.
Highlighted, and in order to facilitate the comparison, there are lines representative of FOM1 values to standard compression force (0% reduction). ... 66
Figure 6.31: Plot of FOM2, and its uncertainties, calculated with both MGDDance and
MGDBoone as a function of compression force reduction (%) to the W/Rh DBT system.
List of tables
Table 4.1: Limiting MDG values (mGy) per PMMA phantom thickness(cm) according to the European guidelines for quality assurance in breast cancer screening and diagnosis[83]. ... 28
Table 5.1: Summary of the main characteristics of the MAMMOMAT Inspiration system (Siemens) and Selenia Dimensions 2D (Hologic). Adapted from[56]. ... 34
Table 5.2: Summary of the several acquisitions’ conditions concerning the purpose of the different carried out studies. ... 38
Table 6.1: B as a function of peak tube voltage to both systems (DM and DBT) and both target/filter combinations (W/Rh; Mo/Mo). The table also contains an average of each system’s B (Baverage) which was used to the following calculations. ... 47
Table 6.2: The first three columns have the mass energy coefficient values of Lithium Flurid and Air to each peak tube voltage (24-34 kV). The fourth column has the correction factor value to each peak tube voltage. ... 47
Table 6.3: g-factors to each target filter combination (W/Rh and Mo/Mo) and peak tube value (24-34 kV). ... 48
Table 6.4: DgN to each target filter combination (W/Rh and Mo/Mo) and peak tube value (24-34 kV). ... 49
Table 6.5: Calculated t-factors and their uncertainties to each projection angle (-24-+24) and to each peak tube voltage (24-34kV). ... 50
Table 6.6: Calculated T-factors and their uncertainties to each peak tube voltage (24-34kV). ... 51
Table 6.8: This table contains a quantitative comparison (%) between OD, MGDDance and MGDBoone as well as among MGD calculated through both formalisms. ... 53
Table 6.9: Differences in percentage (%) of calculating MGD with B or Baverage. ... 54
Table 6.10: CNR and SNR values calculated through the previous described formalisms for both DM (W/Rh, Mo/Mo) and DBT (W/Rh) systems, to a range of 24-34kV. ... 55
Table 6.11: Summary of the peak tube voltage values (kV) where FOM1 and FOM2 reach the maximum for both formalisms (Dance and Boone), both systems (DBT and DM), both target filter combinations (W/Rh and Mo/Mo) and the three different details (contrast, tumor masses and microcalcifications). ... 63
Table 6.12: “OpDose Data” column contains the peak tube voltage set as optimum value by both systems (W/Rh DM and DBT) and for the two FOMs (FOM1 and FOM2). Experimental data column contains the peak tube voltage values for which FOMs reach their maximum when analyzing the acquired data. Experimental data results refer to the contrast detail (the 100% glandular one). ... 64
Table 6.13: MGD calculated through both previously described formalisms (Dance and Boone), for both systems (DM and DBT) to several compression forces (standard (0% reduction) and with 5%, 12.5% and 20% of reduction). ... 64
Table 6.14: A comparison of MGD at 0% standard compression force and with three different reductions (5%, 12.5% and 20%) to both systems (DM and DBT). ... 65
Table 6.15: Percentage difference between FOMs calculated with the standard compression force (0% reduction) and successive reductions for both systems (DM and DBT). ... 65
Table 4.2: g-factors for breast thickness of 2-11 cm and a HVL range of 0.30-0.60 mm Al[99]. ... 83
Table 4.3: c-factors for glandularities of 0.1%-100%, breast thicknesses of 2-11 cm and a HVL range of 0.30-0.60 mm Al[99]. ... 84
Table 4.4: c-factors for breast thicknesses of 2-11 cm, a HVL range of 0.30-0.60 mm Al and women ages group (40-49 or 50-64 years)[99]. ... 85
Table 4.5: s-factors for different spectra and maximum relative errors that can be incurred when they are used[99]. ... 86
Table 4.6: c-factors for granularities of 0.1%-100%, breast thicknesses of 4 cm and a HVL range of 0.65-0.80 mm Al. Adapted from[100]. ... 86
Table 4.7: T-factors for the Siemens Inspiration Tomographic system for breast thickness range of 2-11 cm. Adapted from [100]. ... 87
List of tables
Table 4.9: DgN(mRad/R) values for the target filter combination W/Rh (50-m-thick), two different granularities (0% and 100%), breast thickness from 2 to 12 cm, several peak tube voltages (20 – 40 kV) and correspondent HVL values(mm Al)[89]. ... 88
Table 4.10: DgN(mRad/R) values for the target filter combination Mo/Mo (30-m-thick), two different granularities (0% and 100%), breast thickness from 2 to 12 cm, several peak tube voltages (20 – 40 kV) and correspondent HVL values(mm Al)[89]. ... 90
Table 6.16: FOMs and their uncertainties, calculated with MGDDance and MGDBoone as a function of peak tube voltage for both systems (DM and DBT) and target/filter combinations (W/Rh and Mo/Mo). Results refer to the contrast detail. ... 92
Table 6.17: FOMs and their uncertainties, calculated with MGDDance and MGDBoone as a function of peak tube voltage for both systems (DM and DBT) and target/filter combinations (W/Rh and Mo/Mo). Results refer to the tumor masses detail. ... 93
Table 6.18: FOMs and their uncertainties, calculated with MGDDance and MGDBoone as a function of peak tube voltage for both systems (DM and DBT) and target/filter combinations (W/Rh and Mo/Mo). Results refer to the microcalcifications detail. ... 94
Table 6.19: CNR and SNR and their uncertainties, calculated as part of the compression study, for both W/Rh DM and W/Rh DBT. ... 95
Acronyms
2D 3D AEC ALARA aSe aSi BC CC CNR CT DBT DgN DICOM DM ED EN FOM HVL ICRP
Two-Dimensional Three-Dimensional
Automatic Exposure Control As Low As Reasonably Achievable Amorphous Selenium
Amorphous Silicon Breast Cancer Craniocaudal
Contrast-to-Noise Ratio Computed Tomography Digital Breast Tomosynthesis Normalized Glandular Dose
Digital Imaging and Communications in Medicine Digital Mammography
Entrance Dose Electronic Noise Figure-Of-Merit Half-Value Layer
Acronyms
ICRU IOD IST K MG MGD MLO MPV OD PCPs PMMA QN R ROI SD SFM SI SN SNR TFT TLDs
International Commission on Radiological Units and Measurements Information Object Definition
Instituto Superior Técnico Incidence Air Kerma Mammography
Mean Glandular Dose Mediolateral Oblique Mean Pixel Value Organ Dose
Primary Care Physicians Poly(Methyl Methacrylate) Quantum Noise
Roentgen
Region of Interest Standard Deviation
Screen-Film Mammography
International System (from French Système International) Structured Noise
Signal-to-Noise Ratio Thin-Film-Transistor
1.
Introduction
1.1 Motivation and Objectives
Breast cancer (BC) is a problem of public health: even if it is not one of the most lethal, it is the most frequently diagnosed type of cancer [1] and it has a high mortality rate, especially for women, once there are only 1% of incidences amongst men [2]. It is the leading cause of cancer death among females, accounting for 23% (1.38 million) of the total new cancer cases and 14% (458,400) of the total cancer deaths in 2008[1].In Portugal there is a female population of 5 million, where there are 4500 new cases and 1500 deaths per year. This is an average of 12 new cases/day and 4 deaths/day [2]. In response to this issue, around 650 000 mammographies are performed, per year, in Portugal [3].
Concerning this reality and the magnitude of these numbers, studies related to Mammography systems are very important in order to have a better image quality, with a lower dose, which would allow most effective cancer detection.
Despite its popularity, the accuracy of mammography is limited by anatomical noise resulting from the superimposition of normal structures. In clinical practice, this may affect both sensitivity and specificity: cancer detection may be limited, particularly in younger women and those with dense breast patterns because mammographic evidence may be completely or partially obscured [4]. These problems can lead to false-negatives. Additionally to that, overlapping tissue might also simulate breast lesions, resulting in false-positives [5] or even overtreatment, which originates emotional unnecessary distress to the patients.
One technique that might be able to overcome these issues is Digital Breast Tomosynthesis (DBT). DBT has been available in Europe and other countries recognizing the CE mark (indicates the compliance with European Union legislation) since 2008[6]. It allows the study of three-dimensional (3D) information obtained through the acquisition of several projections at different angles. So, this technique may improve both sensitivity and specificity in BC detection [5].In fact, there are already initial results from tomosynthesis versus mammography studies that show a tendency for better imaging, higher accuracy and lower recall rates [7], [8], [9], [10], [11]. Yet several authors state that further studies are needed in order to clarify DBT benefits and its role as a substitute of traditional DM in the clinical environment[12], [13], [14], [15], [16]. This can also be highlighted by the fact that so far there are no official European guidelines on how to perform DBT exams.
1.
Introduction
in this work, such analysis is performed with a clinical system, as well as a comparison in terms of image quality/dose performances with a standard mammographic system. Besides that, the accuracy of two different formalisms, commonly used to calculate mean glandular dose (MGD) in mammography/DBT exams is also assessed.
Once compression force is not only one of the parameters during DM/DBT acquisitions, but it is also one issue that affects the patients’ comfort during the exam, it was also performed a compression study and a comparison between both techniques.
1.2 Thesis Overview
This thesis is divided in 4 parts: Preliminaries, Materials and Methods, Results and Discussion and Appendix. The first one includes the first four chapters. It is an introduction to the thesis and to its background. In particular all the necessary concepts of breast imaging, x-ray physics in diagnostic energy range and dosimetry will be discussed. The second part, Materials and Methods, contains all the systems and software used, and the approaches followed when acquiring and analysing the data. Results and Discussion comprise all the results obtained through the data analysis, the relevant discussions and of course this work’s
conclusions. Finally, Appendix is constituted by relevant additional information and is divided by subjects. Figure 1.1is a scheme of this thesis’ organization.
Figure 1.1: Scheme of the thesis overview. Preliminaries
• Introduction
• Breast Imaging
• X-Ray Physics in Diagnostic Energy Range
• Dosimetry
Materials and
Methods • Materials and Methods
Results/Discussion • Results and Discussion
• Conclusion
Appendix • Appendix A
2.
Breast Imaging
In this chapter it will be discussed some important issues and considerations related to breast imaging. First of all, it will be done an extend description of the worldwide numbers that, nowadays, characterize breast cancer, in order to introduce the breast cancer screening subject. Here, all the different opinions concerning breast cancer screening importance, efficiency and finally implementations will be presented. After that, a brief description of breast lesions will be provided as well as mention of current breast imaging techniques. Descriptions of mammography and digital breast tomosynthesis will close this chapter.
2.1 Breast Cancer Screening
Breast cancer (BC) is a problem of public health, even if it is not one of the most lethal, it is the most frequently diagnosed type of cancer[1] and it has a high mortality rate, especially for women, once there are only 1% of incidences amongst men[2]. It is the leading cause of cancer death among females, accounting for 23% (1.38 million) of the total new cancer cases and 14% (458,400) of the total cancer deaths in 2008[1].
About half of the BC cases and 60% of the deaths are estimated to occur in economically developing countries. In general, incidence rates are high in Western and Northern Europe, Australia/New Zealand, and North America; intermediate in South America, the Caribbean , and Northern Africa; and low in sub-Saharan Africa and Asia[1](Figure 2.1).
In Portugal there is a female population of 5 million, where there are 4500 new cases and 1500 deaths per year. This is an average of 12 new cases/day and 4 deaths/day[2].
2. Breast Imaging
Figure 2.1: Age-Standardized BC Incidence and Mortality Rates by World Area. Source:[17].
In 2012, an Independent UK Panel on Breast Cancer Screening[21] reviewed randomized trials and concluded that evidence suggests a 20% reduction in mortality in women invited to participate in a 20-years screening program (one breast cancer death prevented for every 235 women invited to screening, and one death averted for every 180 women who attended screening), though a lot of uncertainty surrounds this estimate.
There is also a mid-term opinion. Harris et al.(2011) [22] in their review concluded that current observation evidence shows that BC in actual populations of women aged 50 to 69 reduces BC mortality though the magnitude of the effect is probably smaller than predicted in the randomized controlled trials. More, they concluded that the evidence is insufficient to determine whether the magnitude of mortality reduction is decreasing over time. In their opinion, as treatment and other personal factors associated with BC mortality change, this question should be re-evaluated and screening programs should be closely monitored.
Despite all the different opinions, BC screening is still a prevalent popular practice and it seems to be the one with the largest overall effect of any intervention on the mortality from BC. According to Meissner et al. (2011)[23], who analysed a survey directed to primary care physicians (PCPs), 99% of the PCPs reported that, for average-risk women aged 50 years old, mammography was effective in reducing cancer mortality. Among them, 80% reported that it was very effective and 19% reported that it was somewhat effective. Concerning women ages 40 to 49, 96% reported mammography was at least somewhat effective.
2. Breast Imaging
common techniques applicable in BC screening are Breast Self-Examination, Clinical Breast Examination, Mammography, Ultrasound, and Magnetic Resonance Imaging. But, the standard procedure for the early detection of BC is mammography, and due to the nature of this work, BC screening with mammography will be the focus from now on.
Around 2000, mammography screening was widespread in many high-income countries but the way it was implemented was highly variable within and between countries. In 2011, the two main differences in the way breast screening works are: first, whether screening is centrally organized with invitation of women in target age groups, or whether screening is left
to women and doctor’s initiative; second, the age at which screening should start or end has always been a subject of contention, with considerable literature on pros and cons of screening before age 50 or after 70 [24].
In the UK, the National Health Service Breast Screening Programme invites all women for triennial mammographic screening between 50 and 70 years of age. Once a woman reaches 70, she may request continued screening[25].
In Portugal there is a Breast Cancer Screening Programme (Programa de Rastreio de Cancro da Mama) developed by the National Health Service (Serviço Nacional de Saúde).
This covers all the Centre Region and some regions of Southern and Northern counties. In this program, full equipped mobile units are sent every two years along with invitations to all health centres registered 45-69 years old women (screening age)[2].
2.1.1 Screening Age and Frequency
As it has been referred, the BC screening age is still a matter of discussion among experts all over the world. Consensus is lacking about the start/end screening age.
The risk of BC is age-dependent. The probability of developing BC is equal to 0.04% per year for average risk women between 30 and 39 and increases >10% per year in those over 80 years[26]. Although incidence and mortality rates are higher in older women, the question of screening in this population must be considered in the context of competing risks of death from comorbid conditions, limited longevity, and a woman’s overall health status[20]. Current opinion is that women with a predicted life expectancy of over 5 years may benefit from screening, whereas those likely to survive <2 years may not benefit[27], [28]. On the other hand, it should also be considered that starting screening earlier increases the cumulative risk of false positives which lead to further procedures that might include invasive ones[29].
Nevertheless, concerning this, the two questions remain: When should women start undergo BC screening? And when should they finish?
Besides the screening age, its frequency is also a matter of discussion. Since the goal of screening is the reduction in the incidence rate of advanced disease, the screening interval should be set for a period of time in which adherence to routine screening is likely to result in the detection of the majority of cancers while still occult[20].
Mortality reductions for women aged 40 to 69 have been observed in trials that screened at intervals of 12 and 24 (and over) months[20]. However, there are some works that provided persuasive evidence that younger women likely will benefit more from annual screening than at two-year intervals[30], [31].
2. Breast Imaging
The recommendations of the American Cancer Society, updated in 2003, are: women should begin mammography at age 40; screening decision in older women should be individualized by considering the potential benefits and risks of mammography in the context of current health status and estimated life expectancy; as long as a woman is in reasonably good health and would be a candidate for treatment, she should continue to be screened with mammography; women at increased risk might benefit from additional screening strategies such as earlier initiation of screening (at age 30 or, rarely, at younger ages), shorter screening intervals or the use of other screening modalities[20].
In 2009 the U.S. Preventive Services Task Force revised their recommendations[32]. They recommend against routine screening mammography in women aged 40 to 49 years and recommend biennial screening mammography for women between the ages 50 and 74 years.
In 2012, the European Society of Breast Cancer Specialists also published some recommendations concerning the management of young women with BC[33]. In summary they advise that screening mammography should not be performed in high-risk women below 35 years old, and, starting at this age, annual mammography may be considered.
Despite all the different guidelines, there is some evidence that physicians practice defensive medicine, i.e., if guidelines are ambiguous they may screen more aggressively because of concerns about medical malpractice litigation[34]. Furthermore, patients’ expectations and anxiety also may influence physicians’ decisions to screen even if they
would not necessarily have recommended the test based solely on their beliefs about test efficacy[23]. This is shown in Barker and Galardi (2011)[35] where reactions of women with breast cancer to the 2009 U.S. Preventive Services Task Force recommendations are examined through electronic postings from five breast cancer discussion boards. In this work it became clear that in general women believe in mammography screening, giving less importance to the possibility of false-positives or even overtreatment. Also in Gigerenzer G et al. (2009) it was assessed that most European citizens tend to overestimate the mortality reduction from cancer screening (92% of the asked women, one women for every 1000 screened)[36].
2.1.2 Breast Cancer Screening Harms
As every technique, besides its advantages, mammographic screening has its risks, limitations and harms. These include: risks associated with false-negative examinations, additional diagnostic testing induced by false-positive examinations (overdiagnosis), psychosocial consequences of abnormal examinations (emotional distress), potential risk of overtreatment and potential risk from radiation exposure.
But, in fact, the relationship between risk, benefit, limitations and harms is complicated by the fact that not only is it multifactorial, but also that individual women likely will weigh the benefits limitations and harms of screening differently depending on their age, values, and their understanding of the issues[20], [35].
Whether BC screening does more harm than good has been debated extensively, the main questions are how large the benefit of screening in terms of reduced BC mortality and how substantial the harm is in terms of overdiagnosis, which is defined as cancers detected at
screening that would not have otherwise become clinically apparent in the woman’s
2. Breast Imaging
According to an Independent UK Panel on Breast Cancer Screening[21] about 11% of the people invited to be screened are overdiagnosed. The consequence of this is that women have their cancer treated by surgery and in many cases radiotherapy and medication, but neither them or their doctor can know whether this particular cancer would be one that would have become apparent without screening and could possibly lead to death, or one that would
have remained undetected for the rest of the woman’s life.
Besides overdiagnosed and overtreatment, the possible benefit of early detection by mammography screening can also be reduced by the risk of tumor induction through radiation. This subject was raised by Jansen-van der Weid et al. (2010)[37] concerning below age 20 high-risk women, i.e., women with familial or genetic aggregation of breast cancer, which might be a result of mutations on genes BRCA1 and BRCA2. In their work, and considering that women in these conditions are offered screening outside the population screening program, it was observed that exposure to low-dose radiation increases breast cancer risk among high-risk women and that this effect is larger among women who are exposed more frequently (2, 5 or 10 exposures) or at a younger age (20). Therefore, they recommend an adaptation of the screening programs: using non-ionizing techniques at a younger age, reducing the number of mammograms and the mean glandular dose per exam.
2.2 Breast Tissues and Pathologies
Breasts are made up of adipose (fatty) tissue, fibrous tissue, and glandular tissue. Someone is said to have dense breast tissue (as seen on a mammogram) when they have more glandular and fibrous tissue and less adipose tissue[38]. In general breast cancer (BC) tends to appear in glandular tissue.
There are several breast pathologies, but to the scope of this work only two of them will be approached: calcifications and masses. Calcifications are small mineral deposits within the breast tissue. They may or may not be caused by cancer[39]. There are 2 types of calcifications:
Macrocalcifications are coarse (larger) calcium deposits that most likely represent degenerative changes in the breasts, such as aging of the breast arteries, old injuries, or inflammation. In general these deposits are associated with benign (non-cancerous) conditions and do not require a biopsy[39].
Microcalcifications which are small specks of calcium in the breast. They may appear alone or in clusters. Their shape and layout might be an indicative of their malignancy[39].
A mass may occur with or without calcifications. It is an area that looks abnormal and it can be cancerous or on-cancerous[39].
2.3 Breast Imaging Techniques
2. Breast Imaging
2.3.1 Mammography
Breast imaging systems should be able to detect the smallest variations of the parameters of interest of a pathology and their transference to the image should be a linear one[40]. They should be able to visualize very small masses of tissue of interest and be innocuous at the same time[40]. One of the most popular techniques that meet these requirements is mammography.
Mammography involves simultaneously a low dose in the irradiated tissue, large
contrast and large spatial resolution. In fact, it is already possible to demand contrast’s
detections 1% and resolution distances 100m[40].
In order to perform a mammography, the patient's breasts are placed on a fixed flat panel and pressure is applied to the breast with another panel (compression paddle).Breast compression in mammography reduces both breast thickness (allowing an higher contrast[40]) and radiation dose and increases image quality (once it reduces motion, it approaches the structures of the detector[40], and it separates them in the imaged 2D plane[41], permitting the visualization of small lesions[42]). But, the pain of breast compression might deter women from attending breast screening, being this issue an important factor to be improved[43].
The compressed breast is then exposed to ionizing radiation. Energy which passes through the breast is transformed into an electrical signal by a detector which produces the clinical image. The image that is produced in any projection, such as a craniocaudal (CC) or mediolateral oblique (MLO) view, is a two-dimensional (2D) representation of three-dimensional (3D) space[44]: in fact, it can be said that everything between the beam entrance and the breast exit is projected into a plane.
There are two types of mammography techniques: screen-film mammography (SFM) and digital mammography (DM).
SFM has been successfully used as a screening tool for breast cancer for around 35 years. It uses film to produce an image of the breast. Even though SFM is considered a very good screening tool for detecting irregular breast characteristics, studies have revealed that film mammography is less sensitive for women who have dense breasts. Perhaps the most limiting issue with film mammography is the film itself. Once an image of the breast has been created on the film, it cannot be significantly altered, magnified, or brightened, which would allow a better assessment of the image.
The main advantage of any digital imaging system, and a DM system is no exception, is the separation of image acquisition, processing and display, allowing optimization of each of these steps[45].
DM uses a digital detector instead of the fluorescent screen film used in SFM[46]. It acquires and records a digital image of the breast that is stored electronically rather than on film[47]. Each pixel is therefore an average of the information obtained through the full thickness of the breast[44]. This electronic method allows images to be stored and shared more easily than film mammography and image-processing algorithms allow manipulation of
fine differences in image contrast. DM uses less radiation when compared with SFM, lowering the dose of radiation exposure in women; however, larger breasts may require higher exposures.
2. Breast Imaging
transporting, loading and unloading film cassettes, DM reduces the processing time.
Consequently the radiologist technician is quickly able to check the mammogram’s quality before the patient leaves the screening unit, which reduces the number of technical recalls[45].
Pisano et al.(2008)[48] showed that DM performs significantly better than SFM for pre- and perimenopausal women younger than 50 years with dense breasts, but that SFM tended non-significantly to perform better for women aged 65 years or older with fatty breasts.
But, in general DM has been well-evaluated for the diagnosis of BC and is nowadays a common proceeding.
Nonetheless, scientific data show that mammography alone, especially in dense breast tissues, has its weaknesses[7]. Mammographic tumor size measurement is not infrequently made difficult since breast structures are superimposed onto a 2D plane, and this may obscure the tumor outline[49]. (These structures form the background on the mammogram and are
named “anatomic background”[50].) In addition, mammographic estimates of tumor extent may be influenced by variations in the distance between the tumor and the film/detector, and compression of the breast during examination[49]. Moreover, standard imaging projections do not always capture the maximum tumor extent[49].
In summary, the accuracy of conventional DM is limited by anatomical noise resulting from the superimposition of normal structures. In clinical practice, this may affect both sensitivity and specificity: cancer detection may be limited, particularly in younger women and those with dense breast patterns because mammographic evidence may be completely or partially obscured[4].
When screening mammograms demonstrate a questionable finding, the results of follow-up diagnostic mammography and ultrasonography, magnetic resonance imaging or biopsy ultimately determine whether the finding is significant[51]. The process causes anxiety for patients and incurs additional healthcare costs for findings that are frequently proved benign[51].
2.3.2 Digital Breast Tomosynthesis (DBT)
Digital Breast Tomosynthesis (DBT), Figure 2.2, is a diagnostic modality that uses
conventional x-rays and digital detector. At first sight, both equipment and procedure are similar to DM: the patient has to stand in front of the DBT equipment and place one of her breasts on the x-ray plate. A separate flat plate will then be brought down on the top of the breast in order to compress it. As seen before, in DM, breasts are highly compressed so as to reduce tissue overlap. But, since in DBT there is a better separation of the tissue structures in the depth direction[41], high compression pressure is not needed for tomosynthesis imaging. Therefore there is the possibility of less painful compression using DBT[41], [52].
DBT’s principle has been known since the 1930s, being a refinement of conventional x -ray geometric tomography systems[53]. Grant(1972)[54] coined the term “tomosynthesis”,
referring to the ability to retroactively create an infinite number of arbitrary tomograms. In 1997, the first highly recognized article regarding breast tomosynthesis was published by Niklason et al.(1997) [55].
Even though the technique’s principle is quite old, DBT development was held back for
2. Breast Imaging
with the introduction of flat panel selenium-based detector into breast imaging[52], [56]. In fact, in most equipment it is used an amorphous selenium (aSe) detector, once this has the largest field of view available in any commercial detector.
The main difference is that DBT acquires tomographic cross-sectional images of a breast (volume of tissue) at multiple angles during a short scan. The range of angles over which projection images are acquired is called the tomography angle, and it can vary from 11
to 60 of arc movement[44]. It can be different among the manufacturers. However it is claimed that a wide angle provides better depth resolution while a narrow one enhances the in-plane resolution[56]. Either way, because of the limited angle of scanning, the images are
only “quasi 3D”: the x-y plane perpendicular to the x-ray beam has the highest resolutions; the parallel plane or z axis has less[44]. Another important consideration is the motion of the x-ray source during acquisition: it can move in a continuous or step-and-shoot motion[52].In the first mode, scan speed must be slow enough, or each x-ray exposure short enough to avoid image blurring due to focal spot motion ; in the second one, the gantry must come to a complete stop at each angular location before turning on the x-rays, in order to avoid vibration that would blur the image[52]. Data acquired with the step-and-shoot method takes longer and results in more image artefacts due to the patient motion[51].
Figure 2.2: Schematic of the DBT process. Source: [57].
2. Breast Imaging
Equation 2.1
where Doseprojection is a dose of each projection and Dosetotal,exam is the total dose of a DBT exam and no.projections is the total number of projections.
These projections are then processed using algebraic reconstruction algorithms producing a series of thin, high resolution slices (typically 1mm thick) which will be presented to the clinical reader and can be displayed individually (each one of them might be brought into focus by varying the amount of shifting, allowing the enhancement of the information contained in each plane while blurring the off-focus one), or in a dynamic ciné mode. The used algebraic reconstruction algorithms, generically described as “shift and
add”[58], aim to produce images in which the low contrast objects are conspicuous, fine details are visible and there are few artefacts[56]. Manufacturers can use different algorithms, certain of them may be better for tumor masses whilst others are better for calcifications[44]. Although details of specific manufacturer algorithms are not always available in the public domain, some have already appeared in DBT studies: Shift-and-Add, Back Projection, Filtered Back Projection, Tuned Aperture Computed Tomography, Iterative Matrix Inversion Tomosynthesis, Maximum-Likelihood Algorithm, Algebraic Reconstruction Technique and Gaussian Frequency Blending[59]. Summary if, for example, a 40 cm compressed breast is reconstructed at 1mm slice thickness, there will be 40 slices for the physician to analyse.
It is important to empathize that, as mammography, DBT images can be obtained in any orientation including CC, MLO and true lateral orientations[60].
In conclusion, DBT allows the reconstruction of a 3D volume of the compressed breast using 2D projections. Due to all these acquired images and processed data, DBT modality generates a large amount of files for each examination that make particular demands on the imaging IT network infrastructure.
One of the challenges presented to DBT projection images is minimizing the electronic noise. In order to overcome this, manufacturers have introduced x-ray tubes with either a rhodium (Rh) or a tungsten (W) target, employing an higher energy x-ray spectra[56]. These spectra have the advantage of being more penetrating, leading to a lower breast dose while a greater photon number reaches the imaging detector, reducing the relative amount of quantum noise in the image. But, the disadvantage is that a lower radiographic contrast is generated by the structures of interest in the breast. However, on balance, these spectra leads to an improvement in the contrast to noise ratio [56].
Concerning the filters’ materials, the rhodium ones are already widespread, and there
are also some of Aluminium (Al) and Silver (Ag).
A tomosynthesis data set virtually eliminates detection challenges associated with overlapping dense fibroglandular tissue within the breast (sometimes also known as
“structural” or “anatomical” noise[56]), which can reduce the visibility of malignant abnormalities (false negative) or simulate the appearance of an abnormality (false positive), leading to unnecessary recalls, biopsies and emotional distress. This feature is considered the primary drawback of conventional 2D analog and digital mammography. In addition, DBT offers other potential benefits including increased lesion and margin visibility, help in localizing structures in the breast, a reduction in recall rates, and increased cancer detection.
2. Breast Imaging
Figure 2.3: Tissues overlap in conventional DM (2D - left image) and hide pathologies (blue lesion) are less likely to be obscured using DBT (3D – right image). Source:[61].
DBT has been available in Europe and other countries recognizing the CE mark (indicates the compliance with European Union legislation) since 2008[6]. In Portugal there are already three of these systems[62].
Some studies have been carried out in order to compare DBT and DM, which originated certain contrary results.
Early investigations found that digital mammography was often superior to tomosynthesis for calcification visualization[42]. Kopans et al. (2011) [63], for example, found that the characterization of calcification in tomosynthesis was equal or superior to their characterization in conventional digital mammography in 92% of the cases studied. But, on the other hand, Helvie(2010)[44] states that “It is unlikely that calcification characterization would improve dramatically” and Spangler et al.(2011)[64] conclude that DM appears to be slightly more sensitive that DBT for the calcifications detection, even if they point out that improvements in processing algorithms and display could potentially improve DBT for this purpose.
Andersson et al.(2008)[65] obtained results that indicated that single-view DBT ultimately may have a higher sensitivity for breast cancer detection that either single- or two-view DM. Along with this, Gennaro et al. (2010)[58] proved that DBT in 1 two-view is not inferior to DM in 2 views which allows a dose reduction. Fornvik et al.(2010)[49] indicate that DBT is superior to DM in the assessment of breast tumour size and stage.
Svahn et al.(2012)[12] compared the ability of radiologists to detect breast cancers using DBT and DM in an enriched population of abnormal (diseased) patients and benign and/or normal (healthy) patients. The results of the study showed superior diagnostic accuracy of DBT compared with DM. According to them, breast cancer detection can be improved with DBT.
According to Skaane et al.(2012)[66] DBT is a promising new technique that has the potential of increasing the sensitivity, especially for cancers manifesting as speculated masses and distortions. Also the work of Zuley et al.(2013)[67] agrees on this.
3.
X
-
ray Physics in Diagnostic Energy Range
3.1 Interaction of Radiation with Matter
In this chapter interaction of radiation with matter in the diagnostic energy range will be discussed. It will be described the interactions of photons with the material, once those are the ones important to originate DM and DBT images.
3.1.1 Interaction of Photons with Matter
An incident photon upon a material may pass through it with no interaction at all, and consequently no loss of energy. Or, in the other hand, it may interact in one or a few so called
‘catastrophic events’ losing its energy[68].
Photons don’t continuously loose energy while traversing the matter, so they are able to
traverse a large distance until the collision with the atom occurs. The value of this distance depends on the interaction probability per length unit of the matter. This probability is related to the energy of the photon and with the characteristics of the matter, namely the atomic number of its constituents[69].
When a photon beam traverses a material, part of those photons is involved in interactions. Nevertheless, the individual energy of the photons of the beam that don’t interact
with the matter remains unchanged[70].
Photons deposit their energy in the matter through two stages: in the beginning the energy is transferred to light charged particles and then it is deposited in the matter through these particles. Photons might interact with the matter in different ways, and the interest of some of those interactions relies only on theory, in order to better understand the processes of photons-matter interactions. On the other hand, there are other types of interactions which are extremely important to medical physics, once they play a key role in medical image, radiotherapy and radiation dosimetry[71].
3.1.1.1 Cross Section
While interacting with matter, photons can do it directly with the atoms of that matter as
a whole, with the atoms’ nucleus or with the atomic orbital electrons. These different
3. X-ray Physics in Diagnostic Energy Range
beam interact, or, in other words, which interaction has higher probability to occur, it is necessary consider the cross section value of each interaction, to a given photons energy[69], [70], [71].
Considering a beam of particles with a fluence rate ̇, i.e. number of incident particles in the target per area unit per time unit, it is known that after the interaction, some of the particles will be scattered. The number of particles per time unit, dN, scattered per solid angle
unit, d, divided by the value of particles incident fluence rate, ̇, defines the differential
cross section (Equation 3.15) [70]:
̇
( ) Equation 3.15
As it can be observed in the above equation, the differential cross section depends on the incident particles energy. For that reason, it is possible to integrate that value in the solid angle variable, in order to obtain the total differential cross section to each energy[70] (Equation 3.16):
( ) ∫ Equation 3.16
The cross section unit is barn (b): 1b = 10-24 cm2. As bigger is, bigger is the interaction incident particle-target probability[70].
3.1.1.2 Interactions Processes
The photon-nucleus interaction can occur in a direct way (originating a photodisintegration process) or can occur between a photon and the electrostatic field of the nucleus (which is called the pair-production process).
The interactions with the orbital electrons are characterized according to the strength of the electron bonding. It is considered a weak bonding if the bonding energy of the electron is lower that the incident photon energy, so this electron-photon interaction is considered as a free electron-photon interactions. On the other hand, it is strong bonding, if the bonding energy of an orbital electron is higher or equal to the atom as a whole energy. So, if it is a weak bonding, interaction processes as Thompson scattering, Compton effect or triplets production will occur. If it is a strong bonding, Photoelectric effect occurs[71].
3. X-ray Physics in Diagnostic Energy Range
3.1.1.2.1 Photoelectric Effect
The photoelectric effect is the most important interaction of low energy photons with matter[68]. This interaction is between a photon and a strong bonding orbital electron. The photon is completely absorbed and the orbital electron, which is designated as photoelectron, is ejected. This type of interaction, between a photon with energy ℎ and a K-shell atomic electron is represented in Figure 3.1[71].
Figure 3.1: Schematic representation of the photoelectric effect, where the left image is before the interaction and the right image is after the interaction[71].
The photon is completely absorbed and the K-shell electron is ejected from the atom with a kinetic energy of EK (Equation 3.1):
EK = ℎ− EB (K), Equation 3.1
where EB (K) is the bonding energy of the K-shell electron and ℎ is the photon energy.
When the photon energy is higher than the bonding energy of the K-shell of the matter, i.e. ℎ > EB (K), about 80% of the photoelectric absorption occurs in the middle K-shells of
the matter[71].
Thevacancy left by the electron is fulfilled with another electron, from an upper shell, in order to stabilize the atom. This transition leads to the emission of a photon of equal energy to the difference between the two energy levels. Generally, these photons are in the X-ray area of the electromagnetic spectrum. Besides this, an X-ray photon emitted as a consequence of the photoelectric effect might originate another orbital electron ejection, designated as Auger electrons. This process is represented in Figure 3.2[70].
![Figure 2.1: Age-Standardized BC Incidence and Mortality Rates by World Area. Source:[17]](https://thumb-eu.123doks.com/thumbv2/123dok_br/16545688.736927/32.892.271.601.114.614/figure-standardized-incidence-mortality-rates-world-area-source.webp)
![Figure 3.2: Schematic representation of the photoelectric effect where the Auger electron emission can be observed[70]](https://thumb-eu.123doks.com/thumbv2/123dok_br/16545688.736927/43.892.254.634.835.1097/figure-schematic-representation-photoelectric-effect-electron-emission-observed.webp)