Molecular characterization of the fibrinogen-erythrocyte interaction and its influence on cardiovascular pathologies by AFM-based force spectroscopy
Texto
Imagem
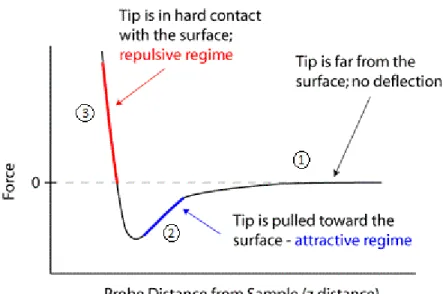
![Figure 1. “Small ball on a weak spring” model [6].](https://thumb-eu.123doks.com/thumbv2/123dok_br/16539728.736675/29.892.392.586.124.376/figure-small-ball-on-a-weak-spring-model.webp)
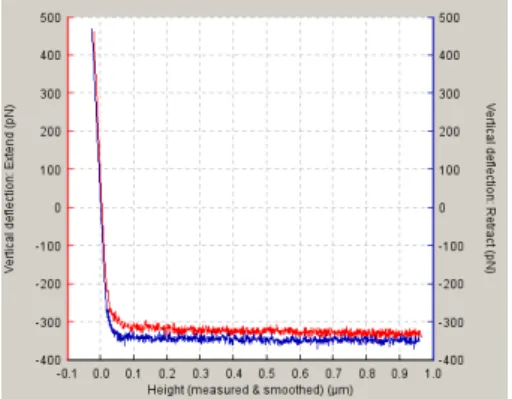
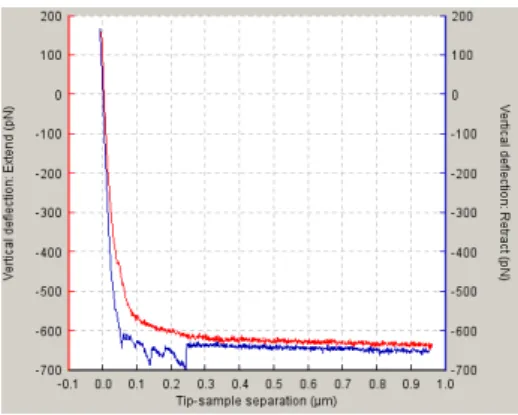
![Figure 5. Approach/Retraction cycle. This schematic represents the vertical deflection of the tip during force spectroscopy [7]](https://thumb-eu.123doks.com/thumbv2/123dok_br/16539728.736675/32.892.200.817.148.282/figure-approach-retraction-schematic-represents-vertical-deflection-spectroscopy.webp)
Documentos relacionados
Repulsive force is generated by negative charges on the red blood cell surface that occur due to the presence of the carboxyl group of sialic acids in the cell membrane; these
Zeta potential results ( Table 3 ) showed that the unloaded NC and NC containing radiolabeled and unlabeled fluconazole exhibited a negative charge with values ranging from −55.4
It was observed that in the control group a decrease in the muscle tension (intensity of the muscle force) occurred during the tetanic contractions and this reduction
In this paper a simple algorithm is proposed to provide artifact identification signaling in-situ tip features in atomic force microscopy images.. The base of the identifications
time on the electrical conductivity of CA/PANI composite fibers prepared by in situ chemical oxidation... AFM Atomic
The aim of this study was to evaluate by atomic force microscopy (AFM) the early phases and evolution of dental enamel erosion caused by hydrochloric acid exposure,
Based on the above considerations, the objective of this work was the synthesis and characterization of the mixed oxide ZrD 2 -SiD 2 as well as the modiication of its acid force
The use of atomic force microscopy techniques, electric force microscopy, shows a powerful tool in analyzing phenomena associated to grain boundary regions. The
