UNIVERSIDADE DO ALGARVE
UNIVERSITY OF ALGARVEFACULDADE DE CIÊNCIAS E TECNOLOGIA
FACULTY OF SCIENCES AND TECHNOLOGY“MODELLING OF PRODUCTIVITY, WATER QUALITY
EFFECTS AND PROFIT OPTIMIZATION OF PACIFIC OYSTER
(CRASSOSTREA GIGAS) FARMS: APPLICATION OF THE FARM
MODEL AND GIS IN THE VALDIVIA ESTUARY OF CHILE”
MESTRADO EM GESTÃO DA ÁGUA E DA COSTA
(CURSO EUROPEU)
ERASMUS MUNDUS EUROPEAN JOINT MASTER IN WATER AND
COASTAL MANAGEMENT
CLAUDIO SILVA GALLINATO
NOME / NAME: CLAUDIO SILVA GALLINATO
DEPARTAMENTO / DEPARTMENT: Química, Bioquímica e Farmácia
– Faculdade de Ciências e Tecnologia da Universidade do Algarve
ORIENTADOR / SUPERVISOR:
João Gomes Ferreira, Department of Environmental Sciences and
Engineering, Faculty of Sciences & Technology, New University of Lisbon
Alice Newton, Department of Chemistry and Biochemistry, Faculty of
Science and Technology, University of Algarve
Angel Del Valls, Department of Chemistry Physics, Faculty of Marine and
Environment Sciences, University of Cádiz
DATA / DATE: (March 2, 2009)
TÍTULO DA TESE / TITLE OF THESIS: “Modelling of productivity,
water quality effects and profit optimization of Pacific oyster (Crassostrea
gigas) farms: application of the FARM model and GIS in the Valdivia
estuary of Chile”
ACKNOWLEDGEMENTS
To my supervisors Prof. Alice Newton, Prof. João Gomes Ferreira and Prof. Angel Del Valls. For your time and support.
Thanks to Prof. Angels Del Valls and his team in U. Cádiz for their great support.
To the most important people in my life, my wife Kala and my kids Cristóbal and Nicolás, they gave me the support, motivation and love to finish this nice scientific adventure.
RESUMO
Uma abordagem integrada da modelo Farm Aquaculture Resource Management (FARM) e Sistema de Informação Geográfica (SIG) tem sido aplicado a aquicultura da ostra du Pacífico com sistemas palangre suspenso. O desempenho do modelo FARM, aplicado para simular a produção potencial, dados econômicos, qualidade da água e impactos na escala-local, foi testado em quatro sítios potenciais (Tornagaleones, Valdivia, baía de San Juan Corral e Enseada) no estuário Valdivia du Chile. O resultados da modelo FARM foram integrados em um Índice de Adequação Sustentável da Aquicultura (IASA) espacialmente variável através de uma técnica Avaliação Multicritério (AM) de SIG.
Para descrever a variabilidade ambiental do estuário Valdivia, relações significativas entre as variáveis ambientais foram estimados aplicando análise estatística multivariada, como análise fatorial e análise dos componentes principais.
Dados sazonais foram utilizados como forzantes para o modelo FARM. Resultados da modelagem mostram boa concordância com os comprimento total individuais relatados em duas fazenda de cultivo durante um período de 395 dias: simulado comprimento de 8,1 cm de ostra du Pacífico em Tornagaleones (7.9 cm,+2,5%) e 6 cm em Valdivia (6.6 cm,-9%). Resultados das análises maximização de lucros, de acordo com densidades de semeadura foram determinadas, como um exemplo, em Tornagaleones com 98 toneladas de sementes foi obtida uma produção total de 1667 toneladas TFW com um lucro de 8.237 k €.
Os resultados da avaliação da eutrofização potencial da cultura para os quatro locais, mostram que a qualidade da água está em bom estado, salvo em Tornagaleones onde é moderado. O balanço de massas de azoto para cada fazenda de cultivo foi também determinada. Os resultados mostram que a qualidade da água seja mantido ou melhorado em condições normais de cultura prática. Esses resultados destacam o papel que desempenha na extracção aquicultura organica na gestão integrada da zona costeira e emissões nutrientes.
A integração da FARM e abordagem AM-SIG para a selecção de sites a aquicultura, apoia e assiste à gestores de água costeiras no processo decisório. O SIG-based IASA índice integra diferentes critérios e implica estimativas de capacidade de carga, a eutrofização e ótimo lucro dentro de um sistema. Os resultados identificam os sítios mais adequados para uma gestão sustentável de aquicultura de ostra du Pacífico dentro do estuário Valdivia.
Palavras - chave: FARM, SIG, ASSETS, FA/PCA, AM, IASA, escala-local, aquicultura, ostra du Pacifico, eutrofização, estuário.
ABSTRACT
An integrated approach of the Farm Aquaculture Resource Management (FARM) model and Geographical Information System (GIS) has been applied to Pacific oyster aquaculture in suspended longline systems. The performance of the FARM model, applied to simulate potential production, economical data, and water quality impacts at the farm-scale, was tested in four potential sites (Tornagaleones, Valdivia, bay of Corral and Ensenada San Juan) in the Valdivia estuary of Chile. The FARM model results were integrated in a spatially variable Suitability Index of Sustainable Aquaculture (SISA) through a GIS Multicriteria Evaluation (MCE) technique.
To describe the environmental variability of the Valdivia estuary, significant relationships between the environmental variables were estimated applying multivariate statistical analysis, such as Factor Analysis and Principal Component Analysis.
Seasonal data were used as drivers for the FARM model. Modelling results show good agreement with reported individual total length at two farm sites during a 395 days culture period: simulated length of 8.1 cm of Pacific oyster in Tornagaleones (7.9 cm, +2.5%) and 6 cm in Valdivia (6.6 cm, -9%). Results of a profit maximization analysis according to seeding densities were determined, as an example, in Tornagaleones with 98 tons of seed was obtained a total production of 1667 tons TFW with a profit of 8237 k€.
The eutrophication assessment results for the four potential farm sites show that water quality is at Good status, except in Tornagaleones where is Moderate. The nitrogen mass balance for each farm was also determined. The results show that water quality is either maintained or improved under standard conditions of culture practice. These results highlight the role that extractive organic aquaculture plays in integrated coastal zone and nutrient emissions management.
The integration of FARM and MCE GIS approach for aquaculture site selection supports and assists to water coastal managers in the decision making process. The GIS-based SISA index integrates different criteria and implies estimates of carrying capacity, eutrophication and optimal profit within a system. The results identify those aquaculture sites most suitable for a sustainable Pacific oyster management within the Valdivia estuary.
Keywords: FARM, GIS, ASSETS, FA/PCA, MCE, SISA, farm-scale, aquaculture, pacific oyster, eutrophication, estuary.
CONTENTS
1. INTRODUCTION 1
2. Site specific description, Chilean shellfish aquaculture and management background
3
2.1. Valdivia estuary 3
2.2. Pacific oyster culture in Chile 7
2.3. Modelling for a sustainable shellfish aquaculture 10
3. METHODOLOGY 12
3.1. Study area 12
3.2. Field databa 12
3.3. Environmental variability of the Valdivia estuary 13
3.4. FARM model application 14
3.5. Role of the shellfish farms in the eutrophication control and emission trading 17
3.6. Mapping and suitability analysis using GIS 18
4. RESULTS 19
4.1. Environmental variability of the Valdivia estuary 19
4.1.1. Relationship between environmental variables 19
4.1.2. Spatio-temporal environmental variability 24
4.2.1. Farm layout 25
4.2.2. Optimal site selection and FARM validation 26
4.2.3. Determination of optimal culture densities and profit maximization 29
4.2.4. Shellfish aquaculture and coastal eutrophication 31
4.3. Suitability analysis of FARM results using GIS 34
5. DISCUSSION 41
1. INTRODUCTION
AQUACULTURE IN CHILE
Aquaculture, the most rapidly growing sector of the global agricultural economy, is expected to dominate world fish production by the year 2030 (Brugere and Ridler, 2004). Chile is a world leader in aquaculture production: second in farmed salmon, first in Gracilaria algae and fourth in mussels (FISHSTAT, 2008). Shellfish aquaculture in Chile has experienced strong growth over the last two decades and is one of the most promising industries, now based mainly on the production of Chilean mussel (Mytilus chilensis), northern scallop (Argopecten purpuratus), and on a smaller scale on Pacific
oyster (Crassostrea gigas), ribbed mussel (Aulacomya atra), giant mussel (Choromytilus chorus), Chilean oyster (Tiostrea chilensis), red abalone (Haliotis rufescens) and Japanese abalone (Haliotis Discus hannai) (SERNAPESCA, 1987
-2007).
Despite, this strong growth in the aquaculture industry in general and shellfish culture in particular, there are still significant environmental, biological and management issues that must be addressed in this economic activity to develop at a sustainable level. Negative environmental impacts in coastal areas may be quite severe, for example eutrophication, harmful algal blooms and fish kills. In 2001 the Chilean Government recognized the need to address the sustainability of this industry with the promulgation of the Environmental Regulations for Aquaculture, which set clear requirements for the environmentally sustainable development of the activity, allowing prevention, mitigation and remediation of associated impacts (SUBPESCA, 2001). The National Aquaculture Policy (NAP) enacted in 2003, also recognized the social and economic importance of aquaculture and the need to develop the activity to promote the highest
possible level of economic growth over time, within a framework of environmental sustainability and equity in access to the activity (SUBPESCA, 2003).
CARRYING CAPACITY IN AQUACULTURE
There remains a need to develop an understanding and predictive capability in coastal ecosystems where aquaculture is practised. To respond and manage the challenges for the aquaculture development in an environmentally sustainable framework, the research community is responsible for developing scientifically based diagnostic (indicators of pressures, states, impacts) and prognostic (predictive models and GIS) tools to support decision-making in both the public and private management of aquatic resources (Ferreira et al., 2007a; Tett, 2007). Quantitative assessment of sustainable shellfish culture using predictive models is conditioned by different definitions of carrying capacity: physical, production, ecological and social (Inglis et al., 2000, McKindsey et al., 2006). Shellfish models are divided in system scale (bay, estuary, etc) and local
scale (farm). At the local scale the shellfish models include those of Chamberlain (2002), Bacher et al. (2003), Weise et al. (2006), Ferreira et al. (2007a) and Grant et al. (2007). One of the most innovative tools is the FARM model which is an integration of biological, production and economic functions with ASSETS, allowing eutrophication assessment (Ferreira et al., 2007a). The FARM model was applied for determining optimal clam sites, culture densities, profit maximization, eutrophication status and nutrient emissions trading and valuation (Ferreira et al., 2009).
This work presents an application of FARM modelling and GIS approach for the analysis of farm-scale aquaculture of Pacific oyster (Crassostrea gigas) in the Valdivia estuary of Chile. The main objectives of this work are:
1) To describe the environment variability in the Valdivia estuary;
2) To determine the carrying capacity and production of four shellfish farms located in different areas of the estuary using the FARM model;
3) To assess the role of the shellfish farms in the eutrophication control and emission trading using the FARM model;
4) Mapping and suitability analysis of the FARM model results using a Geographical Information System (GIS).
2. Site specific description, Chilean shellfish aquaculture and management background
2.1. Valdivia estuary
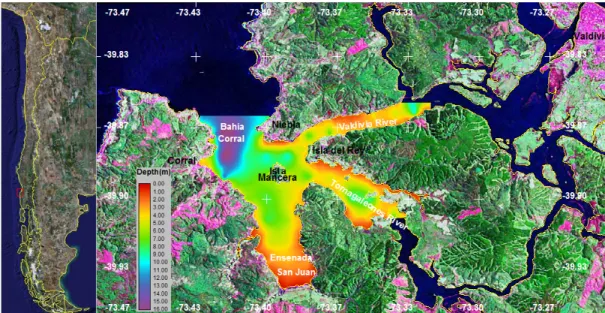
The Valdivia estuary (39 ° 50'S, 73 ° 20'W) is located in southern Chile and includes the Valdivia and Tornagaleones rivers, Ensenada San Juan and the bay of Corral (Fig. 1).
Figure 1. Landsat ETM satellite image of the Valdivia estuary and superimposed bathymetry map of the study area.
The Valdivia estuary has been classified as:
a) Structural-Primary (Perillo, 1995; Pino et al., 1994) from a morphogenetic point of view.
b) Micro-tidal because the tide range not exceed 2 m (Arcos et al., 2002).
c) Hypo-synchronous, where friction exceeds the convergence effect, the tidal range decreases through the estuary, has narrow mouth and the water entering the estuary is completely dispersed into it (Dyer, 1997 ).
d) Partially mixed in relation to its saline structure (Arcos & Salamanca, 1989; Pino et al., 1994; Arcos et al., 2002), although in some areas the estuary has salt marsh
characteristics (Pino et al., 1994).
The climate of the area is temperate rainforest with Mediterranean influence (DMC, 2008), with annual precipitations of about 2200 mm in Valdivia city. The tidal regime in the mouth of the estuary (bay of Corral) is semi-diurnal, with an average range of 0.8 m, ranging between 1.48 and 0.53 m (Pino et al., 1994). However, this tidal range is reduced towards the head of the estuary due to the large number of interconnected canals and islands (Pino et al., 1994). Tides are the main source of energy to the circulation of estuarine system, affecting the whole water column (Arcos et al., 2002).
The Valdivia estuary covers an area of 15 km, though the tidal reaches 42 km upstream, and the average width of the system is 700 m (Pino et al., 1994). The flow of the estuary reaches 1000 m3 s-1 and is an open estuary without a bar mouth (Arcos et al., 2002). The
general topography is rugged with steep slopes from the hills (up to 900 m above sea level) to the coastline; this can be seen in the Landsat ETM satellite image (Fig. 1), on which is overlaid the bathymetry map using IDRISI Andes GIS (Clark Labs,
Massachusetts, USA). The land use has a high degree of variability and is composed of native forest (26%), wetlands (20%), forest plantations (16%), grasslands (17%), shrub lands (12%), cities of Valdivia, Corral and Niebla (8%) and 1% of agricultural land (Arcos et al., 2002).
The bathymetry of Tornagaleones river has depths between 3 and 5 m in the area of Isla del Rey, although some sectors have values close to 10 m (Fig. 1). In the south part of Ensenada San Juan the depths are low (1 to 3 m) and increase gradually towards the bay of Corral, with a maximum of 8 m in the vicinity of Isla Mancera. In the bay of Corral, the depth varies between 5 and 16 m, while in the area of Valdivia river the values ranging from 3 and 5 m.
The Tornagaleones river combines hard (cancagua stone, flagstone rock and boulders) and soft (clay-silt) sediments (Poblete & Deppe, 1978; Möller et al., 2001; Arcos et al., 2002). Ensenada San Juan is a coastal plain and shallow waters with small slopes, soft sediments of mud and organic aggregates, as well as the remnants of submerged logs and low algal abundance (Arcos et al., 2002). The coastal zone of the bay of Corral has sandy beaches with sediments composed of gravel, shells, boulders and flagstone, and also with a large amount of macroalgae (Macrocystis pyrifera, Porphyra columbina, Ulva lactuca, Gracilaria sp.) (Poblete & Deppe, 1978; Möller et al., 2001; Arcos et al.,
2002). At the mouth of the Valdivia river, in the bay of Corral, sediments are composed of gravel, medium sand and very fine sand (Arcos et al., 2002).
There are few publications concerning the variability of hydrographical conditions and dynamics of the Valdivia estuary (Pino et al., 1994; Möller et al., 2001; Arcos et al., 2002; Rojas, 2003). These studies showed:
a) A strong thermal and saline stratification, which reduces significantly towards the mouth of the bay.
b) A clear east-west salinity gradient, reflecting greater influence of continental surface water toward the east and subsurface marine waters penetration to the west.
c) A significant influence of tidal fluctuations on net flows and distribution of hydrographic variables.
d) Presence of vortices and counter-currents due to physiographic and topographic effects. These characteristics are accentuated during winter due to the increased intrusion of surface water throughout the continental sector.
The phytoplankton of the Valdivia estuary is characterized by a high dominance of freshwater diatoms, while the distribution of marine diatoms is generally greater in the mouth of the estuary and decreases towards the head of the estuary (Arcos et al., 2002). The zooplankton in the estuary is characterized by dominance of copepods and nauplii, whose abundances are clearly influenced by the tidal cycles, with higher numbers during high tides (Arcos et al., 2002).
Before the devastating 1960 Valdivia earthquake, the most powerful ever recorded in the world, reaching magnitude 9.5 (USGS, 2006), the marshes and tidal flats were poorly developed. However, the sinking occurred during the event that generated large areas within the river basin, that remain inundated by shallow waters (Pino et al., 1994), reaching around 205 km2 in the Valdivia estuary (IREN, 1974 ). The organic seston (suspended particulate matter) of the estuary is mainly derived from the vegetation of flooded areas after 1960 earthquake; however, invertebrates of the estuary, from natural populations or aquaculture, also contribute to bottom sediments (Jaramillo et al., 1992). In a cross-section of the estuary, particulate organic matter (POM) concentrations
between 3 and 15 mg L-1 were found, while the values of particulate inorganic matter (PIM) ranged between 1 and 5 mg L-1 (Pino et al., 1994 ).
The contamination by organic compounds in the Valdivia estuary waters was found to be low Cisternas (2006). The concentrations of total petroleum hydrocarbons (TPH) in surface water, and low spatio-temporal variations in areas of Valdivia river, Tornagaleones river, Isla Mancera and the bay of Corral. However, Capillay (2006) conducted a study to assess bioavailability of TPH in the waters of the Valdivia estuary, detecting high levels of oil pollution in Chilean mussels (Mytilus chilensis). This bioaccumulation of pollutants is due to oil spills generated by shipping in the estuary. Concentrations of polycyclic aromatic hydrocarbons (PAHs) in sediments and its bioavailability in Chilean mussels (Mytilus chilensis) and giant mussel (Choromytilus chorus) were also evaluated for different areas of the Valdivia estuary, found that the
sites sampled had an average level of PAH pollution (Toro et al., 2003; Palma-Fleming et al., 2004).
With respect to the bioavailability of heavy metals (Cr, Cu, Mn, Fe, Pb and As), Velasquez (2005) found seasonal variability and low concentrations, except iron, in Chilean mussels (Mytilus chilensis) using flame atomic absorption spectrometry. Díaz (2007) assessed bioavailability of Al, Cr, Cu, Fe, Mn, Ni, Pb and Zn, found high concentrations of Al and Fe in the estuary using Diffusive Gradient Thin Gel (DGT) technique in water and sediment samples.
2.2. Pacific oyster culture in Chile
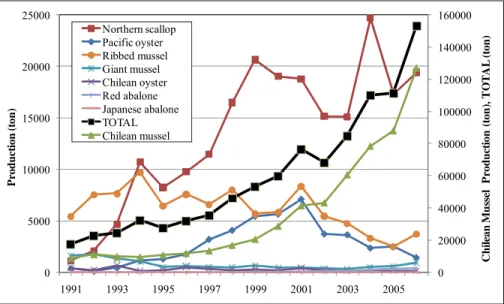
Shellfish aquaculture in Chile has experienced a major expansion in the last two decades, based mainly in the production of Chilean mussel (Mytilus chilensis), Northern scallop (Argopecten purpuratus), and on a smaller scale Pacific oyster (Crassostrea
gigas), ribbed mussel (Aulacomya atra), giant mussel (Choromytilus chorus), Chilean
oyster (Tiostrea chilensis), red abalone (Haliotis rufescens) and Japanese abalone (Haliotis Discus hannai) (Fig. 2).
Figure 2. Annual changes in Chilean shellfish aquaculture production from 1991 to 2006 (SERNAPESCA, 1991-2007).
C. gigas was introduced in Coquimbo (Fig. 3), northern Chile, in 1978 with the purpose
of seed production and to evaluate its adaptation to South Pacific waters (Möller et al., 2003). Although the oysters reach sexual maturity they can not reproduce in the natural environment (Munita, 1989).
Figure 3. Pacific oyster (Crassostrea gigas).
0 20000 40000 60000 80000 100000 120000 140000 160000 0 5000 10000 15000 20000 25000 1991 1993 1995 1997 1999 2001 2003 2005 C h il ea n M u ss el P ro d u ctio n (to n ), T O T A L (to n ) P ro d u ctio n (to n ) Northern scallop Pacific oyster Ribbed mussel Giant mussel Chilean oyster Red abalone Japanese abalone TOTAL Chilean mussel
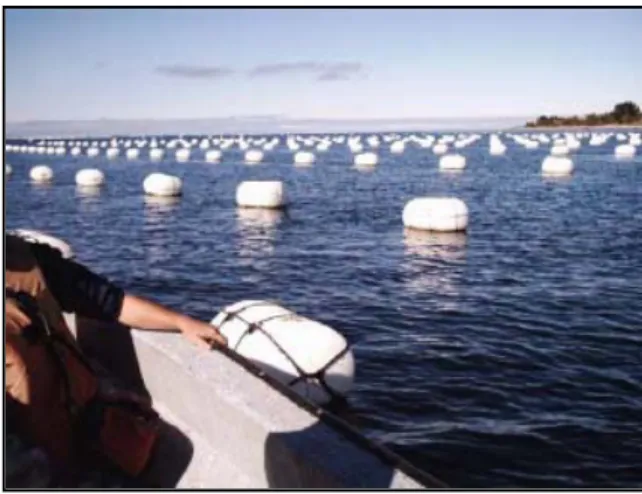
Pacific oyster culture takes place in coastal marine environments of northern and south of Chile; the latter being currently the most important in terms of harvest. The initial stage of the culture is the supply of hatchery-produced seed from Coquimbo, where the higher water temperatures make it feasible production. In the growth phase, longline systems are mainly used (Fig. 4). The minimum commercial size is 6.5 cm and the culture period varies between 12 and 18 months depending on the culture location. Exports of frozen and fresh-chilled products are mainly to Japan, Taiwan, China and Singapore. By the late 1980’s, Pacific oysters were being farmed in Chile, reaching the highest production in 2001 with 7000 ton. After 2001, the production fall off to 1443 ton in 2006, being at present the fourth species in terms of harvest (SERNAPESCA, 1991-2007). The drop in production is linked to: a decline in exports to China; demise of Japan as a market due to lack of water certification programs in Chile; producer reorientation towards the Chilean mussel aquaculture; undersized oysters, small than the minimum commercial sizes required by markets; and high freight costs compared to other oysters producers countries such as Australia, New Zeaand and Korea (AQUA, 2007).
Aquaculture in Chile is regulated since 1990 by the General Law on Fisheries and Aquaculture (MINECON, 1991). Since 1997, under the Act on Environment and the Rules of the Environmental Impact Assessment System, all aquaculture projects must undergo multi-sectoral environmental assessments prior to their execution. In 2001, the Environmental Regulation for Aquaculture was enacted, which set clear requirements for the environmentally sustainable development of the activity (SUBPESCA, 2001). Sanitary issues are incorporated in the Sanitary Regulations for Aquaculture, enacted in early 2002. Since 1989, the Sanitary Program for Molluscs certifies shellfish culture areas for the export of fresh and processed products to the United States, European Union and Singapore. The NAP approved in 2003 define the policies for a sustainable development of aquaculture in Chile (SUBPESCA, 2003).
2.3. Modelling for a sustainable shellfish aquaculture
Models and GIS are appropriate tools to assess the carrying capacity, as they predict variables of interest (e.g. oyster population, eutrophication, water quality, socio-economic profitability) for a range of production levels scenarios (McKindsey et al., 2006). Several models have been developed to assess the different types of carrying capacity (McKindsey et al., 2006). Models of assessing the carrying capacity may be categorized according to their spatial scale (Ferreira et al. 2007a), existing models at the ecosystem (bay, estuary) and local (fish farm) levels. Modelling of carrying capacity should include both the ecosystem and local scale (Ferreira et al., 2008). Models of carrying capacity in an ecosystem scale include those of Rodhouse & Roden (1987), Brown (1988), Carver & Mallet (1990), Raillard & Ménesguen (1994), Ferreira (1995), Grant (1996), Dowd (1997), Dame & Prins (1998), Ferreira et al. (1998), Gangnery et al. (2001), Nunes et al. (2003) and Dowd (2005). Models that address local-scale issues
include: FARM (Ferreira et al., 2007a), LONGLINES (Bacher et al., 2003), DEPOMOD (Cromey et al., 20002) and GEL (Grant et al., 2007).
The Farm Aquaculture Resource Management (FARM) model was developed by Ferreira et al. (2007a), for assessment of coastal and offshore shellfish aquaculture in a farm spatial scale (between 100 and 1000 meters length). The performance of the FARM model was good tested in five systems in the European Union (Ferreira et al., 2009). FARM is a Windows application directed to private and public managers, and has three main purposes: i) prospective analysis on sites and species selection; ii) ecological and economic optimization of culture; iii) environmental assessment of eutrophication effects. FARM applies a combination of physical and biogeochemical models, bivalve growth models and screening models. FARM integrates an adapted ASSETS (Assessment of Estuarine Trophic Status) screening model (Bricker et al., 2003), to assess the eutrophication effects of a shellfish farm. ASSETS use a combination of field data, models and expert knowledge to evaluate indicators of: pressure (influence factors), state (general eutrophic conditions) and response (future expected conditions). The methodology applied in FARM to evaluate de eutrophication with ASSETS is detailed in Ferreira et al., (2007a). ASSETS is a "Phase II" methodological approach or symptoms-based and multi-indicator, that has the advantage of considering system responses and pressures (Xiao et al., 2007). ASSETS model indicate that culture of filter-feeding bivalve in suspended longline systems, may have positive impacts by reducing primary symptoms of eutrophication (Newell, 2004) such as elevated chlorophyll a.
3. METHODOLOGY
3.1. Study area
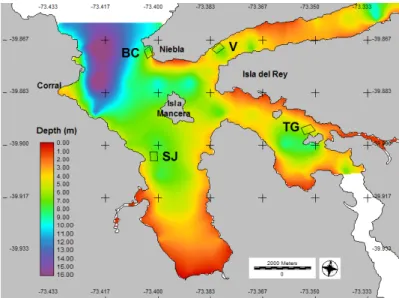
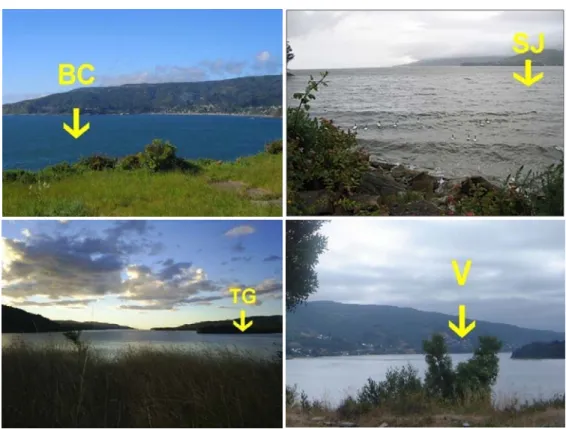
The study considered the information of four potential farm sites situated in the Valdivia estuary: bay of Corral (BC), Valdivia river (V), Tornagaleones river (TG) and Ensenada San Juan (SJ) (Fig. 5). The potential sites represent aquaculture concessions of 6 hectares (200 m wide by 300 m long), with the following average depths: 4.5 m (BC), 2.5 m (V), 3.2 m (TG) and 6.8 m (SJ).
Figure 5. Bathymetric image and potential farm sites: bay of Corral (BC), Valdivia river (V), Tornagaleones river (TG) and Ensenada San Juan (SJ).
3.2. Field data
Data collected from seasonal research cruises, carried out during 2000 and 2001 in the Valdivia estuary, by the Fisheries Research Institute (INPESCA) under the project FIP Nº 2000-29 (Arcos et al. 2002) were used in the study. Data are seasonal (summer, autumn, winter and spring) and consider only the sampling stations whose geographical position coincides or are close to the potential farm sites shown in Figure 5. The data contain 80 records of physical, chemical and biological characteristics of the Valdivia
estuary waters, and include site sampling, season and 21 environmental variables shown in Table 1.
Table 1. Physical, chemical and biological data of the Valdivia estuary.
Sampling site
(SITE) (SEASON) Season Grain size (GS) Temperature (T) Salinity (S)
Density (D) Ammonium
(NH4+)
Nitrate (NO3-) Nitrite (NO2-) Organic nitrogen
(Norg) Total nitrogen (NT) Dissolved inorganic nitrogen (DIN)
Phosphate (PO43-) Total phosphorus
(P)
Total phytoplankton
(PHYTO) Chlorophyll a
(Chla) Total particulate matter (TPM) Particulate organic matter (POM) inorganic matter Particulate
(PIM) Dissolved oxygen (DO) Currents speed Spring tide (CorrS) Currents speed
neap tide (CorrN) Shannon diversity index (SDI)
3.3. Environmental variability of the Valdivia estuary
Significant relationships between the variables were tested applying multivariate statistical analysis, such as Factor Analysis (FA) and Principal Component Analysis (PCA) using the statistical software SPSS 15 (Nie et al., 1975). The FA/PCA is an ordination technique that creates linear combinations of variables to construct uncorrelated vectors (PCs) that describe the dominant patterns of variance in the data (Giraudel & Lek. 2001). This method is effective for identifying which variables explain the most variance, and therefore, contain the most information, especially for data sets with a large number of variables (Singh et al., 2005, Li et al., 2007). In this study, the seasonal average data of environmental variables by sampling site was used for FA/PCA. The Scree plot method was used to identify the number of PCs to be retained to understand the underlying data structure (Vega et al., 1998; Li et al., 2007). In the PCA, the criteria for considering a variable associated with a particular factor was defined as those that have loads of 0.66 or higher, this is a strong loading. This analysis
may improve the understanding of the factors that control the environment seasonal processes of the Valdivia estuary.
The seasonal average data by sampling site was employed for seasonal plots to obtain central tendency and variability of the data. The integrated analysis of FA/PCA and seasonal plots, has allowed the environmental characterization of the study area.
3.4. FARM model application
The FARM model (Ferreira et al., 2007) was applied to determine the appropriate Pacific oyster (Crassotrea gigas) density for optimal carrying capacity (the greatest sustainable yield of market-sized animals within a given time period), in the four potential farm sites (BC, V, TG and SJ) evaluated in the Valdivia estuary (Figs. 5 and 6).
Figure 6. Study area photos: a) bay of Corral, b) Ensenada San Juan, c) Tornagaleones and d) Valdivia rivers.
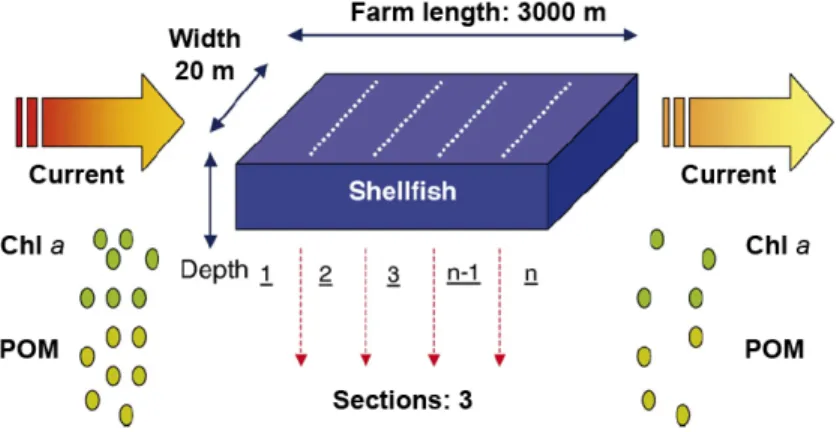
With FARM, the yields were calculated for each study site based on food availability, farm dimensions or aquaculture concession and environmental parameters (Fig. 7).
Figure 7. FARM layout applied to suspended longlines system for Pacific oyster culture in the Valdivia estuary (Ferreira et al., 2007a).
The depth (m) of each farm site was estimated applying the following processes:
i) Import to GIS the bathymetric data of the study area.
ii) Generation of interpolated image using the geostatistics functions of modelling and spatial analysis of GSTAT package (Pebesma, 2004) available in IDRISI Andes GIS.
iii) Extract the average depth site value through graphical overlay processes between bathymetric image and polygon vectors of farm sites.
The FARM model runs on Windows operating system software with a simple interface. More detailed specification of this software is detailed in Chapter 2.3.
In a semi-diurnal tide regime, it was considered the same current speed magnitudes (0.36 m s-1 for Spring tide and 0.42 m s-1 for neap tide) for all potential farm sites. Model parameterization includes values for environmental conditions (T, S, CorrS, CorrN, Chla, POM, TPM, PIM and DO), farm dimensions (width, length, depth,
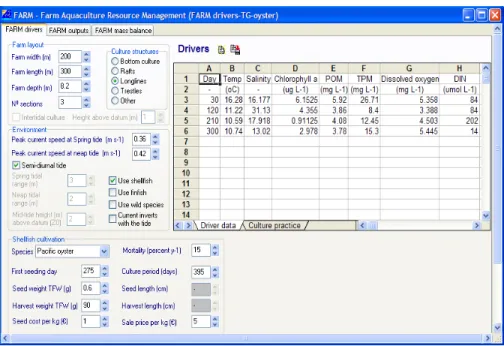
number of sections), cultivation practice (structures, first seeding day, period, seed length and seeding densities) and economic conditions (seed cost and sale price in a market-size organism). Environmental values were loaded by season (summer, autumn, winter and spring) in Julian Day and for each potential farm site (Fig. 8). The total physical product (TPP) using a Cobb-Douglas production function and the individual total length for each farm site was simulated, and the appropriate Pacific oyster (Crassotrea gigas) density for optimal carrying capacity was determined using multiple simulations.
Figure 8. Example of input data used in FARM model application to Tornagaleones potential farm site.
The model calculates the average physical production (APP) after each FARM run using the equation (1):
(1)
x1 initial stocking density of seed, considered the only variable input
The points of profit maximization for the potential farm sites in the Valdivia estuary were determined using the equation (2):
(2)
where:
MPP marginal physical product, equal to the first-order derivative of the production function
Py output unit price, the sale price of market-sized of cultured C. gigas
Px input unit cost, the seed cost
No information was available about production of cultured Pacific oyster in the Valdivia estuary, in order to validate the FARM results. However, growth information of length (cm) for a 13 month period was available and validated for two sites (Tornagaleones and Valdivia rivers) of the estuary. The data were obtained during an culture introduction experiment of Pacific oyster (Möller et al., 2003).
3.5. Role of shellfish farms in the eutrophication control and emission trading
The FARM model was applied to assess farm related eutrophication effects of Pacific oyster culture in the four potential farm sites (BC, V, and TG SJ) of the Valdivia estuary. FARM integrates an adapted form of ASSETS (Bricker et al., 2003), to evaluate the eutrophication effects of a shellfish farm regarding Chla and DO concentrations (Ferreira et al., 2007a).
A standard decision matrix Overall Eutrophication Condition (OEC) (Bricker et al., 2003), was applied to derive the final classification grade (high, good, moderate, poor and bad) of the State of the system for each potential farm site.
3.6. Mapping and suitability analysis using GIS
The mapping generation and suitability analysis approach was based on the application of IDRISI Andes GIS and included the following steps:
i) Generation of a base image or raster layer of the study area using GIS functions. The metadata of the base image were defined: file format, file type, columns, rows, reference system, reference units, minimum x coordinate, maximum x, minimum y and maximum y.
ii) Generation of all the vector layers in GIS: coast mask, coastline, cities, farm aquaculture sites, rivers, areas names, gridlines of lat-long, north arrow, scale bar. iii) Import the FARM modelling results of potential aquaculture sites to GIS and generation of maps through a graphical overlay processes available on the GIS. The FARM results mapped was: individual total length, total physical production in a standard or normal seed density (TPPstd), total physical production in a optimal seed
density (TPPopt), economic profit in a optimal seed density (Popt) and ASSETS
grades.
iv) Visual analysis for description of spatial images.
v) Suitability analysis for decision support. Integration of FARM results in a spatially variable Suitability Index of Sustainable Aquaculture (SISA) through a Multicriteria Evaluation (MCE) technique known as the weighted linear combination (Malczewski, 2000). The MCE was used to combine the six factors: total length, TPPstd, TPPopt, SDopt, Popt and ASSETS grade. Combining selected data set using
MCE requires that each factor be transformed to comparable and consistent units. Fuzzy Set Membership Functions (FSMF) can be defined for each variable which convert de original data to standardised aquaculture suitability scores (Arnold et al., 2000; Vincenzi et al., 2006). Suitability scores are defined on an arbitrary between 0 and 1, where 0 defines a non-suitable area, and 1, the most suitable. In this work, the FSMF type for each variable are linear with a monotonically increasing shape with control points equal to minimum and maximum values of farm sites. The SISA is calculated by multiplying the weight assigned for each criterion, and adding the product over all the parameters as follows equation (3):
∑ (3)
where wj is a normalized weight, such that Σwj = 1, and rij is the spatially variable factor
modified by its Fuzzy Set Member Function into suitability values. The weights represent the relative importance of the factors. SISA(xi) is bounded between 0 and 1.
4. RESULTS
4.1. Environmental variability of the Valdivia estuary
4.1.1. Relationship between environmental variables
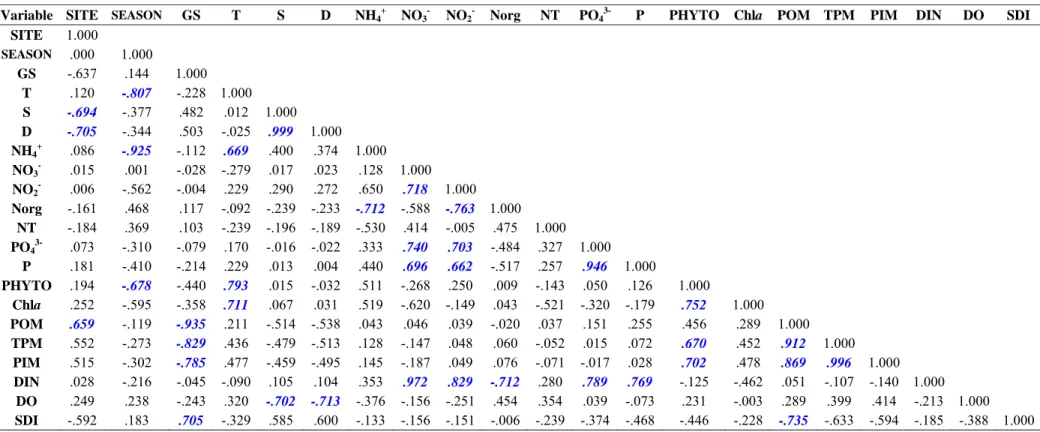
Pattern recognition of correlations among the 21 variables was best summarized by the FA/PCA. When a significant correlation was searched for (at P = 0.05 level), many strong and positive correlations were revealed between the following variables (Table 2): T, S, NO3-, NO2-, PO43-, P, PHYTO and Chla (r = 0.651 to 0.999). There were also
some negative correlations between some variables such as SEASON, T, NH4+ and
PHYTO (r = -0.670 to -0.935), which indicate a strong seasonality of these variables. The SITE was strongly and negatively associated with S, indicating that each area of
study had different saline properties. Strong negative correlations were estimated also to the following variables: GS, POM, TPM, PIM and SDI. Correlation coefficients of two elements were useful, because they numerically represented the similarity between the elements of the two environmental variables.
Table 2. Correlation matrix for environmental variables, site sampling and season in the Valdivia estuary.
Variable SITE SEASON GS T S D NH4+ NO3- NO2- Norg NT PO43- P PHYTO Chla POM TPM PIM DIN DO SDI
SITE 1.000 SEASON .000 1.000 GS -.637 .144 1.000 T .120 -.807 -.228 1.000 S -.694 -.377 .482 .012 1.000 D -.705 -.344 .503 -.025 .999 1.000 NH4 + .086 -.925 -.112 .669 .400 .374 1.000 NO3 - .015 .001 -.028 -.279 .017 .023 .128 1.000 NO2- .006 -.562 -.004 .229 .290 .272 .650 .718 1.000 Norg -.161 .468 .117 -.092 -.239 -.233 -.712 -.588 -.763 1.000 NT -.184 .369 .103 -.239 -.196 -.189 -.530 .414 -.005 .475 1.000 PO43- .073 -.310 -.079 .170 -.016 -.022 .333 .740 .703 -.484 .327 1.000 P .181 -.410 -.214 .229 .013 .004 .440 .696 .662 -.517 .257 .946 1.000 PHYTO .194 -.678 -.440 .793 .015 -.032 .511 -.268 .250 .009 -.143 .050 .126 1.000 Chla .252 -.595 -.358 .711 .067 .031 .519 -.620 -.149 .043 -.521 -.320 -.179 .752 1.000 POM .659 -.119 -.935 .211 -.514 -.538 .043 .046 .039 -.020 .037 .151 .255 .456 .289 1.000 TPM .552 -.273 -.829 .436 -.479 -.513 .128 -.147 .048 .060 -.052 .015 .072 .670 .452 .912 1.000 PIM .515 -.302 -.785 .477 -.459 -.495 .145 -.187 .049 .076 -.071 -.017 .028 .702 .478 .869 .996 1.000 DIN .028 -.216 -.045 -.090 .105 .104 .353 .972 .829 -.712 .280 .789 .769 -.125 -.462 .051 -.107 -.140 1.000 DO .249 .238 -.243 .320 -.702 -.713 -.376 -.156 -.251 .454 .354 .039 -.073 .231 -.003 .289 .399 .414 -.213 1.000 SDI -.592 .183 .705 -.329 .585 .600 -.133 -.156 -.151 -.006 -.239 -.374 -.468 -.446 -.228 -.735 -.633 -.594 -.185 -.388 1.000
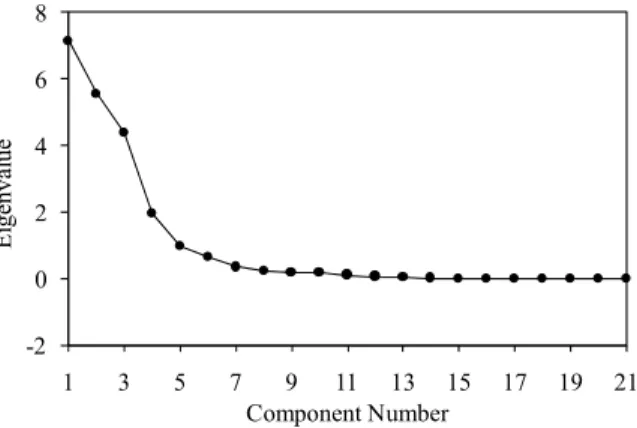
The Scree plot (Fig. 9) was used to identify the number of PCs and four components with eigenvalues > 1 were retained and interpreted each principal component based on its correlations with original variables (factor loading).
Figure 9. Scree plot of the characteristic roots (eigenvalues) of principal component analysis.
PCA by the unrotated mode and PCA by Varimax with Kaiser rotation were both performed in the present work. In Table 3, only the strong factor loadings for the unrotated PCA with loads greater than 0.66 are shown, because they could better interpret the environmental variability and pollution sources.
Four PCs or latent factors were retained, which explained 86.81% of the total variance of the system in the environmental data set (Table 3). The PC1, accounting for 32.56% of the total variance, included the variables SITE, GS, S, D, POM, TPM, PIM and SDI with a strong loading factor. This latent factor was composed of the effects in the study sites of different water bodies (or saline areas) and the type of sediment over the content of organic and inorganic matter and diversity of species. Low salinity areas of (riverine areas of the estuary) contain higher levels of organic (from rivers and high in situ productivity) and inorganic particulate matter and less diversity of aquatic species. The second PC describing 25.37% of the total variance, was mainly correlated with NO3-,
NO2-, PO43-, P and DIN, and was regarded as representing influence of nutrient loads to
-2 0 2 4 6 8 1 3 5 7 9 11 13 15 17 19 21 E ige nva lu e Component Number
the estuary from anthropogenic activities as agricultural, aquaculture, industrial and residential in cities and farms. The source of nitrites and nitrates could be primarily industrial, while the phosphorus compounds generally come from urban waste, phosphates and polyphosphates that are in the formulation of detergents. These nitrogen and phosphorus compounds could appear in water as diffuse contamination from agricultural and livestock activities. The CP3, accounting for 19.97% of the total variance included the variables T, PHYTO and Chla. This latent factor was composed of SEASONAL factor that influences the bio-physical processes of the estuary, where in the summer months were recorded the highest values of T, PHYTO and Chla, and then decrease in autumn and winter and tend to increase in the spring. Finally, the PC4 explains 8.91% of the total variance included the variables Norg, NT and DO with a strong loading factor. The PC was composed of the nutrients enrichment of the system during autumn which reduces the DO, and the increased presence of phytoplankton in the spring which increases the values of Norg.
Table 3. Loadings of 21 environmental variables on significant principal components (PCs) for 4 study sites in the Valdivia estuary.
Variable PC1 PC2 PC3 PC4 SITE .858 SEASON -.828 GS -.864 T .915 S -.812 D -.825 DO .694 NH4+ NO3- .917 NO2 - .849 DIN .963 Norg .707 NT .859 POM .883 TPM .798 PIM .759 PO43- .914 P .892 Chla .745 PHYTO .912 -.740
4.1.2. Spatio-temporal environmental variability
Figure 10. Seasonal variability of major environmental variables highly correlated with four significant principal components for each study site.
Although the study sites (BC, V, TG & SJ) of the Valdivia estuary are connected together, a spatio-temporal variability was presented in the environmental conditions. In the inner estuary sites of V and TG, a greater influence of fluvial origin waters (Valdivia and Tornagaleones rivers) and a lower prevalence of saline oceanic water were observed. In these inner sites lower salinity values were registered which vary depending on the season (Fig. 10). In general, these two sites (V and TG) had water
bodies with lower salinities that were associated to: different types of sediment (very fine, fine, medium and coarse grains), higher concentrations of organic matter, chlorophyll and phytoplankton, lower diversity of aquatic species; higher temperature, phosphate, total phosphorus and DO.
Higher salinity values were observed in the bay of Corral, mouth of the Valdivia estuary, mainly associated to the high influence of marine oceanic waters and to a lesser extent on freshwater ecosystems (Fig. 10). This coastal zone were characterized by higher salinities and fine and very fine grained sediments, was associated with lower values of POM, T, Chla, PHYTO and DO, and with a greater diversity of aquatic species.
Intermediate values of salinity were observed in Ensenada San Juan, with a greater influence of marine water and also a higher influence of fresh river waters (Fig. 10). This area is characterized mainly by very fine and mud sediment, low levels of particulate organic matter and higher levels of biodiversity of aquatic species.
4.2. FARM model
4.2.1. Farm layout
The farm layout, to which the FARM model was applied for each potential farm site, was equivalent to 6 hectares (200 m * 300 m), where the depths by site were estimated applying GIS tools (Fig. 11). For each farm site the model was run for Pacific oyster culture, using longlines and for a farming period of 395 days using a seeding density of 100 ind m-2.
Figure 11. Description of the aquaculture sites in the Valdivia estuary where the FARM model was applied.
4.2.2. Optimal site selection and FARM validation
The aquaculture potential for 4 sites was evaluated with FARM, considering the farm layout and input data under a scenario of current conditions of production and operation in Chile. According to data from current production of C. gigas in Chile, a standard seed density (SDstd) of 100 ind m-2, a mortality rate of 35%, a cultivation period of 13
months (395 days) with the first seeding Julian day of 275 (October 1), seed length of 1.5 mm and a commercial size larger than 6.5 cm were considered.
The total physical product (TPP) and the individual total length of C. gigas were simulated by potential farm site and for a cultivation period of 13 months. Figure 12 displays the simulation results that were obtained for the potential sites and to one longline section. A high variability was observed among the carrying capacity of the sites, reaching the highest values in Tornagaleones where individuals of 8.1 cm, TPP of 156 tons TFW and APP of 130 tons TFW were obtained after a cultivation period of 13
months. In Valdivia site a TPP of 88 tons TFW with an APP of 73.3 tons TFW and a total length of 6.0 cm was predicted, while the bay of Corral reached a production equivalent to 76 ton TFW of individuals and APP of 63.3 tons TFW with final length of 5.9 cm. Finally, on Ensenada San Juan were simulated lower levels of production and growth, with TPP of 3.8 ton TFW, APP of 3.2 tons TFWand an individual total length of 3.7 cm.
Figure 12. Total physical product and individual total length of Pacific oyster simulated with FARM model for each potential farm site and during a 13 months
culture period.
The growth of Pacific oyster simulated by FARM model in Tornagaleones and Valdivia farm sites was validated with a total length data set measured monthly during the 2000-2001 season at the study sites and published in Möller et al. (2003). Figure 13 (a and b) displays the monthly total length of Pacific oyster observed by Möller et al. (2003), and the total length estimated by the FARM model for a cultivation period of 13 months (with seeding in October) in Tornagaleones farm site. When the monthly total length
0 1 2 3 4 5 6 7 8 9 0 20 40 60 80 100 120 140 160 180
01-Oct 01-Ene 01-Abr 01-Jul 01-Oct
L engt h ( cm ) T P P ( Tons T F W ) Tornagaleones TPP Length 0 1 2 3 4 5 6 7 8 9 0 20 40 60 80 100 120 140 160 180
01-Oct 01-Ene 01-Abr 01-Jul 01-Oct
L engt h ( cm ) TP P ( To ns T F W ) Valdivia 0 1 2 3 4 5 6 7 8 9 0 20 40 60 80 100 120 140 160 180
01-Oct 01-Ene 01-Abr 01-Jul 01-Oct
L engt h ( cm ) T P P ( Tons T F W ) Bahía Corral 0 1 2 3 4 5 6 7 8 9 0 20 40 60 80 100 120 140 160 180
01-Oct 01-Ene 01-Abr 01-Jul 01-Oct
L engt h ( cm ) T P P ( Tons T F W )
observed by Möller et al. (2003) with that simulated by FARM was correlated, a Pearson correlation coefficient r = 0.95 (R2 = 0.91) was calculated, indicating that the model successfully predicted the growth of Pacific oyster in this site. The FARM simulations obtained a final length of 8.1 cm after 13 months, while the observed was 7.9 cm.
Figure 13. a) Monthly total length of Pacific oyster observed by Möller et al. (2003) and estimated by FARM model in Tornagaleones site; b) scatter plot of observed versus estimated monthly total length (R2= 0.91, N=13); c) Monthly total length of
Pacific oyster observed by Möller et al. (2003) and estimated by FARM model in Valdivia site; d) scatter plot of observed versus estimated monthly total length
(R2= 0.80, N=13). 0 1 2 3 4 5 6 7 8 9
01-Oct 01-Dic 01-Feb 01-Abr 01-Jun 01-Ago 01-Oct
L engt h ( cm ) Tornagaleones FARM Model Möller et al 2003 a) y = 0.9319x R² = 0.91 0 1 2 3 4 5 6 7 8 9 0 1 2 3 4 5 6 7 8 9 S im ul at ed P aci fi c O yst er L t ( cm )
Observed Pacific Oyster Lt (cm) b) 0 1 2 3 4 5 6 7
01-Oct 01-Dic 01-Feb 01-Abr 01-Jun 01-Ago 01-Oct
L engt h ( cm ) Valdivia c) y = 0.7475x R² = 0.80 0 1 2 3 4 5 6 7 0 1 2 3 4 5 6 7 S im ul at ed P aci fi c O ys ter L t ( cm )
Observed Pacific Oyster Lt (cm) d)
The growth of Pacific oyster simulated by FARM on Valdivia potential farm site was also validated with the observed data by Möller et al. (2003) (Fig. 13c and d). When the observed total length with the simulated total length by FARM was related for a cultivation period of 13 months, a Pearson correlation coefficient r = 0.89 (R2 = 0.80) was calculated.
No information is available about the aquaculture production of C. gigas in the study area in order to validate FARM harvest simulations. However, at present the oyster farms of southern Chile for a seeding density of 100 ind m-2 obtained final yields of 70
to 100 ton TFW ha-1, and the maximum potential productivity is between 150-200 ton
TFW ha-1 (Fishing Partners, 2005). According to the results of production estimated by
FARM model, Tornagaleones was reached a production of 78 tons TFW ha-1 thus
would be within levels of present production of aquaculture farms dedicated to the cultivation of Pacific oyster in southern Chile.
4.2.3. Determination of optimal culture densities and profit maximization
An economic analysis that included the determination of optimal seed densities (SDopt)
and profit maximization of the potential farm site was performed. To obtain a production function by farm, the TPP was simulated with FARM over a variable range of seeding effort depending on the site. An analysis of the interactions of the resulting TPP, APP and MPP is shown in Figure 14. There is a stage where the farmer should consider increasing the seeding density, this region of profits maximization is maintained until the MPP = 0, from this point the TPP decreases despite increased seed input which is undesirable on a financial and resources conservation basis.
The points of profit and production maximization was determined for a MPP of 0.2, considering an input price Py of 5 € kg-1 and an output price Px of 1 € kg-1. Optimum
levels of seed density SDopt, TPPopt and profit (Popt) simulated with FARM for the farms
sites were shown in Figure 14 and Table 4.
Figure 14. Economical analysis for Valdivia estuary aquaculture sites using FARM model. Simulations carried out with C. gigas for a cultivation period of 395 days.
Table 4. Synthesis of the FARM economic analysis for the profit maximization scenario in each culture site.
Tornagaleones Valdivia Bay of Corral San Juan
SDopt (ton TFW) 98 342 187 18
TPPopt (ton TFW) 1667 1568 1302 18
Popt (k €) 8237 7497 6321 74
The maximum biological production (TPPbio) occur when MPP=0, and corresponds to a
seed input by potential farm site of 103 ton (TG), 396 ton (V), 216 ton (BC) and 27 ton (SJ). -20 0 20 40 60 80 100 120 0 200 400 600 800 1000 1200 1400 1600 1800 0 20 40 60 80 100 A P P a nd M P P TP P ( to n s TF W ) Seed (tons TFW) Tornagaleones TPP APP MPP MPP = 0.2 Seed = 98 ton -5 0 5 10 15 20 25 30 35 0 200 400 600 800 1000 1200 1400 1600 1800 0 100 200 300 400 A P P a nd M P P TP P ( to n s TF W ) Seed (tons TFW) Valdivia TPP APP MPP MPP = 0.2 Seed = 342 ton -10 0 10 20 30 40 50 60 0 200 400 600 800 1000 1200 1400 0 60 120 180 240 A P P a nd M P P TPP ( to n s TFW ) Seed (tons TFW) Bahía Corral TPP APP MPP MPP = 0.2 Seed = 187 ton -0.5 0 0.5 1 1.5 2 2.5 3 3.5 0 2 4 6 8 10 12 14 16 18 20 0 10 20 30 AP P a n d M P P TPP ( to n s T F W ) Seed (tons TFW) San Juan TPP APP MPP MPP = 0.2 Seed = 18 ton
4.2.4. Shellfish aquaculture and coastal eutrophication
The FARM model was applied to assess farm related eutrophication effects (regarding Chla and DO concentrations) of Pacific oyster cultures in the four potential farm sites. Results for the eutrophication assessment by farm site are shown in Figure 15.
At standard or normal seeding densities (100 ind m-2), the oysters would be responsible for net nitrogen removals (NNT) and sewage discharge of population equivalents per year (PEQ y-1) by site are shown in Figure 15 and Table 5.
Table 5. Mass balance and assessment of nutrient emissions trading in the four farm sites of the Valdivia estuary using FARM
Tornagaleones Valdivia Bay of Corral San Juan
Phytoplankton removal (kgC y-1) 488007 338963 429371 250217 Detritus removal (kgC y-1) 656243 442798 221061 -56326 N rem oval (kg y-1 ) Phytoplankton -75912 -52728 -66791 -38923 Detritus -102082 -68880 -34387 +8762 Excretion +7134 +3260 +3773 +2335 Faeces +94708 +68522 +33577 +666 Mass balance -76153 -49826 -63828 -27159 Population equivalents (PEQ y-1) 23077 15099 19342 8230 In come (k€ y-1) Shellfish farming 1688.6 837.8 772.0 38.2 Nitrogen removal 6923.0 4529.6 5802.6 2469.0 Total 8611.5 5367.4 6574.5 2507.2
For each farm site the final ASSETS classification was estimated, in relation to the concentration of chlorophyll a and dissolved oxygen out of the system, resulting in an
overall score of moderate in Tornagaleones and good in Valdivia, bay of Corral and Ensenada San Juan (Fig. 15).
ASSETS grade:
Figure 15. FARM results for the potential farm site of the Valdivia estuary using the ASSETS model for eutrophication assessment.
ASSETS grade:
4.3. Suitability analysis of FARM results using GIS
With the simulations results carried out with FARM for Pacific oyster cultivation in the farm potential sites, maps were generated applying GIS tools. The FARM results by farm potential site summarized in Table 6.
Table 6. Values and Fuzzy Set Membership Functions (FSMF) of FARM simulation data sets used in the suitability analysis for P. oyster cultivation in the
potential aquaculture sites of Valdivia estuary.
FARM
variable Tornagaleones Valdivia
Bay of Corral
San
Juan Data value
FSMF value Total length (cm) 8.1 6 5.95 3.71 3.71 min 8.1 max 0-1 linear TPPstd (ton TFW) 347.6 94.7 167.1 8.3 8.3 min 347.6 max 0-1 linear TPPop (ton TFW) 1666.9 1567.9 1301.7 18.4 18.4 min 1666.9 max 0-1 linear SDopt (ind m-2) 2700 9500 5200 500 500 min 9500 max 0-1 linear Popt (k €) 8237 7497 6321 74.1 74.1 min 8237 max 0-1 linear ASSETS
grade Moderate 3 Good 2 Good 2 Good 2
1: High 2: Good 3: Moderate 4: Poor 5: Bad 1 0.75 0.5 0.25 0
Simulated images of total length, TPPstd, TPPopt, SDopt, Popt and ASSETS eutrophication
state by farm site were generated using GIS tools (Fig. 16). A standard seed density of 100 ind m-2 was used in the simulation of individual total length, TPPstd and the
ASSETS. Figure 16 displays the spatial variability of the variables simulated by farm site. In Tornagaleones, the highest levels of total length, TPPstd, TPPopt and Popt were
estimated. In Ensenada San Juan, the lowers values of total length, TPPstd, TPPopt, Dopt
and Popt were simulated.
Continue Figure 16.
MCE was used to combine the six factors (total length, TPPstd, TPPopt, SDopt, Popt and
ASSETS) and, hence, determine the integrative Suitability Index of Sustainable Aquaculture SISA. First, aquaculture suitability images for each factor were generated
using fuzzy logic (Table 6 and Fig. 17). Suitability scores range from 0 to 1 and are expressed in terms of probability of farm success.
Figure 17. Suitability or probabilities of farm success images of total length, TPPstd, TPPopt, SDopt, Popt y ASSETS.
Continue Figure 17.
MCE inputs were the aquaculture suitability images and the weights assigned to each factor. Similar weights of 0.166 or 16.6% were used to each factor. Figure 18 shows the final SISA image, which indicates the probabilities of culture success for each potential
farm site. The probability of culture success in Tornagaleones was 0.804, in Valdivia 0.749, in bay of Corral 0.663 and 0.211 in Ensenada San Juan.
Figure 18. Suitability index of sustainable aquaculture mapfarm sites and estimated using GIS MCE.
5. DISCUSSION
Relationships between environmental variables, site sampling and season of the Valdivia estuary, were studied using FA/PCA multivariate statistical analysis. Factor loading were classified into “strong” corresponding to absolute loading values of more than 0.66, and considered the variables with the strong loading factors because of the scale of the ecosystem studied (Li et al., 2007; Singh et al., 2005). The results are in agreement with those of Pino et al. (1994), Möller et al. (2001), Arcos et al. (2002) and Rojas (2003), such that indicate the presence of a clear east-west salinity gradient reflecting the influence of continental and marine waters. In fact, PC1 (Table 3) was
organic and inorganic matter and the biodiversity of species. With the development of agriculture, forestry, industry and population, the area of the estuary are impacted and reduced. Effluents of industry, agriculture, forestry and residential activities are often drained into the rivers, comprising the major reason for water deterioration and point pollution of the estuary. Untreated sewage and liquid industrial wastes have made the Valdivia river one of the most polluted waterways in Chile's Valdivia province (Torres et al., 1997). Industrial activities are sources of nitrites and nitrates, while phosphorus
compounds come from agricultural, forestry and urban waste. The PC2 (Table 3) was regarded to the effects of nutrients loads to the estuary from anthropogenic sources. In addition, a seasonal variability that modulates the temperature, phytoplankton and chlorophyll a changes in the estuary observed in the PC3 (Table 3). These results are in agreement with those of Pino et al. (1994), Möller et al. (2001) and Arcos et al. (2002).
The application of the FARM model in the potential farm sites of Tornagaleones, Valdivia, bay of Corral and Ensenada San Juan showed a high variability among the carrying capacity of the sites. No specific farm harvest data were available for the Valdivia estuary, which make it difficult to evaluate the performance of the FARM model in terms of total production. Annual yields of Pacific oyster culture in farms located in south of Chile are reported to be about 70 to 100 ton TFW/ha, a result which is well matched in the FARM model simulation in Tornagaleones site. However, the individual total length given in the model to Tornagaleones (8.1 cm) and Valdivia (6 cm) farm sites match very well with the data reported by Möller et al. (2003). The good validation of the FARM model suggests that the drivers of growth are appropriately simulated (Ferreira et al., 2009). Model outputs appear to be well matched to the available data of the ecosystem and specie studied.
Water quality and eutrophication effects of Pacific oyster culture in the four potential sites were evaluated with the application of the ASSETS models implemented in FARM. FARM performs an automated carbon and nitrogen mass balance based on the net removal of these elements from the system, which have a direct relevance to integrated coastal zone management approach (Ferreira et al., 2007a; Ferreira et al., 2009). Bivalve culture can help reduce eutrophication symptoms by removing chlorophyll, thereby increasing water clarity, which promotes growth of submerged aquatic vegetation and reducing the decomposition of organic material, which in turn reduces secondary eutrophication symptoms such as oxygen depletion (Bricker et al., 2003; Ferreira et al., 2009). Tornagaleones and bay of Corral farms showed the highest nitrogen removal followed by Valdivia and San Juan (Table 5). In contrast to Tornagaleones, bay of Corral and San Juan, where the ASSETS grade does not change due to the shellfish filtration, the eutrophication indicator score shows that aquaculture farms have positive effects on water quality in Valdivia site, where the quality increases from Moderate to Good status (Fig. 15). In all the evaluated farm sites, the eutrophication indicator at the farm outlet is at Good status, except in Tornagaleones where the ASSETS grade is Moderate.
Modeling of carrying capacity with FARM requires the spatialization of results. With the use of GIS technologies and MCE technique to assess evaluation criteria and integrate data sets, useful databases and outputs can be generated for aquaculture management. The Valdivia estuary offers different values of suitable conditions for a sustainable Pacific oyster aquaculture development depending on the farm sites, with higher (0.804) probability of culture success in Tornagaleones and lower (0.211) in Ensenada San Juan. The suitable areas evaluated for a sustainable aquaculture provides to public and private managers with enough scope to be flexible in there allocation of
sustainable aquaculture sites within an integrated coastal zone management strategy. The GIS-based SISA index of favourable locations integrates different criteria (biological, production, water quality, economical) and implies estimates of carrying capacity, eutrophication and optimal profit within a system. The integrative MCE technique represents the usefulness of GIS as management tool for prospective analysis on site selection (Nath et al., 2000). Although the integration of the FARM model and MCE GIS technique can be applied in an effort to protect the water quality and allow for the sustainable use of aquaculture resource, individual perception of environmental quality differ and sustainable use can be difficult to define (Boyd & Schmittou, 1999). There are no standardized sets of sustainability indicators for costal aquaculture, although there is a necessity for their development and implementation (Frankic & Hershner. 2003), existing some progress currently (Gibbs, 2007). The use of FARM model and GIS approach in aquaculture site selection supports and assists the decision making process. This investigation identified those aquaculture concession areas most suitable for sustainable Pacific oyster management within the Valdivia estuary.
6. CONCLUSIONS
The integration of FARM and MCE GIS approach for aquaculture site selection supports and assists to water coastal managers in the decision making process. The GIS-based SISA index integrates different criteria and implies estimates of carrying capacity, eutrophication and optimal profit within a system. The results identify those aquaculture sites most suitable for a sustainable Pacific oyster management within the Valdivia estuary.
6. BIBLIOGRAPHY
Andrade C., C. León, M. Puig, C. Román, S. Zúñiga, D. Aravena & I. Honold. 2005. Diagnóstico de la acuicultura de pequeña escala en Chile. Informe Final proyecto FIP 2004-26, 105 p.
AQUA. 2007. Balance de la acuicultura de Chile 2007. Revista Aqua 117: 44-51.
Arcos, P. H. Peña, S. Núñez, J. Ortiz, L. Furet, S. Figueroa, A. Sepúlveda & H. González. 2002. Determinación de la capacidad de carga de las zonas estuarinas de los ríos Valdivia y Bueno, X Región. Informe Final INPESCA proyecto FIP 2000-29, 622 p. + Anexos.
Arnold, W.S., M.W. White, H.A. Norris & M.E. Berrigan. 2000. Hard clam (Mercenaria spp.) aquaculture in Florida, USA: geographic information system applications to lease site selection. Aquacultural Engineering, 23:203–31.
Bacher C., J. Grant, A.J.S. Hawkins, C. Fang, M. Zhu & M. Besnard. 2003. Modelling the effect of food depletion on scallop growth in Sungo Bay (China). Aquat. Living Resour 16: 10-24.
Boyd C.E. & H.R. Schmittou. 1999. Achievement of sustainable aquaculture through environmental management. Aquaculture Economics and Management, 3(1):59–69.
Bricker, S.B., J.G. Ferreira & T. Simas. 2003. An Integrated Methodology for Assessment of Estuarine Trophic Status. Ecological Modelling, 169(1): 39-60.
Brown, J.R. 1988. Multivariate analyses of the role of environmental factors in seasonal and site related growth variation in the Pacific oyster Crassostrea gigas. Marine Ecology Progress Series 45: 225–236.
Brugere, C. and Ridler, N. 2004. Global aquaculture outlook in the next decades: an analysis of national aquaculture production forecasts to 2030. FAO Fisheries Circular. No. 1001. Rome, FAO, 47p.
Campillay, C. 2006. Determinación de hidrocarburos totales de petróleo (TPH-Diesel) en choritos Mytilus chilensis (Hupe, 1854) de la Bahía de Corral y sitios aledaños. Tesis de grado para optar al título de Biólogo Marino. Escuela de Biología Marina,
Universidad Austral de Chile, 57 p. http://cybertesis.uach.cl/tesis/uach/2006/fcc196d/doc/fcc196d.pdf.
Carver, C.E.A. & A.L. Mallet. 1990. Estimating the carrying capacity of a coastal inlet for mussel culture. Aquaculture 88: 39–53.
Chamberlain, J. 2002. Modelling the Environmental Impacts of Suspended Mussel (Mytilus edulis) Farming. Napier University, Edinburgh. pp. 200.
Chaparro, O.R., C.J. Segura, Y.A. Montiel, R.J. Thompson & J.M. Navarro. 2008. Variations in the quantity and composition of seston from an estuary in southern Chile on different temporal scales. Estuarine, Coastal and Shelf Science 76 (4): 815–830.
Cisternas, M.A. 2006. Determinación de Hidrocarburos Totales de Petróleo (TPH-Diesel) en la capa superficial de la columna de agua en el sector de la Bahía de Corral y sitios aledaños. Tesis de grado para optar al título de Biólogo Marino. Escuela de Biología Marina, Universidad Austral de Chile, 35 p. + Anexos. http://cybertesis.uach.cl/tesis/uach/2006/fcf475d/doc/fcf475d.pdf.
Cristina S., A. Sequeira, A. Newton, J.G. Ferreira and J. Icely. 2007. Study Site Report Ria Formosa Coastal Lagoon, Portugal. ECASA project contract 006540, 48 p.
Cromey, C.J., Nickell, T.D. & Black, K.D. 2002. DEPOMOD modelling the deposition and biological effects of waste solids from marine cage farms. Aquaculture 214: 211-239.
Dame, R.F. & T.C. Prins. 1998. Bivalve carrying capacity in coastal ecosystems. Aquatic Ecology 31: 409–421.
Díaz, J.R. 2007. Determinación de biodisponibilidad de metales (Al, Cd, Cr, Fe, Mn, vNi, Pb y Zn) en muestras de agua y sedimento del estuario del río Valdivia mediante la técnica de Difusión de Gradiente en Capa Fina (DGT). Tesis de Grado para optar al título de Químico Farmacéutico, Universidad Austral de Chile, 39 p. + Anexos.http://cybertesis.uach.cl/tesis/uach/2007/fcd542d/doc/fcd542d.pdf.
DMC. 2008. Clasificación de Climas de Chile. Dirección Meteorológica de Chile. http://www.meteochile.cl/climas/climas.html.
Dowd, M. 1997. On predicting the growth of cultured bivalves. Ecological Modelling 104: 113–131.
Dowd, M. 2005. A bio-physical coastal ecosystem model for assessing environmental effects of marine bivalve aquaculture. Ecol. Model. 183: 323–346.
Dyer, K.R. 1997. Estuaries: A physical introduction. Second Edition. John Wiley & Sons Ltd., England, 195 p.
Ferreira, J.G. 1995. EcoWin—an object-oriented ecological model for aquatic ecosystems. Ecol. Model. 79: 21–34.
Ferreira, J.G., P. Duarte & B. Ball. 1998. Trophic capacity of Carlingford Lough for oyster culture — analysis by ecological modelling. Aquatic Ecology 31(4): 361–378.