Objective: To investigate parents’ or guardians’ perception of their residential proximity to food retailers, leisure areas, and spaces for physical activity according to neighborhood social deprivation, and test associations between the perceived environment and their children’s overweight.
Methods: Cross-sectional study conducted with 408 children and adolescents (6- to 15-year-olds) attending public schools in a medium-sized Brazilian city. Data were collected from 2011 to 2014. A telephone interview using a structured research tool determined the presence of overweight and the walking time between the participants’ home and the places evaluated. The indicator of social deprivation adopted was the Health Vulnerability Index. Logistic regression models were constructed to predict the perception of proximity (social deprivation as an explanatory variable) and evaluate perceived environmental factors (explanatory variables) associated with overweight (outcome).
Results: Residents of areas with higher social vulnerability showed a probability of perceived proximity 50 to 71% lower to supermarkets, street/produce markets, parks, recreation areas/ community centers, and gyms compared to residents of less vulnerable areas. The perceived proximity to parks reduced the chance of overweight in children and adolescents in 73%, with an odds ratio (OR) of 0.27 (95%CI 0.07–0.95; p<0.05).
Conclusions: The perceived environment of the residential area infrastructure might be related to neighborhood social deprivation and the presence of overweight in children and adolescents. Keywords: Socioeconomic factors; Feeding; Leisure activities.
Objetivo: Investigar a percepção de pais ou responsáveis sobre a proximidade residencial a locais de venda de alimentos, de lazer e de atividade física segundo a privação social da vizinhança e testar associações do ambiente percebido com o excesso de peso de seus filhos.
Métodos: Estudo transversal conduzido com 408 crianças e adolescentes (6 a 15 anos de idade) de escolas públicas de um município de médio porte brasileiro. A coleta de dados ocorreu de 2011 a 2014. Foram determinados a presença de excesso de peso e o tempo de deslocamento da residência dos participantes aos locais avaliados, questionados durante entrevista telefônica com instrumento de pesquisa estruturado. O indicador de privação social adotado foi o Índice de Vulnerabilidade da Saúde. Modelos de regressão logística foram construídos para predizer a proximidade percebida (privação social como variável explicativa) e para avaliar os fatores do ambiente percebido (variáveis explicativas) associados ao excesso de peso (desfecho).
Resultados: Moradores de áreas com maior vulnerabilidade social apresentaram chances de percepção de proximidade 50 a 71% menores para supermercados, feiras/sacolões, parques, áreas de lazer/centros comunitários e academias de ginástica, quando comparados a residentes de áreas com menor vulnerabilidade. A percepção de proximidade a parques reduziu em 73% a chance de excesso de peso em crianças e adolescentes, com Odds Ratio
(OR) de 0,27 (IC95% 0,07–0,95; p<0,05).
Conclusões: A percepção ambiental sobre a infraestrutura da área residencial pode estar relacionada com a privação social da vizinhança e a presença de excesso de peso em crianças e adolescentes. Palavras‑chave: Fatores socioeconômicos; Alimentação; Atividades de lazer.
ABSTRACT
RESUMO
*Corresponding author. E-mail: [email protected] (L.L.Mendes). aUniversidade Federal de Juiz de Fora, Juiz de Fora, MG, Brazil.
bUniversidade de São Paulo, São Paulo, SP, Brazil.
cUniversidade Federal de Minas Gerais, Belo Horizonte, MG, Brazil.
Received on June 02, 2017; approved on October 01, 2017; available online on October 31, 2018.
Overweight, perceived envirOnment,
and sOcial deprivatiOn: a study On
the perceptiOn Of parents Or guardians
Excesso de peso, ambiente percebido e privação social:
um estudo da percepção de pais ou responsáveis
Maíra Macário de Assis
a, Maria Alvim Leite
b, Alessandra Jordão Côrtes
a,
Ariene Silva do Carmo
c, Fernanda Penido Matozinhos
c,
INTRODUCTION
Obesity in children and adolescents is a public health issue in several countries due to its progressive prevalence increase in recent decades, and for being an important risk factor for the development of chronic non-communicable diseases, which contribute to reduce life quality and expectancy.1 As a
mul-tifactorial disease, besides genetic components and lifestyle habits, family, social, and environmental contexts can be pre-dictors of weight gain.2
Regarding the influence of the environment on food con-sumption, in developed countries, the lower distance and higher density of fast food restaurants and convenience stores in the residential surroundings are associated with more monotonous and highly caloric food choices among children and adoles-cents.3 Moreover, the lack of leisure spaces and facilities can
hinder the practice of physical activity.1 Together, these factors
represent an obesogenic behavior and contribute to the increase in obesity prevalence for this age group.4
The social environment includes different aspects, such as housing, safety, income, and access to healthcare services, which can also influence the behavior of individuals and health out-comes, be it by creating opportunities and facilitating the deci-sion-making process, or by hindering them.5 The concept of
social deprivation has been used to evaluate this environment with the purpose of identifying, measuring, and explaining the forms of inequality based on socioeconomic conditions.6 In this
scenario, neighborhoods with greater social deprivation are the most affected, presenting less diversity of trades and services, which is possibly a result of the scarcity of local resources and infrastructure, and high crime rates.7
International data on the availability and access to food retailers showed that children and adolescents who live close to stores specialized in the sale of fresh and unprocessed foods – such as produce markets –,8 away from places that sell unhealthy
foods – e.g., fast food restaurants –,9 and in areas with a higher
number of supermarkets that predominantly sell healthy foods over unhealthy ones10 showed lower obesity prevalence.
In Brazil, studies on the environment focused on objective measures suggest that residents of higher income neighbor-hoods have better access to all types of food retailers, includ-ing supermarkets and street markets.11 However, studies that
investigate parents’ or guardians’ perception of environmental aspects and relate them to the nutritional status of their chil-dren are still scarce12, and, currently, there are none that
con-sider the contrasts between the different socioeconomic status of the place of residence.
Considering the importance of exploring the environmental inequalities that could affect health conditions, the purpose of the present study was to investigate the differences in parents’
or guardians’ perception of their residential proximity to food retailers and leisure areas/spaces for physical activity in levels of neighborhood social deprivation. We also aimed to test the associations between the perceived environment and their chil-dren’s overweight.
METHOD
This is a cross-sectional study conducted with children and ado-lescents aged 6 to 15 years attending public schools and their parents or guardians in a medium-sized Brazilian city (Juiz de Fora, Minas Gerais). Data were collected from 2011 to 2014.
According to the 2009 School Census,13 the number of
children and adolescents enrolled in public schools in Juiz de Fora was 71,671. To calculate the sample size, we used an esti-mate of proportion of 50% for a given characteristic, a value that provides the largest sample size for a finite population (71,671), and set the significance level (alpha or type I error) and sampling error in 5%.14,15 Thus, the estimated n sample
comprised 383 participants.
The sample design was probabilistic and clustered in three stages:
1. schools: randomly and proportionally selected in each of the seven administrative districts of the city, totaling 36 schools;
2. classes: all classes by grade that met the age group of interest were included;
3. students: randomly and proportionally selected in each grade, totaling 708 students.
We considered this number due to possible losses caused by absences on the day of data collection or parents who refused to let their children participate. Weighting factors were not used in the sample design since the purpose of the study was not to extrapolate the findings to the population of children and adolescents attending public schools in the city.
The first step was to collect anthropometric measurements of weight and height of the students, which happened in a pri-vate room in the schools. Trained researchers conducted these measurements, using a calibrated digital scale (weight in kg) and a portable stadiometer (height in m). The cut-off point for overweight was z score>+1 standard deviation of body mass index (BMI) for age, according to the growth curves of the World Health Organization (WHO).16
of the parent or guardian (less or more than 11 years of study), and household monthly income (collected in Brazilian reals and categorized into quartiles of distribution). The multiracial cat-egory included children and adolescents who reported having light to dark brown skin color. The category of more than or equal to 11 years of study included parents or guardians with the following levels of education: complete high school, com-plete and incomcom-plete higher education; for the category of less than 11 years of study, the levels were: illiterate, complete and incomplete elementary school, complete and incomplete mid-dle school, and incomplete high school.
To collect information on the perceived food environment of the residential neighborhood of children and adolescents, a subsample of 408 children and adolescents (58% of the ini-tial sample) and their parents or guardians agreed to participate (Figure 1). The information was collected via telephone call, in which parents and/or guardians of the participants answered an adapted selection of the validated Portuguese version of the Neighborhood Environment Walkability Scale (NEWS),17
an instrument that evaluates perceived environmental character-istics. The full scale has questions about the perception of access to services, the existence of sidewalks and bikeways, traffic safety, and security against crimes among others, represented by two categories of answer – “yes” and “no” or “agree” and “disagree.” It also includes questions on the perception of walking time to different types of establishments in the neighborhood of residence. The questions selected from the scale for this study were related to the proximity to food retailers and leisure areas/ spaces for physical activity. More specifically, those associated with mini-market, supermarket, street/produce market, park, recreation area/community center, and gym; and the walking time (or proximity) from the family’s residence to these sites (up
to 10 minutes, 11 to 20 minutes, more than 20 minutes, and does not have). The category “does not have” refers to the lack of perception of food retailers or leisure areas/spaces for phys-ical activity in the neighborhood. Recreation area was defined as a public area, without buildings, intended for active games.18
For the walking time/proximity to food retailers variable, we assumed that, on average, an adult tends to walk 400 m in 5 minutes, that is, almost 500 m, and adolescents, at a mod-erate pace, are able to walk more than 1,500 m in 15 minutes.2
The indicator of social deprivation used was the Health Vulnerability Index (HVI).19 To construct it, we used
informa-tion from the 2010 Census.20 This indicator was dichotomized
into low vulnerability (low or medium risk) and high vulner-ability (high or very high risk). The synthetic index takes into account sanitation and socioeconomic aspects (such as water supply, sanitary sewer, waste destination, residents per house-hold, illiteracy, income, and ethnicity/skin color) in its con-struction in order to analyze the characteristics of population groups in certain geographical areas and reveal the inequali-ties in the epidemiological profile of different social groups.19
The statistical analysis included the calculation of relative and absolute frequency distribution. To test the association between sociodemographic characteristics and overweight among children and adolescents, we used the chi-square test. Simple multinomial logistic regression models were constructed to predict the perceived proximity to food retailers, leisure areas, and spaces for physical activity. All models used the HVI classi-fication of the residence as an explanatory variable. Odds ratio (OR) with a confidence interval of 95% (95%CI) was used as an effect measure. To evaluate perceived environmental factors associated with overweight, we used simple and multiple binary logistic regressions, with overweight as outcome, and aspects of the perceived environment (perceived proximity to food retail-ers, leisure areas, and spaces for physical activity) as explana-tory variables. These models were adjusted for gender and age of children or adolescents, schooling of parents or guardians, monthly household income, and HVI. We used the Hosmer-Lemeshow test to verify the adjustment of the multiple model. OR with 95%CI was used as an effect measure. All analyses adopted a significance level of 5% (p<0.05).
The Committee for Ethics in Research of Universidade Federal de Juiz de Fora (CEP/UFJF) approved this project, according to the terms defined in Resolution No. 466/12 of the National Health Council, Report No. 522,694.
RESULTS
408 children and adolescents aged 6 to 15 years participated in the study. Out of them, 53.4% (n=218) were female, Figure 1 Flowchart of the sample composition.
1st stage of the study Conducted with 708 children
and adolescents (100%)
2nd stage of the study Conducted with 408 children
and adolescents (58%)
Losses:
300 children and adolescents (42%)
Reasons:
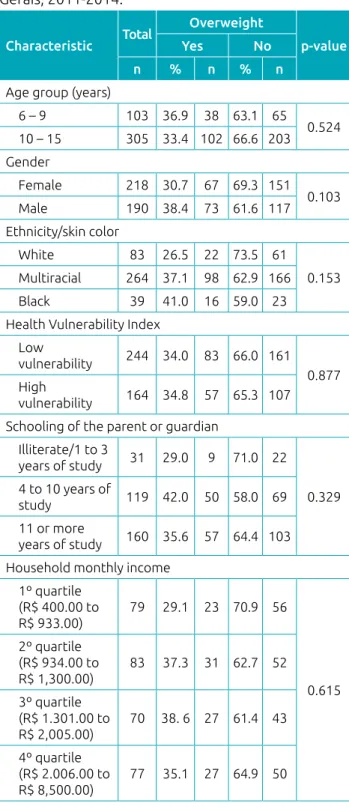
and 74.85% (n=305) were adolescents. The overweight prev-alence was 34.3% (n=140). Most participants declared being multiracial (68.4%; n=264) and lived in less vulnerable areas according to their HVI (59.8%; n=244). Regarding parents or guardians, 51.6% (n=160) of them reported having 11 or more years of study, and monthly household income ranged from R$ 400.00 to R$ 8,500.00.
Table 1 presents the socioeconomic and demographic char-acteristics of children and adolescents stratified by overweight presence. There were no statistically significant differences.
Regarding food retailers, compared to residents of less vul-nerable neighborhoods, those who live in areas with higher social vulnerability showed a probability of perceived proximity 55 and 60% lower to supermarkets up to 10 minutes away (OR 0.45; 95%CI 0.25–0.80) and 11 to 20 minutes away (OR 0.40; 95%CI 0.22–0.75), respectively; and 50 and 51% lower to street/produce markets up to 10 minutes away (OR 0.50; 95%CI 0.27–0.90) and 11 to 20 minutes away (OR 0.51; 95%CI 0.26–0.97), respec-tively (Table 2). With respect to leisure areas/spaces for physical activity, regions of higher vulnerability had 66% less chance of perceived proximity to parks 11 to 20 minutes away (OR 0.34; 95%CI 0.12–0.94), and 50% for recreation areas/community centers up to 10 minutes away (OR 0.50; 95%CI 0.29–0.85). Still on residents of more vulnerable areas, the probability of perceived proximity to gyms was 68, 71, and 66% lower for dis-tances up to 10 minutes (OR 0.32; 95%CI 0.19–0.52), 11 to 20 minutes (OR 0.29; 95%CI 0.16–0.52), and more than 20 minutes (OR 0.34; 95%CI 0.17–0.68), respectively (Table 2).
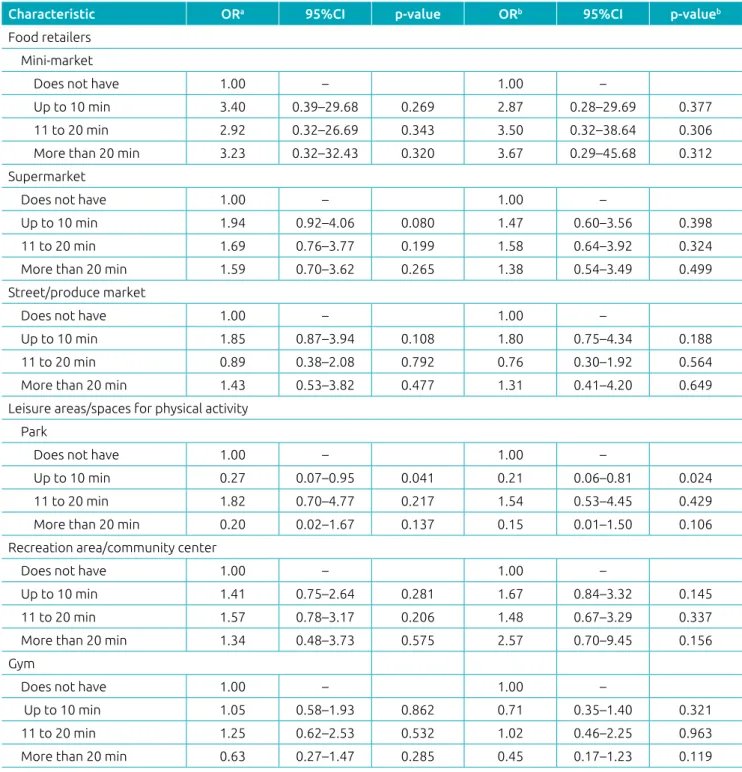
Table 3 describes simple and multiple binary logistic regres-sion analyses to predict overweight among the children and adolescents evaluated. The simple analysis, when adjusted for potential confounding factors, showed that parents’ or guard-ians’ perceived proximity to parks (up to 10 minutes) reduced in 73% the chances of overweight in children and adolescents (OR 0.27; 95%CI 0.07–0.95). This association remained sig-nificant even after adjustment for other independent variables (OR 0.21; 95%CI 0.06–0.81). The other variables were not associated with overweight.
DISCUSSION
The results showed that the perceived proximity to food retailers and leisure areas/spaces for physical activity varied according to neighborhood social deprivation, with residents of less vulner-able areas having the perception of being closer to supermar-kets, street/produce marsupermar-kets, parks, recreation areas/community centers, and gyms. Moreover, they suggest that the reported proximity to parks acted as a protective factor for overweight in children and adolescents.
This study did not evaluate the aspects of the built environ-ment directly, but through the subjective perception of individuals, which tends to be closer to the actual characteristics of the physi-cal environment21 and are important, as people take into account
Characteristic Total
Overweight
p‑value Yes No
n % n % n Age group (years)
6 – 9 103 36.9 38 63.1 65
0.524 10 – 15 305 33.4 102 66.6 203 Gender
Female 218 30.7 67 69.3 151
0.103 Male 190 38.4 73 61.6 117
Ethnicity/skin color
White 83 26.5 22 73.5 61
0.153 Multiracial 264 37.1 98 62.9 166
Black 39 41.0 16 59.0 23 Health Vulnerability Index
Low
vulnerability 244 34.0 83 66.0 161
0.877 High
vulnerability 164 34.8 57 65.3 107 Schooling of the parent or guardian
Illiterate/1 to 3
years of study 31 29.0 9 71.0 22
0.329 4 to 10 years of
study 119 42.0 50 58.0 69 11 or more
years of study 160 35.6 57 64.4 103 Household monthly income
1º quartile
(R$ 400.00 to
R$ 933.00)
79 29.1 23 70.9 56
0.615 2º quartile
(R$ 934.00 to
R$ 1,300.00)
83 37.3 31 62.7 52
3º quartile
(R$ 1.301.00 to
R$ 2,005.00)
70 38. 6 27 61.4 43
4º quartile
(R$ 2.006.00 to
R$ 8,500.00)
77 35.1 27 64.9 50
their perception of the environment where they live when making decisions.5 In the group of children and adolescents, family
mem-bers are determinant to food choices and lifestyle. Also, according to the literature, parents’ or guardians’ negative perception of food
environment characteristics was associated with lower availability of fruits at home22,23, and their perceived proximity to leisure areas
and spaces for physical activity was positively correlated to their children’s recreation and physical activity time (reported by them).23
Characteristic Total % (n) Vulnerability OR (95%CI) p‑valuea
Low % (n) High % (n) Food retailers
Mini-market
Does not have 6.86 (28) 8.20 (20) 4.88 (8) Reference – Up to 10 min 3.68 (15) 2.87 (7) 4.88 (8) 0.53 (0.18–1.52) 0.243 11 to 20 min 67.65 (276) 70.08 (171) 64.02 (105) 0.81 (0.27–2.44) 0.719 More than 20 min 21.81 (89) 18.85 (46) 26.22 (43) 0.35 (0.09–1.28) 0.155 Supermarket
Does not have 21.81 (89) 18.85 (46) 26.22 (43) Reference – Up to 10 min 18.38 (75) 14.34 (35) 24.39 (40) 0.45 (0.25–0.80) 0.007 11 to 20 min 34.31 (140) 37.70 (92) 29.27 (48) 0.40 (0.22–0.75) 0.004 More than 20 min 25.49 (104) 29.10 (71) 20.12 (33) 0.82 (0.44–1.51) 0.522 Street/produce market
Does not have 12.04 (49) 11.93 (29) 12.20 (20) Reference – Up to 10 min 14.50 (59) 11.11 (27) 19.51 (32) 0.50 (0.27–0.90) 0.022 11 to 20 min 47.42 (193) 49.79 (121) 43.90 (72) 0.51 (0.26–0.97) 0.042 More than 20 min 26.04 (106) 27.16 (66) 24.39 (40) 0.58 (0.27–1.25) 0.166 Leisure areas/spaces for physical activity
Park
Does not have 2.45 (10) 3.28 (8) 1.22 (2) Reference – Up to 10 min 85.54 (349) 81.15 (198) 92.07 (151) 0.41 (0.16–1.06) 0.067 11 to 20 min 6.13 (25) 7.79 (19) 3.66 (6) 0.34 (0.12–0.94) 0.038 More than 20 min 5.88 (24) 7.79 (19) 3.05 (5) 0.32 (0.06–1.56) 0.162 Recreation area/community center
Does not have 5.93 (24) 6.20 (15) 5.52 (9) Reference – Up to 10 min 57.53 (233) 52.89 (128) 64.42 (105) 0.50 (0.29–0.85) 0.010 11 to 20 min 21.98 (89) 26.03 (63) 15.95 (26) 0.77 (0.43–1.39) 0.401 More than 20 min 14.57 (59) 14.88 (36) 14.11 (23) 0.73 (0.30–1.73) 0.479 Gym
Does not have 11.55 (47) 24.28 (59) 9.15 (15) Reference – Up to 10 min 36.61 (149) 25.93 (63) 52.44 (86) 0.32 (0.19–0.52) <0.001 11 to 20 min 31.45 (128) 13.17 (32) 23.78 (39) 0.29 (0.16–0.52) <0.001 More than 20 min 20.39 (83) 36.63 (89) 14.63 (24) 0.34 (0.17–0.68) 0.003 Table 2 Simple multinomial logistic regression analyses to predict the perceived proximity to different food
retailers and leisure areas/spaces for physical activity based on the Health Vulnerability Index of the residence. Juiz de Fora, Minas Gerais, 2011-2014.
Min: minutes; OR: odds ratio; 95%CI: confidence interval of 95%; p‑value<0.05; ain all models, the explanatory variable was the Health
The present study revealed variation in reported walking time, according to the level of neighborhood social depri-vation. This scenario can be explained by the better infra-structure of trades and services, such as food retailers, which
tend to be present in more affluent areas,24 in addition to the
establishment of parks and public places for the practice of physical activity and better transport system.11 These factors
can affect the lifestyle and eating habits of families, as the
Characteristic ORa 95%CI p‑value ORb 95%CI p‑valueb
Food retailers Mini-market
Does not have 1.00 – 1.00 –
Up to 10 min 3.40 0.39–29.68 0.269 2.87 0.28–29.69 0.377 11 to 20 min 2.92 0.32–26.69 0.343 3.50 0.32–38.64 0.306 More than 20 min 3.23 0.32–32.43 0.320 3.67 0.29–45.68 0.312 Supermarket
Does not have 1.00 – 1.00 –
Up to 10 min 1.94 0.92–4.06 0.080 1.47 0.60–3.56 0.398 11 to 20 min 1.69 0.76–3.77 0.199 1.58 0.64–3.92 0.324 More than 20 min 1.59 0.70–3.62 0.265 1.38 0.54–3.49 0.499 Street/produce market
Does not have 1.00 – 1.00 –
Up to 10 min 1.85 0.87–3.94 0.108 1.80 0.75–4.34 0.188 11 to 20 min 0.89 0.38–2.08 0.792 0.76 0.30–1.92 0.564 More than 20 min 1.43 0.53–3.82 0.477 1.31 0.41–4.20 0.649 Leisure areas/spaces for physical activity
Park
Does not have 1.00 – 1.00 –
Up to 10 min 0.27 0.07–0.95 0.041 0.21 0.06–0.81 0.024 11 to 20 min 1.82 0.70–4.77 0.217 1.54 0.53–4.45 0.429 More than 20 min 0.20 0.02–1.67 0.137 0.15 0.01–1.50 0.106 Recreation area/community center
Does not have 1.00 – 1.00 –
Up to 10 min 1.41 0.75–2.64 0.281 1.67 0.84–3.32 0.145 11 to 20 min 1.57 0.78–3.17 0.206 1.48 0.67–3.29 0.337 More than 20 min 1.34 0.48–3.73 0.575 2.57 0.70–9.45 0.156 Gym
Does not have 1.00 – 1.00 –
Up to 10 min 1.05 0.58–1.93 0.862 0.71 0.35–1.40 0.321 11 to 20 min 1.25 0.62–2.53 0.532 1.02 0.46–2.25 0.963 More than 20 min 0.63 0.27–1.47 0.285 0.45 0.17–1.23 0.119 Table 3 Simple and multiple logistic regression analyses to predict overweight among children and adolescents. Juiz de Fora, Minas Gerais, 2011-2014.
Min: minutes; OR: odds ratio; 95%CI: confidence interval of 95%; p‑value<0.05; asimple regression adjusted for gender and age of the child or
adolescent, schooling of the parent or guardian, household monthly income, and Health Vulnerability Index; bmultiple regression adjusted for
presence of parks, sports facilities, and healthy food retail-ers near the residence might encourage the practice of phys-ical activity and appropriate food consumption, with direct implications on health.1
On the other hand, areas with higher socioeconomic vul-nerability had a lower probability of perceived proximity to all types of food retailers. This shortage of services could be due to the insecurity caused by higher crime rates, the precar-ious urban infrastructure, and the low socioeconomic level of the inhabitants of these areas, which limits their purchasing power25 and, in turn, makes these regions less attractive to
entrepreneurs, discouraging the establishment of stores in these surroundings.7 Such social disadvantages contribute to create
obesogenic environments that put children and adolescents at greater risk of gaining weight.1
Regarding the association between parents’ or guardians’ perceived proximity to parks and a lower chance of overweight among children and adolescents, recent studies have investi-gated the influence of perceived environment on nutritional status.23,26 In Itirapuã, a small city in São Paulo, living further
from public squares or outdoor areas where it is possible to practice physical activities increased the chance of overweight in adults (OR 2.05; 95%CI 1.15–3.66).26
A North American study conducted with children and adolescents aged 10 to 17 years found that those who lived in unfavorable social conditions, such as unsafe environment, poor houses, and without access to sidewalks, parks, and rec-reation centers, had 20 to 60% more chance of being obese or overweight.4
In cities, parks are public spaces intended not only for walk-ing, commutwalk-ing, practicing physical activity, and recreation but also as a place suited for social interaction, especially for the part of the population without access to private environments for physical activity, such as clubs and gyms.27 Thus, measures
such as proper maintenance, safety, and easy access can encour-age their use. For instance, parents could allow their children
to play outside, reducing the time spent on computer activi-ties or watching television, reinforcing an active lifestyle.27,28
Some limitations of the present study are: first, the cross-sec-tional design, which reveals associations without evaluating causalities. Also, the study did not assess the practice of phys-ical activity and food consumption, factors directly related to nutritional status. Only public-school students were evaluated, so the findings should not be extrapolated to all children and adolescents in the city. Nonetheless, considering that many of the public policies outlined also influence this group, it is crucial to study this population. The questionnaire with information about the proximity to food retailers, leisure areas, and spaces for physical activity was answered via telephone call, based on parents’ or guardians’ reports of their perceived environment, rather than direct observation. However, other similar studies conducted via telephone interview29 confirmed the validity and
reproducibility of the NEWS questionnaire,17 and identified
the existence of associations between perceived and reported environmental characteristics and those measured in a direct way.21 It is also important to clarify that the study did not
assess which food retailers families used the most, only their residential proximity.
In view of the above, it is relevant to investigate perceived environmental aspects, given their importance in the deci-sion-making process, and consider the social and infrastructure elements related to healthy eating habits, leisure, and the prac-tice of physical activities in urban planning to make the creation of environments that promote health possible.
funding
National Council for Scientific and Technological Development (Conselho Nacional de Desenvolvimento Científico e Tecnológico), Brazil, grant No. 484946/2013-7.
conflict of interests
The authors declare no conflict of interests.
REFERENCES
1. Townshend T, Lake A. Obesogenic environments: current evidence of the built and food environments. Perspect Public Health. 2017;137:38-44.
2. Motter AF, Vasconcelos FA, Correa EN, Andrade DF. Retail food outlets and the association with overweight/obesity in schoolchildren from Florianópolis, Santa Catarina State, Brazil. Cad Saúde Pública. 2015;31:620-32.
3. Engler-Stringer R, Shah T, Bell S, Muhajarine N. Geographic access to healthy and unhealthy food sources for children in
neighbourhoods and from elementary schools in a mid-sized Canadian city. Spat Spatiotemporal Epidemiol. 2014;11:23-32.
4. Singh GK, Siahpush M, Kogan MD. Neighborhood socioeconomic conditions, built environments, and childhood obesity. Health Aff (Millwood). 2010;29:503‑12.
5. Barnett E, Casper M. A definition of “social environment”. Am J Public Health. 2001;91:465.
© 2018 Sociedade de Pediatria de São Paulo. Publicado por Zeppelini Publishers. This is an open access article under the CC BY (https://creativecommons.org/licenses/by/4.0/deed.pt).
7. Maguire ER, Burgoine, T, Monsivais P. Area deprivation and the food environment over time: A repeated cross-sectional study on takeaway outlet density and supermarket presence in Norfolk, UK, 1990–2008. Health Place. 2015;33:142-7.
8. Jennings A, Welch A, Jones AP, Harrison F, Bentham G, Sluijs EM, et al. Local food outlets, weight status, and dietary intake: associations in children aged 9-10 years. Am J Prev Med. 2011;40:405-10.
9. Carroll-Scott A, Gilstad-Hayden K, Rosenthal L, Peters SM, McCaslin C, Joyce R, et al. Disentangling neighborhood contextual associations with child body mass index, diet, and physical activity: the role of built, socioeconomic, and social environments. Soc Sci Med. 2013;95:106-14.
10. Hutchinson Pl, Bodor JN, Swalm CM, Rice JC, Rose D. Neighborhood food environments and obesity in southeast Louisiana. Health Place. 2012;18:854-60.
11. Jaime PC, Duran AC, Sarti FM. Lock K. Investigating environmental determinants of diet, physical activity, and overweight among adults in Sao Paulo, Brazil. J Urban Health. 2011;88:567-81.
12. Leite MA, Assis MM, Silva BP, Matozinhos FP, Padez C, Cândido AP, et al. Perceptions of neighborhood environments and their association with overweight in children, adolescents, and caretakers in a medium-sized city in Brazil. Nutrire. 2017;42:8.
13. Brasil - Ministério da Educação. Instituto Nacional de Estudos e Pesquisas Educacionais Anísio Teixeira/INEP.Censo Escolar 2009. Brasília: Ministério da Educação; 2009.
14. Browner WS, Cummings SR, Hulley SB. Estimando o tamanho da amostra e o poder estatístico: pontos básicos. In: Hulley SB, Cummings SR, Browner WS, Grady DG, Newman TB. Delineando a pesquisa clínica: uma abordagem epidemiológica. Porto Alegre: Artmed; 2001. p.83-110.
15. Hulley SB, Cummings SR, Browner WS, Grady DG, Newman TB. Designing clinical research. Baltimore: Williams & Wilkins; 1988.
16. Onis M, Onyango AW, Borghi E, Siyam A, Nishida C, Siekmann J. Development of a WHO growth reference for school-aged children and adolescents. Bull World Health Organ. 2007;85:660-7.
17. Malavasi LM. Escala de mobilidade ativa em ambiente comunitário (NEWS - versão brasileira): validade e fidedignidade [master’s thesis]. Florianópolis (SC): Universidade Federal de Santa Catarina; 2006.
18. Cosgrove I; Jackson R. The geography of recreation and leisure. Abingdon-on-Thames: Routledge; 2015.
19. Belo Horizonte – Prefeitura de Belo Horizonte. Índice de vulnerabilidade da saúde 2012. Belo Horizonte (MG): Prefeitura de Belo Horizonte; 2013.
20. Brasil - Ministério do Planejamento, Orçamento e Gestão. Instituto Brasileiro de Geografia e Estatística - IBGE [homepage on the Internet]. Censo 2010[cited 2016 Mar 02]. Rio de Janeiro: IBGE; 2010. Available from: http://www. censo2010.ibge.gov.br/
21. Troped PJ, Saunders RP, Pate RR, Reininger B, Ureda JR, Thompson SJ. Associations between self-reported and objective physical environmental factors and use of a community rail-trail. Prev Med. 2001;32:191-200.
22. Ansem WJ, Schrijvers CT, Rodenburg G, Mheen D. Is there an association between the home food environment, the local food shopping environment and children’s fruit and vegetable intake? Results from the Dutch INPACT study. Public Health Nutr. 2013;16:1206-14.
23. Tappe KA, Glanz K, Sallis JF, Zhou C, Saelens BE. Children’s physical activity and parents’perception of the neighborhood environment: neighborhood impact on kids study. Int J Behav Nutr Phys Act. 2013;10:39.
24. Pe s s o a M C , M e n d e s L L , C a i a f f a W T, M a l t a D C , Velásquez-Meléndez G. Availability of food stores and consumption of fruit, legumes and vegetables in a Brazilian urban area. Nutr Hosp. 2014;31:1438-43.
25. Walker JL, Holben DH, Kropf ML, Holcomb JP Jr, Anderson H. Household food insecurity is inversely associated with social capital and health in females from special supplemental nutrition program for women, infants, and children households in Appalachian Ohio. J Am Diet Assoc. 2007;107:1989-93.
26. Nascimento MA, Zucolotto DC, Sartorelli DS. The association between self-rated living environment and excess weight in a small Brazilian town. Cad Saúde Pública. 2015;31:173-82.
27. Silva MC, Silva AB, Amorim TE. Public area conditions and physical activity practice in the city of Pelotas/RS/Brazil. Rev Bras Ativ Fis Saúde. 2012;17:28-32.
28. Pirgon Ö, Aslan N. The role of urbanization in childhood obesity. J Clin Res Pediatr Endocrinol. 2015;7:163-67.