Physical inactivity and
associated factors in adults, São
Paulo, Brazil
Inatividade física e fatores
associados em adultos, São Paulo,
Brasil
Luane Margarete Zanchetta
IMarilisa Berti de Azevedo Barros
IChester Luiz Galvão César
IILuana Carandina
IIIMoisés Goldbaum
IVMaria Cecília Goi Porto Alves
VI Departamento de Medicina Preventiva e Social da Faculdade de Ciências
Médicas da Universidade Estadual de Campinas - UNICAMP.
II
Departamento de Epidemiologia da Faculdade de Saúde Pública da Universidade de São Paulo – USP.
III
Departamento de Saúde Pública da Faculdade de Medicina de Botucatu da Universidade Estadual Paulista – UNIFESP.
IV
Departamento de Medicina Preventiva da Faculdade de Medicina da Universidade de São Paulo – USP.
V Instituto de Saúde da Secretaria Estadual de Saúde de São Paulo.
Correspondência: Luane Margarete Zanchetta,Departamento de Medicina Preventiva e Social da Faculdade de Ciências Médicas da UNICAMP, Caixa postal 6111, Campinas, SP CEP 13083-970. E-mail: [email protected]
Abstract
Objective: To analyze the prevalence of overall and leisure time physical inactivity and associated factors and types of exercises or sports modalities according to schoo-ling in 2,050 adults from 18 to 59 years of age - state of São Paulo, Brazil. Methods:
Population-based cross-sectional study with a stratiied sample of clusters perfor-med in multiple stages. Physical inactivity was determined using the short version of the International Physical Activity Question-naire – IPAQ and by a question on the regular practice of leisure time physical activity. Data analysis took the sample design into account. Results: Prevalence of physical inactivity during leisure was higher among women. Poisson multiple regression model in man indicated that overall sedentarism was lower among single and separated men, students and without car in the household. Leisure physical inactivity was greater among men over forty years, among those with less schooling and full-time students. Overall physical inactivity was more preva-lent among woman with more schooling, with less qualiied occupations and wido-ws. Leisure physical inactivity decreased with age and schooling. Among modalities practiced for leisure, walking was more prevalent among women and football was more prevalent among men. Most modali-ties were directly associated with schooling; approximately 25% of the individuals with more than 12 years of schooling practiced walking. Conclusions: These results suggest that interventions and public policies to promote physical activity should consider differences in gender and socioeconomic status as well as the preferences for different modalities and the context in which the physical activity is practiced.
Introduction
The twentieth century was marked by the progressive growth of physical inactivity which has reached extremely high prevalen-ce today in both developed and developing countries1. Consistent scientiic evidences has been produced on different beneits to health through physical activity1-3. People who engage in regular physical activities have lower risk of developing cardiovascular diseases, diabetes, some cancers, obesity, de-pression and anxiety symptoms among other morbidities1,3-5. Also, active people have lower rates of cardiovascular and overall mortality6. These indings led physical inactivity to be considered one of the most current relevant health problem for the role it plays in the in-cidence and prevalence of chronic diseases1,7. Consequently, the practice of physical activity has become an important resource to be used in order to prevent and control chronic diseases and has been gaining importance in public policy proposals to health promotion6,7. It is considered that the decrease in physical inactivity could have great impact on the costs of health services and on the improvement of the population health5.
In epidemiological studies, physical activity has been focused in two contexts: physical activity during leisure time - which includes games, sports, hiking and exercises undertaken during leisure time; and overall physical activity - which includes, in addition to leisure activities, those performed as a me-ans of locomotion, at work and househould1,8. Most epidemiological studies analyze physical activity in general in the context of leisure, and evidences of associations between health and overall physical activity are scarce and contro-versial9. There are few articles which analyze both physical activity in the overall context and in leisure time 10.
Population-based studies have used di-fferent tools and criteria to measure physical inactivity and the level of physical activity whi-ch hinders the comparability of the results9,11. For population-based surveys it is essential to use a valid instrument, of easy application, low cost, allowing the comparison among
Resumo
Objetivo: Analisar prevalências de inativida-de física e fatores associados, e exercícios e esportes praticados segundo escolaridade em 2.050 adultos de 18 a 59 anos de ida-de - Estado ida-de São Paulo, Brasil. Métodos:
Estudo transversal de base populacional com amostra estratiicada e em múltiplos estágios. A inatividade física global foi aferida pelo International Physical Activity questionary – IPAQ short version, e por questão sobre prática regular de atividade física no lazer. A análise dos dados levou em conta o desenho amostral. Resultados:
A prevalência de inatividade física no lazer foi maior entre as mulheres. Já a inatividade física pelo IPAQ foi maior entre os homens. Modelos de regressão múltipla de Poisson indicaram, nos homens, menor inatividade física pelo IPAQ nos solteiros e separados, estudantes e aqueles que não possuíam carro. A inatividade física no lazer foi maior nos homens acima de 40 anos e com menor escolaridade ou apenas estudantes. A ina-tividade física pelo IPAQ, nas mulheres, foi mais prevalente entre as com maior esco-laridade, ocupações menos qualiicadas e viúvas; a inatividade física no lazer diminuiu com o aumento da idade e da escolaridade. Entre as modalidades praticadas no lazer, a caminhada foi a mais prevalente nas mulhe-res e o futebol nos homens. A maioria das modalidades foi diretamente associada à escolaridade; aproximadamente 25% dos indivíduos com mais de 12 anos de estudo praticava caminhada. Conclusões: Estes resultados sugerem que intervenções e políticas públicas de promoção da ativi-dade física devem considerar diferenças socioeconômicas, de gênero, bem como as modalidades e o contexto em que a ativida-de física é praticada.
surveys conducted in different localities. The instrument that has been most frequently used in epidemiological studies in Brazil is the
International Physical Activity Questionnaire (IPAQ). This questionnaire was proposed by the World Health Organization, with the objective of making available a tool for mea-suring physical activity level, which could be applied in different regions and cultures. The questionnaire was tested in several countries, including Brazil 12.
The importance of physical activity for public health makes it necessary to increase the knowledge of the epidemiological pattern of this practice and to monitor population subgroups prevalences.
Given these indings, this study aimed to analyze the prevalence of overall physical inactivity and inactivity during leisure time and the association of these indicators with demographic and socioeconomic factors in adults between 18-59 years old living in areas of the state of Sao Paulo, as well as to evaluate differentials in the ways of physical exercise and sports played according to schooling.
Material and methods
This cross-section study used data from population-based health surveys conducted in the period of 2001 to 2002, in non-institu-tionalized urban residential populations in four areas in the state of São Paulo - Brazil:
• City of Campinas • City of Botucatu
• District of Butantã, in the city of São Paulo • An area encompassing the cities of
Ita-pecerica da Serra, Embu and Taboão da Serra.
A two-stage probabilistic sample was obtained. In each area of research, the cen-sus urban tracts were grouped into three strata according to the percentage of heads of household with college-level education less than 5%, 5% to 25% and over 25%. In each one of the areas 10 census tracts were selected from each strata with proportional probability in according to the size of the census tracts
expressed by the number of households on that. In the second stage, a systematic sample of households was drawn in each selected census tracts.
The minimum size set for the sample took into account the possibility to estimate a prevalence of 0.5, with a sample error of 0.10, considering a 95% conidence in the determi-nation of conidence intervals, and a design effect estimated in 2. Considering possible losses the minimum sample size was high at 20%. Further details of the methodology can be found at Alves et al13.
For this study data from subjects aged from 18 to 59 years was analyzed.
The survey questionnaire included ques-tions about socioeconomic condiques-tions, morbidity during the past 15 days, chronic diseases check list, use of health services and health-related behaviors, among other topics. The questionnaire was applied directly to the person selected.
The variables included in this study were:
Physical activity evaluated by
International Physical Activity
Questionnaire
(QIAF – IPAQ), short version, which veriies the weekly frequency, duration and intensity of physical activity performed in the following contexts: work, transportation, household and leisure time activities. The subjects were categorized into:
• Sedentary: no physical activity for at least
10 continuous minutes in any weekday.
• Insuficiently active: physical activity for
at least 10 continuous minutes in some weekday without meeting the criteria to be classiied as active.
• Active:
- Vigorous activities at least 3 days a week and at least 20 minutes in each session
- Moderate activity or walking at least 5 days a week and at least 30 minutes or
• Very active:
- Vigorous activities at least 5 days a week for at least 30 minutes
- Vigorous activities at least 3 days a week, with 20 or more minutes per session, plus moderate activity or walking at least 5 days per week and with at least 30 minutes per session.
In this study these categories were group in this manner “sedentary + insuficiently active” and used the term “insuficiently active” to designate this category.
Leisure time physical activity: was set to insuficiently active on leisure time, the individual that answered negatively to the question: “Do you regularly practice, at least once a week, any sport or exercise?”
Socioeconomic and demographic va-riables: gender (female and male), age (18 - 29, 30-39, 40-49 and 50 to 59 years), race/ ethnicity (white, black/brown and others), marital status (married, stable union wi-thout marry, singles, widows and divorced), religion (Evangelical and other), schooling (0-7, 8 to 11 and 12 or more years of study), per capita household income (less than or equal to 2 minimum Brazilian salaries and more than 2), automobile ownership by the family (yes or no), type of dwelling at the time of the interview, grouped into: “household activities” (domestic occupa-tion in own house), unemployed, students, higher qualiication occupations (including directors, top-level professionals and pro-fessionals at the technical level), and lowest qualifying occupations (including workers without direction, technical or top-level jobs, with activities in commerce, adminis-tration, provision of services, industry or agriculture).
The data was enter in Epi Info database. Analyses were made with STATA program using svy commands (for complex samples analysis).
The prevalence of overall physical inac-tivity (IPAQ) and at leisure time for each sex was estimated in according to the set of
socioeconomic and demographic variables. To test these associations, the chi-squared test was used with a signiicance level of 5%. The prevalences and prevalence ratios were calculated with 95% conidence intervals using Poisson. A Poisson multiple regression model was developed, in which variables with p<0.20 were included in simple analysis adopting the backward procedure were va-riables with p<0.05 remained in the model. This study was approved by the Ethics Committee of The State University of Cam-pinas (process nº. 369/2000).
Results
Data from 2050 adults (1028 women and 1022 men) was analyzed. Between individu-als sampled, 7.6% of losses occurred due to refusals and individuals not being reached after more than three visits.
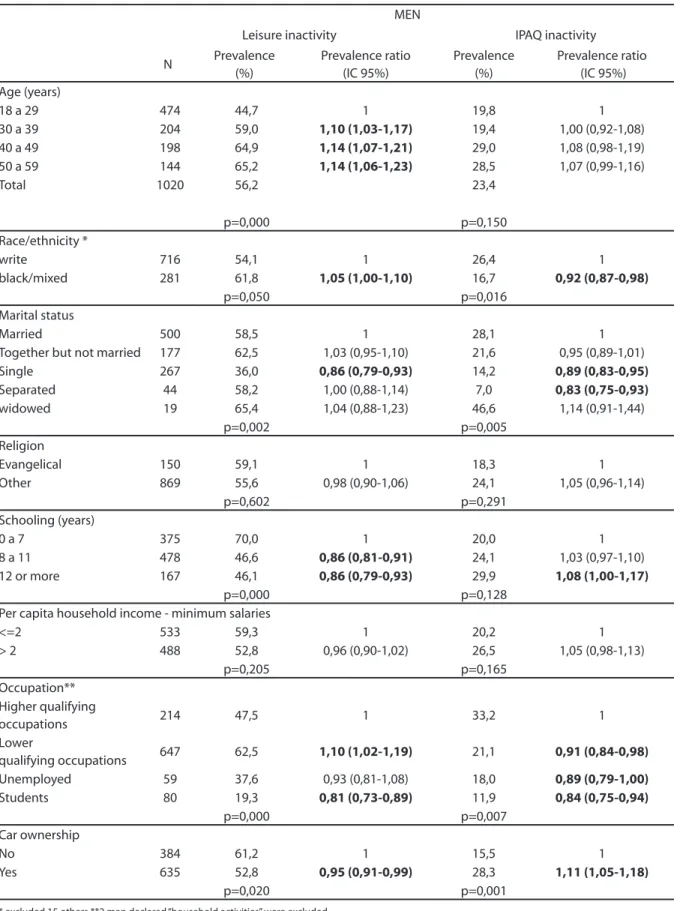
It was found that among men and wo-men respectively, the prevalence of sedenta-ry by IPAQ was 6.8% and 4.4%, insuficiently active 16.6% and 7.3%, active 48.2% and 67.0%, and very active 28.4% and 21.2%. Physical inactivity in leisure time had pre-valence of 65.4% (data not shown in table). Table 1 shows that there were signii-cantly more inactive men in leisure time with 30 years of age or more, with black/ brown color (on the threshold statistical signiicance), married in relation to single, those with lower schooling, those without car in the household and among those with a lower qualiication occupation. Ac-cording to IPAQ, there were more inactive men of white race, with 12 or more years of schooling in relation to those with less than 7 years (on the threshold statistical signiicance), with occupations of higher qualification and whose family owned a car. Single and separated men were shown to have been signiicantly more active than those married.
Table 1 – Prevalence (%) for overall sedentarism and sedentary during leisure, according to demographic and socioeconomic factors in men in areas of the state of São Paulo, Brazil.
MEN
Leisure inactivity IPAQ inactivity
N Prevalence
(%)
Prevalence ratio (IC 95%)
Prevalence (%)
Prevalence ratio (IC 95%) Age (years)
18 a 29 474 44,7 1 19,8 1
30 a 39 204 59,0 1,10 (1,03-1,17) 19,4 1,00 (0,92-1,08)
40 a 49 198 64,9 1,14 (1,07-1,21) 29,0 1,08 (0,98-1,19)
50 a 59 144 65,2 1,14 (1,06-1,23) 28,5 1,07 (0,99-1,16)
Total 1020 56,2 23,4
p=0,000 p=0,150
Race/ethnicity *
write 716 54,1 1 26,4 1
black/mixed 281 61,8 1,05 (1,00-1,10) 16,7 0,92 (0,87-0,98)
p=0,050 p=0,016
Marital status
Married 500 58,5 1 28,1 1
Together but not married 177 62,5 1,03 (0,95-1,10) 21,6 0,95 (0,89-1,01)
Single 267 36,0 0,86 (0,79-0,93) 14,2 0,89 (0,83-0,95)
Separated 44 58,2 1,00 (0,88-1,14) 7,0 0,83 (0,75-0,93)
widowed 19 65,4 1,04 (0,88-1,23) 46,6 1,14 (0,91-1,44)
p=0,002 p=0,005
Religion
Evangelical 150 59,1 1 18,3 1
Other 869 55,6 0,98 (0,90-1,06) 24,1 1,05 (0,96-1,14)
p=0,602 p=0,291
Schooling (years)
0 a 7 375 70,0 1 20,0 1
8 a 11 478 46,6 0,86 (0,81-0,91) 24,1 1,03 (0,97-1,10)
12 or more 167 46,1 0,86 (0,79-0,93) 29,9 1,08 (1,00-1,17)
p=0,000 p=0,128
Per capita household income - minimum salaries
<=2 533 59,3 1 20,2 1
> 2 488 52,8 0,96 (0,90-1,02) 26,5 1,05 (0,98-1,13)
p=0,205 p=0,165
Occupation** Higher qualifying
occupations 214 47,5 1 33,2 1
Lower
qualifying occupations 647 62,5 1,10 (1,02-1,19) 21,1 0,91 (0,84-0,98)
Unemployed 59 37,6 0,93 (0,81-1,08) 18,0 0,89 (0,79-1,00)
Students 80 19,3 0,81 (0,73-0,89) 11,9 0,84 (0,75-0,94)
p=0,000 p=0,007
Car ownership
No 384 61,2 1 15,5 1
Yes 635 52,8 0,95 (0,91-0,99) 28,3 1,11 (1,05-1,18)
p=0,020 p=0,001
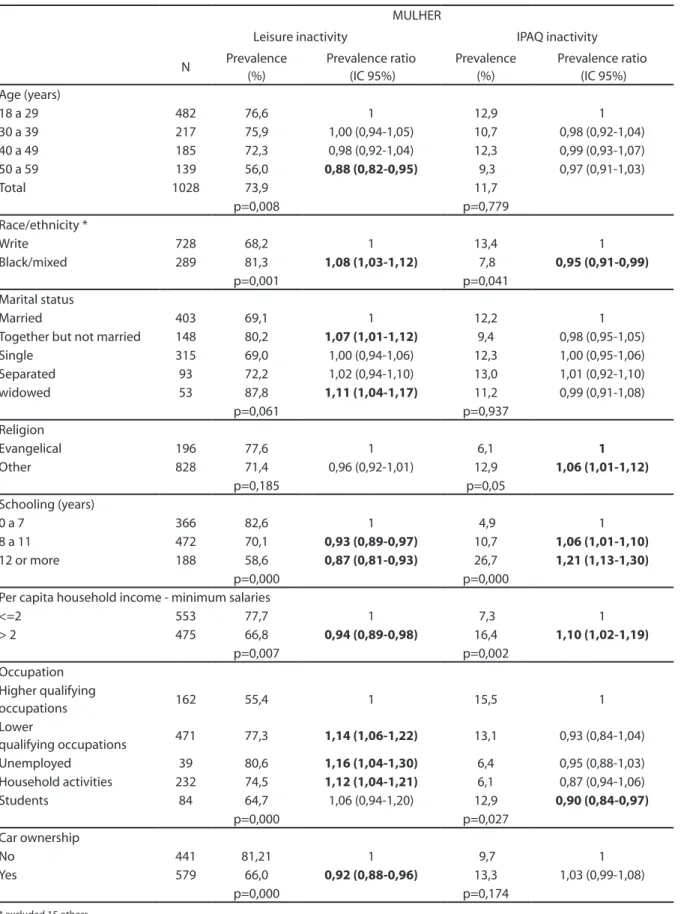
widows woman in relation to married, those with less than eight years of schooling, and those with per capita income equal or less than two Brazilian minimum salary, with occupations of lower qualiication, unem-ployed and house workers (in relation to those with the highest occupations), and those without a car. There was greater phy-sical inactivity according to IPAQ among white women with higher levels of schoo-ling and income, and lower prevalence of inactive women in Evangelical religion, and among those were only students in relation to those in the highest occupations.
In table 3 are presented the prevalence ratios of variables that persisted in the Poisson multiple regression model. Among men, the higher prevalences of inactive at leisure time were found in the categories: 40 years old or more when compared to those who were less than 29 years old, those with less schooling and those with a higher oc-cupation (in relation to that ones that was only students).
Higher prevalence of inactive men according to the IPAQ was observed in married men in relation to those single or separated, those who owned a car, among the ones with highest occupation compared to those that just were students. The inal model for women showed higher physical inactivity at leisure time in those with less than 29 years of age in relation to those more than 50, in widowed women in relation to married, among those with less schooling and with lower qualiication occupations in relation to that ones with highest occu-pations. In the IPAQ inal regression model, the most inactive women were those with more years of schooling, and in leisure time, those occupying jobs with less qualiication in relation to those with occupations with highest qualiication.
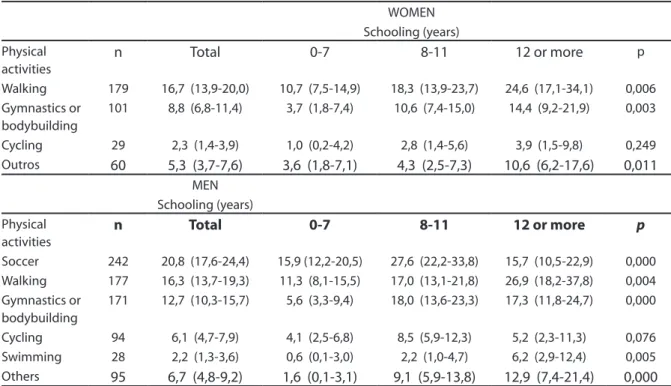
Regarding physical activities in leisure time (table 4), was found that 16.7% of wo-men practiced walking, 8.8% did gymnastics or bodybuilding, and 2.3% were bicycle users. Among men, 20.8% played soccer, 16.3% walked, 12.7% did gymnastics or bodybuilding, 6.1% were bicycle users, and
2.2% practiced swimming. Except cycling, the prevalence of these practices in both sexes increased signiicantly with the years of study. Among men, playing soccer was signiicantly more frequent in those with 8 to 11 years of study.
Discussion
This study detected signiicant social and gender differences in the prevalence of physical inactivity during leisure time and measured by the IPAQ (taking into account all contexts of daily physical activity), and in modalities of exercise and sports practiced by adults between 18-59 years old, from some areas of the state of São Paulo.
The prevalence of physical inactivity assessed by the IPAQ (sedentary + insufi-ciently active), was 17.3%, being 11.7% in women and 23.4% in men. Higher values were observed in telephone survey in all Brazilian capitals – VIGITEL, in this study the prevalence of physical inactivity (lei-sure, transportation, occupational and house work) ranged from 18.7% in Palmas to 32.3% in Natal, with prevalence of 25.6% in São Paulo14. Higher prevalences were detected in household surveys conducted in 15 Brazilian state capitals, this study found that physical inactivity estimated by IPAQ, ranged from 28.2% in Belém to 54.5% in João Pessoa, and 35.4% in São Paulo15. Other studies conducted in Brazil5,9,10 and in other countries3,16 have shown high prevalences of physical inactivity.
Systematic review of physical activity in Brazil at different ages and with different instruments, with a predominance of adults and use of IPAQ, showed a wide variation in the range of physical inactivity17. The existence in IPAQ of questions related to domestic activities with the quotation of examples can contribute in some cultural and social contexts for the overestimation, especially among women9.
Table 2 – Prevalence (%) of overall sedentarism and sedentary during leisure, according to demographic and socioeconomic factors in women in areas of the state of São Paulo, Brazil.
MULHER
Leisure inactivity IPAQ inactivity
N Prevalence (%)
Prevalence ratio (IC 95%)
Prevalence (%)
Prevalence ratio (IC 95%) Age (years)
18 a 29 482 76,6 1 12,9 1
30 a 39 217 75,9 1,00 (0,94-1,05) 10,7 0,98 (0,92-1,04)
40 a 49 185 72,3 0,98 (0,92-1,04) 12,3 0,99 (0,93-1,07)
50 a 59 139 56,0 0,88 (0,82-0,95) 9,3 0,97 (0,91-1,03)
Total 1028 73,9 11,7
p=0,008 p=0,779
Race/ethnicity *
Write 728 68,2 1 13,4 1
Black/mixed 289 81,3 1,08 (1,03-1,12) 7,8 0,95 (0,91-0,99)
p=0,001 p=0,041
Marital status
Married 403 69,1 1 12,2 1
Together but not married 148 80,2 1,07 (1,01-1,12) 9,4 0,98 (0,95-1,05)
Single 315 69,0 1,00 (0,94-1,06) 12,3 1,00 (0,95-1,06)
Separated 93 72,2 1,02 (0,94-1,10) 13,0 1,01 (0,92-1,10)
widowed 53 87,8 1,11 (1,04-1,17) 11,2 0,99 (0,91-1,08)
p=0,061 p=0,937
Religion
Evangelical 196 77,6 1 6,1 1
Other 828 71,4 0,96 (0,92-1,01) 12,9 1,06 (1,01-1,12)
p=0,185 p=0,05
Schooling (years)
0 a 7 366 82,6 1 4,9 1
8 a 11 472 70,1 0,93 (0,89-0,97) 10,7 1,06 (1,01-1,10)
12 or more 188 58,6 0,87 (0,81-0,93) 26,7 1,21 (1,13-1,30)
p=0,000 p=0,000
Per capita household income - minimum salaries
<=2 553 77,7 1 7,3 1
> 2 475 66,8 0,94 (0,89-0,98) 16,4 1,10 (1,02-1,19)
p=0,007 p=0,002
Occupation Higher qualifying
occupations 162 55,4 1 15,5 1
Lower
qualifying occupations 471 77,3 1,14 (1,06-1,22) 13,1 0,93 (0,84-1,04)
Unemployed 39 80,6 1,16 (1,04-1,30) 6,4 0,95 (0,88-1,03)
Household activities 232 74,5 1,12 (1,04-1,21) 6,1 0,87 (0,94-1,06)
Students 84 64,7 1,06 (0,94-1,20) 12,9 0,90 (0,84-0,97)
p=0,000 p=0,027
Car ownership
No 441 81,21 1 9,7 1
Yes 579 66,0 0,92 (0,88-0,96) 13,3 1,03 (0,99-1,08)
p=0,000 p=0,174
conducted at northern and northeastern regions of Brazil (87%, 81.8% in men and 91.8% in women)2 and similar to those observed in population of Peru (61.8%, 55, 5% in men and 67.6% in women), that stu-dy used similar questions about the of the practice exercise of leisure at least once a week. In this survey, only 10% among those who were not sedentary reached the recom-mendations of 150 minutes per week18. One study conducted in Brazilian capital cities showed that São Paulo had the lowest pre-valence of the practice of leisure physical activity for 30 minutes, ive or more days a week (12.1%), being 13.8% in men and
10 6% in women14. Studies which examine physical activity have been using different instruments and deinitions for sedentary behavior at leisure time, turning dificult the comparisons among the results obtai-ned. Systematic review of Brazilian studies found wide range of prevalence of sedentary behavior during leisure time ranging from 55.3% to 96.7%17.
In this study men were more inactive than women according to IPAQ. Similar indings were observed in other studies in the state of São Paulo9,11 and in south and southeast regions of Brazil5. Several studies, however, have detected a greater overall
Table 3 – Poisson multivariate regression model for overall sedentarism and sedentary during leisure in adults in areas of the state of São Paulo, Brazil.
Variable
MEN WOMEN
LEISURE IPAQ LEISURE IPAQ
Prevalence ratio (IC 95%)
Prevalence ratio (IC 95%)
Prevalence ratio (IC 95%)
Prevalence ratio (IC 95%) Age (years)
18 a 29 1 1
30 a 39 1,06 (0,99-1,14) 0,98 (0,93-1,04)
40 a 49 1,10 (1,03-1,18) 0,96 (0,90-1,03)
50 a 59 1,10 (1,01-1,19) 0,85 (0,79-0,92)
Marital status
Married 1 1
Together but not married 0,99 (0,93-1,06) 1,01 (0,96-1,07)
Single 0,92 (0,85-0,97) 0,98 (0,92-1,04)
Separated 0,86 (0,76-0,96) 1,02 (0,94-1,10)
Widowed 1,18 (0,95-1,46) 1,08 (1,01-1,16)
Schooling (years)
0 a 7 1 1 1
8 a 11 0,90 (0,84-0,96) 0,92 (0,88-0,96) 1,06 (1,02-1,10)
12 or more 0,90 (0,83-0,99) 0,90 (0,83-0,98) 1,25 (1,17-1,34)
Occupation Higher qualifying
occupations 1 1 1 1
Lowest qualifying
occupations 1,07 (0,99-1,16) 0,94 (0,88-1,01) 1,09 (1,01-1,17) 1,09 (1,02-1,16) Unemployed 0,94 (0,82-1,09) 0,96 (0,85-1,10) 1,09 (0,97-1,24) 1,00 (0,92-1,10)
Household activities * * 1,08 (0,99-1,17) 1,03 (0,97-1,09)
Students 0,87 (0,78-0,97) 0,88 (0,79-0,98) 1,02 (0,90-1,16) 1,02 (0,93-1,12) Car ownership
No 1
Yes 1,08 (1,02-1,15)
sedentary lifestyle in women15,16,19-22. Physical inactivity in leisure time context was more prevalent among women which has been consistently reported4,8,14,23.
The gender differences can be explained by different social and family roles that men and women in adult age have, inluenced by culture and social organization in which they live. Women are usually responsible for household chores, care giving for children and relatives with limitations, and generally have paid jobs or are dependent on the husband, therefore, they end up having less time available and less opportunities for leisure time activities24.
It was observed that physical inactivity by IPAQ increase with age, which is fre-quently documented in research9,11,15,19-21. Some studies, however, have not been detecting signiicant associations between overall physical inactivity and age14,25. The physical inactivity during leisure time tends to increase with age, as found in other stu-dies in Brazil2,4,7, although this association was not found in adults and elderly in the European Union23. Our study found that
physical inactivity during leisure time was lower among women between 50 and 59 years old compared to the ones that are less than 29 years old, which is consistent with a study conducted in Europe, in which phy-sical activity during leisure time was more prevalent with the increasing of age26 and also with results from VIGITEL14 in which women between 18 to 24 years old were less active during leisure time.
After multiple regression analysis, the finds that black/brown individuals were more inactive during leisure time as well as with the highest inactivity detected by IPAQ in Caucasians lost the statistic signiicance, agreeing with the indings of Dias-da-Costa et al.4 that found no racial differences in leisure time physical inactivity in the adult population of the city of Pelotas and those results of Siqueira et al.5 in a survey conduc-ted with IPAQ in the south and northeast regions of Brazil.
Being active during leisure time was associated to marital status, being more prevalent among single men, even after ad-justing for age, this result is similar to other
Table 4 – Prevalence (%) of sports modalities practiced during leisure, according to schooling in women and men in areas of the state of São Paulo, Brazil.
WOMEN Schooling (years) Physical
activities
n
Total
0-7
8-11
12 or more
pWalking 179 16,7 (13,9-20,0) 10,7 (7,5-14,9) 18,3 (13,9-23,7) 24,6 (17,1-34,1) 0,006 Gymnastics or
bodybuilding
101 8,8 (6,8-11,4) 3,7 (1,8-7,4) 10,6 (7,4-15,0) 14,4 (9,2-21,9) 0,003
Cycling 29 2,3 (1,4-3,9) 1,0 (0,2-4,2) 2,8 (1,4-5,6) 3,9 (1,5-9,8) 0,249 Outros
60
5,3 (3,7-7,6)
3,6 (1,8-7,1)
4,3 (2,5-7,3)
10,6 (6,2-17,6)
0,011
MEN Schooling (years) Physical
activities
n
Total
0-7
8-11
12 or more
p
Soccer 242 20,8 (17,6-24,4) 15,9 (12,2-20,5) 27,6 (22,2-33,8) 15,7 (10,5-22,9) 0,000 Walking 177 16,3 (13,7-19,3) 11,3 (8,1-15,5) 17,0 (13,1-21,8) 26,9 (18,2-37,8) 0,004 Gymnastics or
bodybuilding
171 12,7 (10,3-15,7) 5,6 (3,3-9,4) 18,0 (13,6-23,3) 17,3 (11,8-24,7) 0,000
Brazilian studies4,8. It was also the single men along with separated men, that most engaged in physical activities as measured by IPAQ, similar to the indings of research conducted in 15 countries from the Europe-an Union20. However, study in Portugal not found signiicant differences in relation to marital status and overall physical activity25. The association observed in women between physical activity measured by IPAQ and religious afiliation in the simple analysis, was no longer signiicant in the inal model. It can be partially explained by the fact that the data from this study showed signiicant association between religion and education (p = 0.038), with evangelicals having less years of study.
This study found inequality in physical inactivity during leisure time according to schooling. This inding is in agreement with results from other surveys conducted in Brazil2,4,9,14 and in other countries18,23,25,27. Adults with higher educational levels have greater access to knowledge and also mate-rial living conditions that promote healthy practices and habits.
In physical inactivity as measured by IPAQ, there was a direct association with educational level, which may partly be attributed to the fact that people with less education have higher prevalence of occupational and transportation physical activities. Several Brazilian studies show that overall physical inactivity is more prevalent in individuals with higher education1,5,9,11,22. In a study using IPAQ in 15 Brazilian capitals and in the Federal District, detected in the cities of Rio de Janeiro and Porto Alegre higher prevalences of inactive individuals with lower schooling15. Researches in Eu-ropean countries have found the opposite: in Genova19 and in 15 countries from the European Union20, to be inactive in a general way was more common in individuals of lower socioeconomic status.
The association found between labor occupation and physical inactivity during leisure time in both sexes was also observed in Swiss adults, in whom physical inactivi-ty during leisure time was higher among
workers with low qualification28, as well as in Australian29 and Portuguese25 adults with occupational activities included in the “blue collar” (less qualiied) category. Some studies showed an association between physical activities during leisure time and number of worked hours 18,29, showing that disadvantaged segments of society would have less time or energy for physical activi-ties during leisure time30. Few psychosocial resources and low participation in social groups could also explain the physical inactivity during leisure time in socioeco-nomically disadvantagedadults28. Adults from disadvantaged layers tend to live far-ther from work, living in less secure areas, using public transportation, spending more time with commuting and doing more job overtime, thus having less time for leisure activities29. Improvements in general living conditions and investment in social capital are considered key factors for the decrease in unhealthy behaviors such as physical inactivity28.
Owning a car was associated by IPAQ with physical inactivity in men after adjus-ting for socioeconomic status in the inal model. Car ownership would discourage physical activity as a means of transpor-tation31. Transportation physical activity deserves highlight in healthy promotion policies. Promoting active transportation by walking or bicycling and decreasing the use of a car is important since it can improve not only individual health, but also the health of the planet by reducing the emission of pollutants32.
Among the sports and exercise prac-ticed, it was found that 16.5% of adults practiced walking, a similar prevalence of 15% was observed in a study conducted in Pelotas - RS. Walking is the most prevalent physical activity both in developing and developed countries. Walking is low cost and affordability for the population in general11. In our study, in the higher levels of educa-tion, the prevalence of walking was around 25% in both sexes.
education, agreeing with the findings of other authors18,30, except for cycling in both sexes and soccer in men. Soccer was the most played sport by males reaching a prevalence of 20.9%, agreeing well with the study of Séclen-Palacin and Jacoby18, who also found higher prevalence of soccer practicing in the lower socioeconomic layer. Soccer goes beyond the socioeconomic is-sue by being widespread culturally and by the media in Brazil.
Playing sports is an option that requires speciic equipment and physical spaces, often not accessible to the portion of the population with lower purchasing power30. Regarding the limitations of this study, it points to the fact that the investigation did not bring more detailed information on other inluence factors as socio-envi-ronmental, existence of adequate and safe public spaces close to housing, among others. Also the assessment of physical inac-tivity was done by means of self-reported information, which could overestimate the physical activity as this is a practice conside-red desirable28 as domestic activities among women for example. Being a cross-sectional study, the possibility of reverse causality, not allow observations of cause and effect. It is worth mentioning that individuals who practice physical activity during leisure time only once a week were not considered inac-tive, although they could be insuficiently active (among these, only about 10% did not meet the recommendations for physical activity by IPAQ).
In relation to the beneits of the study, can be cited the fact that our sample covers different areas of the state of São Paulo, using a standardized questionnaire for ove-rall physical activity (IPAQ), since this the most used instrument in Brazil17, and had a sample large enough to stratiication by gen-der and allow that relevant physical
inacti-vity inequalities could be detected. Another quality of the study is to analyze both the activity in overall context and during leisure time, since they have distinct epidemio-logical patterns. Differences between the prevalence in these two contexts, as well as the associated factors, demonstrate the im-portance of its study separately25,27. The high prevalences of physical inactivity found in this and in the studies cited above, show the importance of promoting active lifestyles18. Understanding the associated factors of physical inactivity could contribute to the development of public policies and effecti-ve intereffecti-ventions programs to reduce social inequities29. Given these indings, strategies are needed in public health in order to dis-seminate and encourage physical activity taking into account the differences by sex and socioeconomic factors, and the context in which it can be practiced. Encouraging people to develop and maintain the habit of performing regular physical activity since young ages should be the target to health promotion programs24. Offer more physical spaces and providing physical activities that could be developed in groups are important strategies in reducing physical inactivity28, especially in socially disadvantaged popu-lation subgroups.
References
1 U.S. Department of Health and Human Services.
Physical activity guidelines advisory committee report. Washington, DC: U.S. Department of Health and Human Services, 2008.
2 Monteiro CA, Conde WL, Matsudo SM, Matsudo, VR, Bonseñor IM, Lotufo, PA. A descriptive epidemiology of
leisure-time physical activity in Brazil, 1996-1997. Pan
Am J Public Health 2003; 14:246-54.
3 Shibata A, Oka K, Nakamura Y, Muraoka I Prevalence and demographic correlates of meeting the physical activity recommendation among Japanese adults.
Journal of physical activity & health 2009; 6(1):24-32.
4 Dias-da-Costa JS, Hallal PC, Wells JCK, Daltoé T, Fuchs SC, Meneses AMB et al Epidemiology of leisure-time physical activity: a population-based study in southern
Brazil. Cad Saúde Pública 2005; 21(1):275-82.
5 Siqueira, FV, Facchini, LA, Piccini, RX, Tomasi, E, Thume, E, Silveira, DS, Hallal, PC. Atividade física em adultos e idosos residentes em áreas de abrangência de unidade básicas de saúde de municípios das regiões Sul e
Nordeste do Brasil. Cad Saúde Pública 2008 (24): 39-54.
6 Ferreira, MS, Najar, AL. Programas e campanhas de
promoção da atividade física. Ciências da saúde coletiva
2005; Supl.10: 207-19.
7 Brasil. Ministério da Saúde. Diretrizes e recomendações cuidado integral de doenças crônicas
não-transmissíveis. Promoção da saúde, vigil�ncia, prevenção e assistência. Brasília: Ministério da Saúde, 2008.
8 Pitanga FJG, Lessa I. Prevalência e fatores associados ao
sedentarismo no lazer em adultos. Cad Saúde Pública
2005; 21(3): 870-77.
9 Guimarães VMV, Cesar CLG. Atividade física. In: César
CLG, et al Saúde e condição de vida em São Paulo. Inquérito Multicêntrico de Saúde no Estado de São Paulo. São Paulo: USP/FSP, 2005.
10 Florindo AA, Guimarães VV, Cesar CLG, Barros, MBA, Alves MCGP, Goldbaum M, Carandina L. Epidemiology of leisure, transportation, occupational and household physical activity: prevalence and associated factors. Journal of Physical Activity & Health leisure v. 6, p. 625-632, 2009.
11 Hallal PC, Matsudo SM, Matsudo VKR. Araujo TL, Andrade DR, Bertoldi AD. Physical activity in adults from two Brazilian areas: similarities and differences.
Cad Saúde Pública 2005; 21(2): 573-580.
12 Graff-Iversen S, Anderssen SA, Holme IM, Jenum AK, Raastad T. An adapted version of the long International Physical Activity Questionnaire (IPAQ-L): construct validity in a low-income, multiethnic population study
from Oslo, Norway. Int J Behav Nutr Phys Act 2007 (4):13.
13 Alves MCGP. Plano de amostragem. In: Cesar CLG, Carandina L, Alves MCGP, Barros MBA, Goldbaum M. (Org.). Saúde e condição de vida em São Paulo. Inquérito Multicêntrico de Saúde no Estado de São Paulo. ISA-SP. 1 ed. São Paulo: Faculdade de Saúde Pública, 2005, v. 1, p. 47-62.
14 VIGITEL. Vigitel Brasil 2008 - Vigil�ncia de fatores de risco e proteção para doenças crônicas por inquérito telefônico. Brasília: Ministério da Saúde, 2009.
15 Brasil. Inquérito domiciliar sobre comportamento de
risco e morbidade referida de doenças e agravos não transmissíveis: Brasil, 15 capitais e distrito federal,
2002-2003. Rio de Janeiro: INCA, 2004.
16 Sjostrom M, Oja P, Hagstromer M, Smith B, Bauman A. Health-enhancing physical activity across European
Union countries: the Eurobarometer study. J Public
Health 2006; 14:291-300.
17 Hallal, PC, Dumith, SC, Bastos, JP, Reichert, FF, Siqueira, FV, Azevedo, MR. Evolução da pesquisa epidemiológica em atividade física no Brasil: uma revisão sistemática.
Revista de Saúde Pública / Journal of Public Health 2007;
41: 453-60.
18 Seclen-Palacin, J, Jacoby, E. Factores sociodemográicos y ambientales asociados com actividad física deportiva
em la población urbana del Peru. Rev Panam Salud
Pública 2003 14 (3): 255-264.
19 Bernstein MS, Costanza MC, Morabia A. Physical activity of urban adults: a general population survey in Geneva.
Soz Praventivmed. 2001; 46(1):49-59.
20 Rutten A, Abu-Omar, K. Prevalence of physical activity in
the European Union. Soz Praventivmed 2004(49):281-9.
21 Gomez LF, Duperly J, Lucumi DI, Gamez R, Venegas AS. Physical activity levels in adults living in Bogota
(Colombia): prevalence and associated factors. Gac
Sanit 2005;19(3):206-13.
22 Monteiro CA, Moura EC, Jaime PCet al Surveillance
of risk factors for chronic diseases through telephone
interviews. Rev Saúde Publica 2005; 39 (1):47-57.
23 Varo JJ, Martinez-Gonzalez MA, De Irala-Estevez J, Kearney J, Gibney M, Martinez JA. Distribution and determinants of sedentary lifestyles in the European
Union. Int J Epidemiol 2003; 32(1):138-46.
24 WHO - World Health Organization. Gender, health and aging. WHO, 2003. Disponível em: http://www.who.int/ gender/documents/en/Gender_Ageing.pdf
25 Gal DL, Santos AC, Barros H. Leisure-time versus full-day energy expenditure: a cross-sectional study of
sedentarism in a Portuguese urban population. BMC
26 Bertrais S, Preziosi P, Mennen L, Galan P, Hercberg S, Oppert JM. Sociodemographic and geographic correlates of meeting current recommendations for
physical activity in middle-aged French adults. Am J of
Public Health 2004; 94(9):1560-66.
27 Juraki D, Pedisi Z, Andrijasevi M. Physical Activity of Croatian Population: Cross-sectional Study Using
International Physical Activity Questionnaire. Croat Med
J 2009; 50: 165-73.
28 Lindstrom M, Hanson BS, Ostergren P. Socioeconomic differences in leisure-time physical activity: the role of social participation and social capital in shaping health related behaviour. Social Science & Medicine 2001; 52: 441-451.
29 Burton NW, Turrell G. Occupation, Hours Worked, and
Leisure-Time Physical Activity. Preventive Medicine 2000:
31(6):673-681.
30 Borrell C, Dominguez-Berjón F, Pasarín MI, et al. Social
inequalities in health related behaviors in Barcelona. J Epidemiol Community Health2000; 54:24-30.
31 Ogilvie D, Mitchell R, Mutrie N, Petticrew M, Platt S. Personal and environmental correlates of active travel
and physical activity in a deprived urban population. Int
J Behav Nutr Phys Act. 2008; 5:43.
32 Woodcock J, Banister D, Edwards P, Prentice AM, Roberts
I. Energy and transport. Lancet 2007; 370(9592):1078-88.