ISSN 0104-6632 Printed in Brazil
www.abeq.org.br/bjche
Vol. 30, No. 01, pp. 23 - 31, January - March, 2013
Brazilian Journal
of Chemical
Engineering
DETERMINATION OF LIQUID-LIQUID
EQUILIBRIUM DATA FOR BIODIESEL
CONTAINING TERNARY SYSTEMS USING
NEAR INFRARED TECHNIQUE
S. C. Beneti
1*, W. L. Priamo
2, M. Lanza
3, M. H. Kunita
4, M. A. Mazutti
5,
L. Cardozo Filho
4and J. Vladimir Oliveira
11
Department of Food Engineering, Universidade Regional Integrada do Alto Uruguai e das Missões, URI, Phone: + (55) (54) 35209000, Fax: + (55) (54) 35209090,
Av. Sete de Setembro 1621, CEP: 99700-000, Erechim - RS, Brazil. E-mail: [email protected]
2Instituto Federal de Educação, Ciência e Tecnologia do Rio Grande do Sul, IFRS,
Campus Sertão, Rod. RS 135, Km 25, Sertão - RS, Brazil.
3
Department of Chemical Engineering and Food Engineering, Technological Center, Federal University of Santa Catarina, UFSC, 88040-900, Florianópolis - SC, Brazil.
4
Department of Chemical Engineering, Universidade Estadual de Maringá, Av. Colombo 5790, Maringá - PR, Brazil.
5
Department of Chemical Engineering, Federal University of Santa Maria, Av. Roraima 1000, Santa Maria - RS, Brazil.
(Submitted: January 30, 2012 ; Revised: May 23, 2012 ; Accepted: May 23, 2012)
Abstract - This work is focused on the determination of liquid-liquid equilibrium data for systems containing methyl and ethyl fatty acid esters, water, glycerol and ethanol at temperatures of 303.15 K and 318.15 K using a near-infrared spectroscopy technique (NIR). The NIR method used in this investigation provided quite satisfactory results when compared to conventional analytical techniques and hence can be used as an advantageous tool to quantify the compounds involved in the liquid-liquid equilibrium systems: i) without previous preparation of the samples; ii) with less waste generation; iii) at low cost; and iv) via a non-destructive technique, as sample analyses are made directly, showing good reproducibility and reliability of the data. The NIR method was effective in the use of different temperatures for calibration and validation of the systems under study. Besides, it is shown that extrapolation with the technique may be possible, making LLE predictions feasible for other conditions not used in the calibration procedure.
Keywords: Liquid-liquid equilibrium; Near infrared spectroscopy; Biodiesel; Soybean oil.
INTRODUCTION
Production of biodiesel (methyl or ethyl fatty acid esters - FAME, FAEE) has received growing attention in recent years and accordingly the knowledge of the phase equilibria involved in the separation steps is essential for removing catalyst, excess alcohol, non-reacted oil, glycerol and mainly for the purification
of FAME/FAEE produced.
operating conditions, with optimized amounts of reagents and temperature at which the reaction has been processed, as well as subsequent purification steps. For these reasons, it is relevant to predict the occurrence of one or more liquid phases involved in the reaction and also to be able to estimate the composition of the phases involved (Lanza et al., 2008).
Determination of LLE data is interesting not only for biodiesel production, but also in the extraction and refining process of vegetable oils. After the transesterification reaction for biodiesel production, two phases are usually formed, which can be separated by decantation and/or centrifugation. Currently, the transesterification reaction on a large scale involves the use of vegetable oils and short-chain alcohols (generally, methanol or ethanol) in the presence of a homogeneous base catalyst, leading to production of glycerol and FAME/FAEE. Therefore, the knowledge of the liquid-liquid phase behavior of the compounds involved in biodiesel production is of academic and industrial relevance (Shah et al., 2011, Lanza et al., 2009; Priamo et al., 2009).
The conventional analytical techniques for the determination of the LLE data are time-consuming and require samples preparation. Generally, each compound is determined by a different method, increasing the error propagation. Several quantification techniques (fluorimetry, gravimetry, colorimetry and spectrometry in the infrared range) can be employed for obtaining the total compounds of mixtures. However, the instrumental technique of near infrared spectroscopy coupled with multivariate calibration (in this work, the combined technique is defined as “NIR method”) is as a promising technique, with easy detection and without waste. After the system calibration, measurement of the compounds can be made directly without need of sample preparation (Alishahi et al., 2010).
Near-infrared spectroscopy is an instrumental technique based on the absorption of electromagnetic energy in the region from 780 to 2.500 nm (12000 to 4000 cm-1) (Vannucci et al., 2005). The intensity of the NIR bands depends on the dipole moment and the vibrational frequency of the bond (Blanco and Villarroya, 2002). The use of the NIR technique requires the application of chemometric methods based on statistical and mathematical procedures for the transformation of qualitative data into quantita-tive results for the sample components. A chemometric method widely used for this purpose is calibration by multivariate regression (Valderrama et al., 2007). Silva et al. (2012) have been used infrared spectros-copy to investigate the compounds formed by the transesterification reaction of the beef tallow.
In this context, the aim of this work was to determine liquid-liquid equilibrium data for the systems containing methyl and ethyl fatty acid esters, water, glycerol and ethanol at temperatures of 303.15 K and 318.15 K using NIR technique and evaluate the results by comparison with conventional analytical methods. To the best of our knowledge, the proposed methodology for determining LLE data using near infrared spectroscopy with multivariate calibration has not been reported yet in literature.
MATERIAL AND METHODS
This section is aimed at presenting the analytical techniques used for the development of this work, as well as the methodology employed in the near infrared spectrum in comparison with conventional techniques to quantify the compounds involved in the LLE.
Conventional Analytical Techniques
Determination of solubility curves - binodal: determination of the solubility curve was performed by the cloud point method following the modified
methodology used by Lanza et al. (2008; 2009),
Priamo et al. (2009) and Dalmolin et al. (2009). The solubility curves were used to select the validation and calibration standards for the NIR method. The water content present in the LLE systems was determined by Karl Fisher Titration using an apparatus (DL50 Graphix – Mettler Toledo, Brazil).
The glycerol content was determined following the method described by Cocks and Van Rede (1966). This method consists of the reaction of glycerol in the sample with sodium periodate (NaIO4) in aqueous acid to produce formaldehyde
and formic acid, the latter used as a measure of glycerol. Biodiesel content was determined according to the chromatographic conditions described in European Standard EN 14103 (2001). The amount of anhydrous ethanol in the sample was performed by gravimetry (vacuum oven at 333.15 K).
NIR Technique
The near infrared spectroscopy and multivariate calibration called "NIR method" in this work, as described below, was used for the determination of the components in each phase in equilibrium using a Perkin Elmer spectrometer (Spectrum 100N, FT-NIR Spectrometer).
recovering 64 scans with 4 cm-1 resolution using a quartz cuvette (Agillent HP) with a 2 mm optical path. Before the collect of the samples spectra was carried out a spectrum background (64 scans at 4 cm-1 resolution, with empty cell), to reduce instrument noise.
The calibration of the infrared spectrometer for each system was performed at 318.15 K, however the experiments of LLE were carried out at temperatures of 318.15 and 303.15 K. Determinations of the phase compositions were performed with calibration models generated at 318.15 K, so that it was possible to calculate the phase compositions at lower temperatures without development of a new multivariate calibration. The calibration models were developed by regression using the software PLS_Toolbox® (Partial Least Square), version 5.8 of Eigenvector Research (USA), and Matlab 7.0® (The MathWorks Inc, USA). The number of PLS factors used for model predictions was determined by cross-validation "leave one out". With the models generated it was possible to quantify the components involved in LLE. Several models were generated, and the choice of one of these was decided by the best responses for each tie line system.
Based on triplicate measurements, the average experimental uncertainly varied from 0.04 and 4.42 %.
Choice of Calibrations Standards and Validation
Calibration standards and validation of the systems were chosen very close to the solubility curve. When these are close to the solubility curve, the errors generated in the model are minimized by multivariate calibration. The solubility curve obtained previously was divided into two regions: i) one with high content of solvent named the alcoholic phase (AP) and ii) another one with high content of biodiesel named as the biodiesel phase (BP).
For each phase, 30 experimental points were chosen, totalizing 60 points to calibrate the NIR
equipment, and 20 others points used for multivariate validation (10 points used to validate the alcohol phase and plus 10 used to validate the biodiesel phase). Both calibration and validation points were produced at pre-determined concentrations of the samples, gravimetrically prepared on an analytical balance (with accuracy of ± 0.0001 g).
The different systems investigated in this work exhibited the formation of two phases in the prepared samples at room temperature, so that it was decided to perform the dilution at 1:1 (m/m) with solvent to avoid phase separations. Samples were vigorously stirred with a Teflon-coated magnetic stirring bar to ensure the homogeneity of the mixture.
Tetrahydrofuran (THF Aldrich 99% purity) was used as solvent for the samples. This solvent allows the samples to be solubilized in a single translucent phase and was used in both the calibration and validation steps. For the systems involving glycerol, tert-butanol was used (Merck 99% purity).
Determination of Liquid-Liquid Equilibrium Data
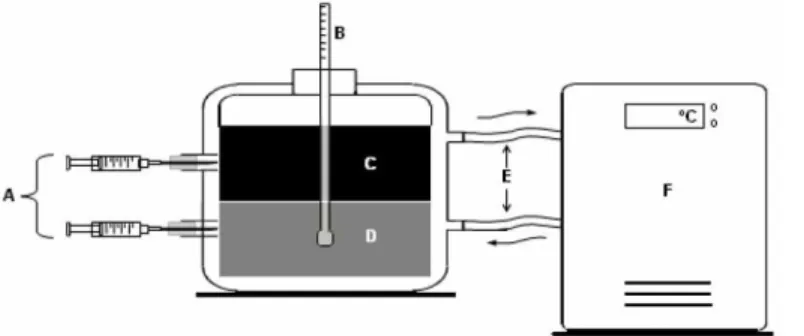
The experimental apparatus used in this study for determining the LLE data was designed based on the proposal of Silva et al. (1997). As schematically shown in Figure 1, the apparatus is based on a set of equilibrium cells (individual volume of approxi-mately 40 mL) with stirring, arranged in series, connected to a thermostatic bath with controlled temperature.
Samples were collected with a syringe that reached the center of each phase of the equilibrium cell. Samples of the biodiesel-rich phase (BP) and alcohol-rich phase (AP) were obtained and diluted 1:1 (m/m) sample to solvent, exactly as was done in the generation of the calibration and validation standards, agitated and placed in the quartz cuvette for reading in the NIR spectrometer. The amount of solvent used was deducted from the LLE and the data were presented on a solvent-free basis.
A. sampling
B. digital thermometer C. biodiesel-rich phase D. alcohol-rich phase E. water circulation
F. thermostatic bath (based on Silva et al., 1997)
Computations of the mass balances were carried out by taking into account the independent mass balance by component and the global mixture composition for both liquid phases and comparing their sums with the real value for total mass used in the experiments. Such calculations make possible the evaluation of the quality and accuracy of the experi-mental results obtained. The procedure was tested according to the procedure developed by Marcilla et al. (1995).
RESULTS AND DISCUSSION
Results of this work using the NIR method are presented below, focusing on the systems: i) ethyl soybean biodiesel + water + anhydrous ethanol and ii) methyl soybean biodiesel + water + glycerol, as well as LLE of each system at different temperatures.
Systems Containing Ethyl Soybean Biodiesel (1) + Water (3) + Anhydrous Ethanol (4) at (318.15 and 303.15 ± 0.2) K
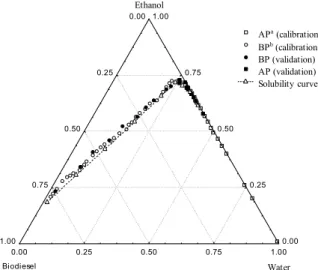
For the system containing ethyl soybean biodiesel (1) + water (3) + anhydrous ethanol (4), the solubility curve was determined at 318.15 K and the calibration and validation standards were chosen for the multivariate calibration of the equipment. The points chosen were always very close to the solubility curve (keeping the miscibility of the compounds) and known compositions were used to validate the NIR
method. Figure 2 shows the solubility curve with the selected calibration and validation standards for the system containing ethyl soybean biodiesel (1) + water (3) + anhydrous ethanol (4) at 318.15 K.
After calibration of the NIR method, the LLE of the system was performed at 318.15 K as shown in Figure 3, along with the solubility curve, and the data compared with the conventional analytical technique.
For this system a good agreement between the two evaluated techniques was noted, and the experimental data of the alcohol and biodiesel phases are close to the solubility curve. Table 1 presents the data on the tie lines for the system containing ethyl soybean biodiesel (1) + water (3) + anhydrous ethanol (4) at 318.15 K. The deviations of the global mass balance for this system, evaluated according to the procedure suggested by Marcilla et al. (1995), are presented in Table 2. By comparing the added mass of the cells with calculated values, the variation in the global mass balance presented a small deviation (lower than 0.1%), hence showing that the models generated by multivariate calibration provided a good representation of the LLE data.
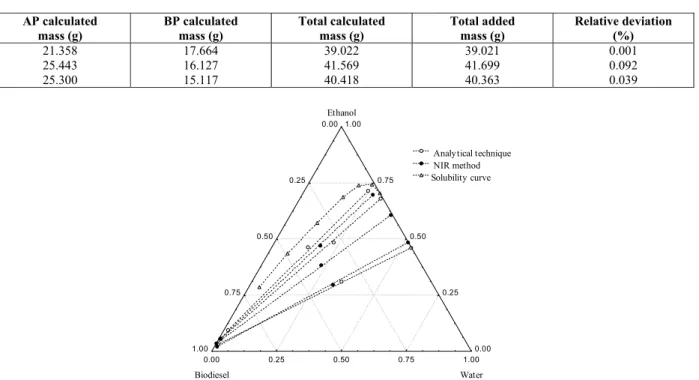
To evaluate the fitting ability of the NIR method, the models generated for the system containing ethyl biodiesel from soybean oil (1) + water (3) + anhydrous ethanol (4) at 318.15 K were used to predict the tie line data at 303.15 K, a temperature condition below the calibration temperature. Figure 4 shows the LLE data for the system at 303.15 K and the comparison with the conventional analytical technique and the respective solubility curve at 303.15 K.
0.00 0.25 0.50 0.75 1.00 Ethanol 0.00
0.25
0.50
0.75
1.00
Bi odi esel
0.00 0.25 0.50 0.75 1.00
Water APa (calibration)
BPb (calibration)
BP (validation) AP (validation) Solubility curve
0.00 0.25 0.50 0.75 1.00 Ethanol 0.00
0.25
0.50
0.75
1.00
Bi odi esel
0.00 0.25 0.50 0.75 1.00
Water NIR method Analytical technique Solubility curve
Figure 2: Selection of calibration and validation standards and solubility curve for the system containing ethyl soybean biodiesel (1) + water (3) + anhydrous ethanol (4) at 318.15 K. aAP is alcoholic phase. b BP is biodiesel phase.
Table 1: LLE data for the system ethyl soybean biodiesel (1) + water (3) + anhydrous ethanol (4) at 318.15 K.
Overall composition Alcoholic phase Biodiesel phase
100·w1 100·w3 100·w4 100·w1 100·w3 100·w4 100·w1 100·w3 100·w4
41.7 30.51 27.79 0.75 53.59 45.66 91.21 2.57 6.22 35.75 21.93 42.32 1.40 34.19 64.41 90.17 1.18 8.65 33.48 19.66 46.86 2.68 30.85 66.47 84.94 1.48 13.58
Table 2: Deviations in the global mass balance of the equilibrium phases for the system ethyl soybean biodiesel (1) + water (3) + anhydrous ethanol (4) at 318.15 K.
AP calculated mass (g)
BP calculated mass (g)
Total calculated mass (g)
Total added mass (g)
Relative deviation (%)
21.358 17.664 39.022 39.021 0.001 25.443 16.127 41.569 41.699 0.092 25.300 15.117 40.418 40.363 0.039
0.00 0.25 0.50 0.75 1.00 Ethanol 0.00
0.25
0.50
0.75
1.00
Biodiesel
0.00 0.25 0.50 0.75 1.00
Water Analytical technique NIR method Solubility curve
Figure 4: LLE data determined by the NIR method and by the conventional method and solubility curve for the system ethyl soybean biodiesel (1) + water (3) + anhydrous ethanol (4) at 303.15 K.
Although the calibration was performed at 318.15 K, one can note from Figure 4 that a very good prediction was possible at 303.15 K when compared with the application of conventional analytical techniques. This result showed that it is possible to calibrate the equipment at a given temperature and make predictions of LLE at another temperature different from the calibration one. LLE data for the system ethyl soybean biodiesel (1) + water (3) + anhydrous ethanol (4) at 303.15 K are tabulated and
presented in Table 3.
Table 4 presents the relative deviations in the mass balance for the system at 303.15 K, using the models generated from calibration at 318.15 K. It can be seen from this table that the relative deviations were slightly higher than those at 318.15 K (but did not exceed 0.5%), demonstrating the reliability of the data and thus confirming the possibility of using a slightly higher temperature for calibration of the system.
Table 3: LLE data for the system ethyl soybean biodiesel (1) + water (3) + anhydrous ethanol (4) at 303.15 K.
Overall composition Alcoholic phase Biodiesel phase
100·w1 100·w3 100·w4 100·w1 100·w3 100·w4 100·w1 100·w3 100·w4
Table 4: Deviations in the global mass balance of the equilibrium phases for the system ethyl soybean biodiesel (1) + water (3) + anhydrous ethanol (4) at 303.15 K.
AP calculated mass (g)
BP calculated mass (g)
Total calculated mass (g)
Total added mass (g)
Relative deviation (%)
24.638 16.037 40.676 40.673 0.002 23.226 15.249 38.476 38.419 0.040 25.675 13.549 39.224 39.358 0.095
Comparing Figures 3 and 4, it can be noted that increasing the system temperature (from 303.15 to 318.15 K) leads to a decrease in the immiscibility region, hence favoring the mutual solubility of biodiesel and ethanol in a considerable composition range of the diagram, which might make biodiesel purification difficult (Oliveira et al., 2011). Moreover, these figures show that ethanol distributes favorably in the aqueous phase, indicating that only a small amount of ethanol and water needed to be removed from the biodiesel phase.
Systems Containing Methyl Soybean Biodiesel (2) + Water (3) + Glycerol (5) at (318.15 and 303.15 ± 0.2) K
The system containing methyl soybean biodiesel was also calibrated and validated by the NIR method. Water and glycerol, which are two challenging compounds to be quantified through the use of conventional analytical techniques in systems involving
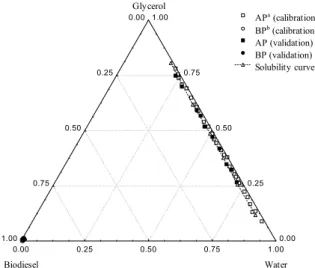
biodiesel, were measured by the NIR method and quantified simply and quickly without prior sample preparation. Figure 5 shows the calibration and validation points for the alcoholic and oil phases, as well as the solubility curve for the temperature of 318.15 K.
After the validation and calibration standards for the system methyl soybean biodiesel (2) + water (3) + glycerol (5) at 318.15 K and the generation of the models, the tie lines were performed at the same temperature and compared with the tie lines obtained by conventional analytical techniques. Figure 6 shows the experimental and correlated liquid-liquid equilibrium values for this system at the same temperature.
It is worth noticing that the NIR method was able to satisfactorily correlate the liquid-liquid equilib-rium data in the phases under study and results from NIR were similar to those of conventional analytical techniques. LLE data are presented in Table 5 while Table 6 presents the relative deviations and mass balance observed.
0.00 0.25 0.50 0.75 1.00 Glycerol 0.00
0.25
0.50
0.75
1.00
Biodiesel
0.00 0.25 0.50 0.75 1.00
Water APa (calibration)
BPb (calibration)
AP (validation) BP (validation) Solubility curve
0.00 0.25 0.50 0.75 1.00 Glycerol 0.00
0.25
0.50
0.75
1.00
Biodiesel
0.00 0.25 0.50 0.75 1.00
Water NIR method Analytical technique Solubility curve
Figure 5: Selection of calibration and validation standards and solubility curve for the system methyl soybean biodiesel (2) + water (3) + glycerol (5) at 318.15 K. bAP alcoholic phase. aBP biodiesel phase.
Table 5: LLE data for the system methyl soybean biodiesel (2) + water (3) + glycerol (5) at 318.15 K.
Overall composition Alcoholic phase Biodiesel phase
100·w2 100·w3 100·w5 100·w2 100·w3 100·w5 100·w2 100·w3 100·w5
23.66 25.99 50.348 1.09 34.15 64.76 99.11 0.37 0.52
33.76 32.045 34.20 1.58 47.55 50.86 98.05 0.67 1.28
48.37 45.81 5.81 1.74 87.62 10.64 99.31 0.48 0.20
Table 6: Deviations in the global mass balance of the equilibrium phases for the system methyl soybean biodiesel (2) + water (3) + glycerol (5) at 318.15 K.
AP calculated mass (g)
BP calculated mass (g)
Total calculated mass (g)
Total added mass (g)
Relative deviation (%)
30.378 9.057 39.435 39.353 0.208 26.463 13.247 39.710 39.713 0.009 20.777 19.084 39.861 39.921 0.150
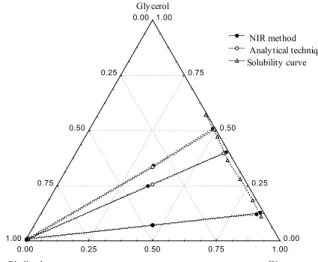
Using the multivariate calibration for this system at 318.15 K it was possible to perform LLE estimations at 303.15 K without the need of a new calibration. Figure 7 shows the LLE data solubility curve at 303.15 K from the conventional analytical techniques and the NIR method for this system. FAME from soybean oil is practically insoluble in water and in glycerol and, because of the very low content of these compounds in biodiesel, the possibility of errors increases. The biodiesel phase can be quantified as biodiesel by the NIR method, without the need to quantify the other compounds involved. In relation to ethyl biodiesel from soybean oil (1) + water (3) + ethanol (4), this system showed
a slightly lower deviation than the system involving methyl biodiesel from soybean oil (2). An increase in temperature for this system causes an increase in the mutual solubility of water and glycerol, which may be interesting for biodiesel purification purposes, because the water could be used to remove the glycerol after biodiesel production, increasing the biodiesel purification.
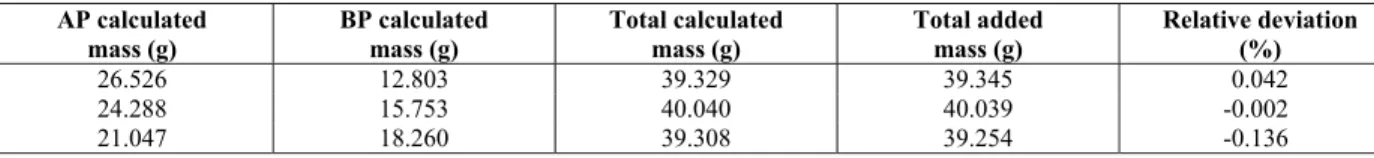
LLE data for the system containing methyl soybean biodiesel, water and glycerol at 303.15 K are presented in Table 7 while Table 8 shows the relative deviations to the overall mass balance for LLE. The mass balance shows that the deviations did not exceed 0.5%.
0.00 0.25 0.50 0.75 1.00 Gly cerol 0.00
0.25
0.50
0.75
1.00
Biodiesel
0.00 0.25 0.50 0.75 1.00
Water NIR method Analytical technique Solubility curve
Figure 7: LLE data determined by NIR and by the conventional method for the system containing methyl soybean biodiesel (2) + water (3) + glycerol (5) at 303.15 K.
Table 7: LLE data for the system methyl soybean biodiesel (2) + water (3) + glycerol (5) at 303.15 K.
Overall composition Alcoholic phase Biodiesel phase
100·w
2 100·w3 100·w5 100·w2 100·w3 100·w5 100·w2 100·w3 100·w5
Table 8: Deviations in the global mass balance of the equilibrium phases for the system methyl soybean biodiesel (2) + water (3) + glycerol (5) at 303.15 K.
AP calculated mass (g)
BP calculated mass (g)
Total calculated mass (g)
Total added mass (g)
Relative deviation (%)
26.526 12.803 39.329 39.345 0.042 24.288 15.753 40.040 40.039 -0.002 21.047 18.260 39.308 39.254 -0.136
Inspection of Figures 6 and 7 shows that there are no significant differences in the miscibility region extension of this ternary system in the temperature range investigated. The wide immiscibility region probably occurs due to the presence of long unsaturated ester chains, that form the biodiesel, and their non-polarity, which does not favor their solubility in water and glycerol. Phase behavior of glycerol-containing systems is generally similar to that of water-containing systems as descried by Lee et al. (2010).
CONCLUSIONS
The NIR method used in this study provided quite satisfactory results when compared to the conventional analytical techniques and hence can be used as a tool to determine the composition of the compounds involved in the liquid-liquid equilibrium systems related to soybean biodiesel production. The advantages comprise a reliable, non-destructive, fast and low-cost technique, no need for previous sample preparation and minimum waste. It was shown that the NIR method was effective with the use of different temperatures for calibration and validation of the systems under study, which makes possible material savings, thereby generating less waste and time needed to perform the analysis. The technique developed in this work may be relevant for those committed to improving separation and purification processes in the biodiesel industry in a friendly environment.
ACKNOWLEDGMENTS
The authors thank CNPq and CAPES for the financial support and scholarships.
REFERENCES
Alishahi, A., Farahmand, H., Prieto, N., Cozzolino, D., Identification of transgenic foods using NIR
spectroscopy: A review. Spectrochimica Acta Part A, 75, 1-7 (2010).
Blanco, M., Villarroya, I., NIR spectroscopy: A rapid- response analytical tool. Trends in Analytical Chemistry, 21, 240-250 (2002).
Cocks, L. V., van Rede, C., Laboratory Handbook for Oil and Fat Analysis. Academic Press, London, (1966).
Dalmolin, I., Lanza, M., Meirelles, A. J. A., Batista, E. A. C., Liquid-liquid equilibrium data for systems containing refined rice bran oil, anhydrous ethanol, water, and hexane. Journal of Chemical & Engineering Data, 54, 2182-2188 (2009). Lanza, M., Borges, W. N., Batista, E., Poppi, R. J.,
Meirelles, A., Liquid–liquid equilibrium data for reactional systems of ethanolysis at 298.3 K. Journal of Chemical & Engineering Data, 53, 5-15 (2008).
Lanza, M., Sanaiotti, G., Batista, E. A. C., Poppi, R., Meirelles, A. J. A., Liquid-liquid equilibrium data for systems containing vegetable oils, anhydrous ethanol, and hexane at (313.15, 318.15, and 328.15) K. Journal of Chemical & Engineering Data, 54, 1850-1859 (2009).
Lee, M. J., Lo, Y. C., Lin, H. M., Liquid–liquid equilibria for mixtures containing water, methanol, fatty acid methyl esters, and glycerol. Fluid Phase Equilibria, 299, 180-190 (2010).
Marcilla, A., Ruiz, F., García, A. N., Liquid-liquid-solid equilibria of the quaternary system water-ethanol-acetone-sodium chloride at 25 °C. Fluid Phase Equilibria, 112, 73-289 (1995).
Oliveira, M. B., Barbedo, S., Soletti, J. I., Carvalho, S. H. V., Queimada A. J., Coutinho, J. A. P., Liquid–liquid equilibria for the canola oil biodiesel + ethanol + glycerol system. Fuel, 90, 2738-2745 (2011).
Priamo, W. L., Lanza, M., Meirelles, A. J. A., Batista, E. A. C., Liquid-liquid equilibrium data for fatty systems containing refined rice bran oil, oleic acid, anhydrous ethanol, and hexane. Journal of Chemical & Engineering Data, 54, 2174-2181 (2009).
quantum chemical calculations using the Cosmo-SAC method. Industrial & Engineering Chemistry Research, 50, 13066-13075 (2011).
Silva, L. H. M., Coimbra, J. S. R., Meirelles, A. J. A., Equilibrium phase behavior of poly(ethylene glycol) + potassium phosphate + water two-phase systems at various pH and temperatures. Journal of Chemical & Engineering Data, 42, 98-401 (1997). Silva, G. A. M., Da Rós, P. C. M., Souza, L. T. A., Costa, A. P. O., de Castro, H. F., Physico-chemical, spectroscopical and thermal characterization of biodiesel obtained by enzymatic route as a tool to select the most efficient immobilized lipase. Brazilian Jounal of Chemical Engineering 29, 39-47 (2012).
Standard UNE-EN 14103, Fat and oil oil derivatives: Fatty Acid Methyl esters (FAME) – Determination of ester and linolenic acid methyl ester contents. Asociación Española de Normalización y Certifi-cación, Madrid (2001).
Vannucci, M., Sha, N., Brown, P. J., NIR and mass spectra classification: Bayesian methods for wavelet-based feature selection. Chemometrics and Intelligent Laboratory Systems, 77, 139-148 (2005).