248
Rev. Bras. Gest. Neg. São Paulo v.20 n.2 apr-jun. 2018 p.248-272
REVISTA BRASILEIRA DE GESTÃO DE NEGÓCIOS ISSN 1806-4892
REVIEw Of BuSINESS MANAGEMENT e-ISSN 1983-0807 © FECAP
RBGN
Review of Business Management
DOI: 10.7819/rbgn.v20i2.3049
248
Received on 07/18/2016 Approved on 09/06/2017
Responsible editor: Prof. Dr. Eduardo Contani
Evaluation process:
Double Blind Review
Psychological Barriers in Single Stock Prices:
Evidence from Three Emerging Markets
Júlio Lobão
11University of Porto, School of Economics and Management,
Research Centre for the Study of Population, Economics and Society, Porto, Portugal
João Fernandes
22University of Porto, School of Economics and Management, Porto, Portugal
Abstract
Purpose– The purpose of the study is to examine the prices of some of the most widely traded stocks from Taiwan,Brazil and South Africa for indications of psychological barriers at round numbers.
Design/methodology/approach – The sample under study includes
a group of 24 stocks (8 for each one the emerging markets) during the period 2000-2014. We test for uniformity in the trailing digits of the stock prices and use regression and GARCH analysis to assess the differential impact of being above or below a possible barrier.
Findings– We found no consistent psychological barriers in individual stock prices near round numbers. Moreover, we document that the relationship between risk and return tends to be weaker in the proximity of round numbers for about half of the stocks under study.
Originality/value– This is the first study to examine the prices of single stocks from emerging markets for indications of psychological barriers at round numbers. Our results advocate special reflection regarding trading strategies linked to support and resistance levels in stock prices.
Keywords – psychological barriers; M-values; market psychology;
249 Rev. Bras. Gest. Neg. São Paulo v.20 n.2 apr-jun. 2018 p.248-272
Psychological Barriers in Single Stock Prices: Evidence from Three Emerging Markets
1
Introduction
Market practitioners and journalists often refer to the existence of psychological barriers in stock markets. Many investors believe that round numbers serve as barriers and that prices may resist crossing these barriers. Moreover, the use of technical analysis is based on the assertion that traders will “jump on the bandwagon” of buying (selling) once a stock price breaks upward (downward) through a “psychologically important” level, thus suggesting that crossing one of these barriers may push prices up (down) more than otherwise warranted. Phrases frequently used by the business press, such as “support level” and “resistance level”, imply that until such time as an important barrier is broken, increases and decreases in stock prices may be restrained.
The impact of these kinds of psychological barriers on investors’ decisions has been studied since the 1990’s for a variety of asset classes, from exchange rates with Grauwe and Decupere (1992) to stock options with Jang, Kim, Kim, Lee and Shin (2015). So far, evidence suggests some significant impacts of this phenomenon on the returns and variances of several securities.
Research on psychological barriers in stock markets has mainly been focused on stock indices from different geographies and periods. However, the existing evidence regarding psychological barriers in single stock prices is scant. Dorfleitner and Klein (2009) consider this gap in the literature to be ‘astonishing’, as real stocks can be and are traded directly on stock exchanges whereas stock indices are not immediately traded but instead reflect index futures and other related derivatives.
This study addresses this gap by examining the existence of psychological barriers at round numbers in individual stock prices. Based on a number of different methodologies, our study is the first to our knowledge to thoroughly examine this anomaly in single stock prices from three of the most important emerging markets. We scrutinize a sample of stocks from the TAIEX (Taiwan), the BOVESPA (Brazil) and the FTSE JSE All Share (South Africa) from 2000 to 2014.
The anchoring effect, a well-known behavioral bias firstly identified by Tversky and Kahneman (1974), is the main explanation for the existence of psychological barriers in financial markets. When performing an estimation in an ambiguous situation, individuals tend to fixate (‘to anchor’) on a salient number even if that number is irrelevant for the estimation. Anchoring on round numbers is important due to its great explanatory power regarding some of the features commonly associated with financial markets. It may help to understand, for example, excessive price volatility (Westerhoff, 2003), the momentum effect (George & Hwang, 2004), or even the emergence of speculative bubbles (Shiller, 2015).
Of course, behavioral biases are not the only reason why barriers can exist. For example, the fact that option exercise prices are usually round numbers may be an additional explanation for the phenomenon.
In spite of several studies on psychological barriers in different asset classes, there is still a lack of empirical evidence regarding this phenomenon in individual stock prices. Before now, only Cai, Cai and Keasey (2007) and Dorfleitner and Klein (2009) had examined individual stocks, considering Chinese stocks and German stocks, respectively.
The existence of psychological barriers contradicts the efficient market hypothesis as it points to predictability in stock prices and may thus lead to abnormal risk-adjusted returns. Hence, empirical evidence for the existence of psychological barriers represents a contribution to the literature on market anomalies.
250
Rev. Bras. Gest. Neg. São Paulo v.20 n.2 apr-jun. 2018 p.248-272
Júlio Lobão / João Fernandes
strategy could have been built based on this potential anomaly. Moreover, we show that the relationship between risk and return tends to be weaker in the proximity of round numbers for about half of the stocks under study.
This paper is organized as follows. Section 2 reviews the empirical evidence regarding psychological barriers. Section 3 presents the data and methodologies used in this paper. Section 4 presents the empirical results. Section 5 offers conclusions.
2
Previous Findings
Donaldson (1990a, 1990b) and Grauwe and Decupere (1992) were the first to study the phenomenon of psychological barriers and showed that round numbers are indeed of special importance for investors in the stock and in the foreign exchange markets, respectively. Since then, several other studies have followed, focusing not only on different geographies and periods, but also on different asset classes, such as bonds, commodities and derivatives.
However, to the best of our knowledge, only Cai et al. (2007) and Dorfleitner and Klein (2009) have thus far addressed the presence of psychological barriers in single stock prices.
Cai et al. (2007) assessed the existence of psychological barriers in a total of 1050 A-shares and 100 B-shares from both the Shanghai Stock Exchange and the Shenzhen Stock Exchange during June 2002. A range of measures for price resistance showed the digits 0 and 5 to be significant resistance points in the A-share market. A weak resistance point, the digit 0, was found for the Shenzhen B-share market. No resistance point was found in the Shanghai B-share market, although the digit 0 had the highest level of resistance compared to others. These results were attributed to cultural factors.
Dorfleitner and Klein (2009) analysed eight major stocks from the German DAX 30 over the period May 1996-June 2003. The prices were examined with respect to the frequency with which they lied within a certain band around the barriers
and also with respect to certain characteristics and volumes. In addition, they studied the barriers’ influence on intraday variances and daily trading volumes. The main conclusion was that the eight stocks behaved very differently around possible psychological barriers. The strongest evidence of the existence of psychological barriers was found in the Commerzbank stock for both barriers that were considered. Some evidence was also detected of barriers in the Henkel stock and weak evidence was detected in another three stocks. Overall, the authors were not able to identify any systematic and consistent pattern at the barriers.
Since there are only two empirical studies about psychological barriers in individual stocks, it is difficult to extract general conclusions from the existing evidence.
Our approach is closer to the one adopted by Dorfleitner and Klein (2009) in the sense that we examine a more limited group of stocks than Cai et al. (2007) but consider a much longer sample period than these authors.
Other studies concerning psychological barriers in stock markets are also related to our analysis. This is the case of those articles that consider stock indices. In fact, to date, stock indices have been the target of most research concerning psychological barriers. Donaldson (1990a, 1990b) used both chi-squared tests and regression analysis to test for uniformity in the trailing digits of the Dow Jones Industrial Average (DJIA), the FTSE- 100, the TSE and the Nikkei 225. His findings rejected uniformity for all but the Nikkei index.
Donaldson and Kim (1993) examined the DJIA for the period 1974-1990 using a Monte Carlo experiment and found evidence confirming round numbers (100-levels) as support and resistance levels. Furthermore, they concluded that once such levels were crossed, the DJIA moved up or down more than usual in what they called a “bandwagon effect”. The same was not true for the less important Wilshire 5000.
251 Rev. Bras. Gest. Neg. São Paulo v.20 n.2 apr-jun. 2018 p.248-272
Psychological Barriers in Single Stock Prices: Evidence from Three Emerging Markets
fewer observations around 100-levels. In 98.4% of the cases tested, uniformity in the trailing digits was rejected at the 95% significance level. Additionally, they emphasized that the non-uniform distribution of the final digits was not necessarily synonymous with price barriers and found no evidence of stock price predictability due to these barriers.
Koedijk and Stork (1994) expanded the research to a number of indices. The authors studied the existence of psychological barriers in the Brussels Stock Index (Belgium), in the FAZ General (Germany), in the Nikkei 225 (Japan) and in the S&P 500 (U.S.) during the period from January 1980 to February 1992, while the FTSE-100 (U.K.) was observed from January 1984 to February 1992. They discovered significant indications of the existence of psychological barriers in the FAZ General, the FTSE-100 and the S&P 500, but weak indications in the Brussels Index, and none for the Nikkei 225. As in Ley and Varian (1994), they failed to find evidence supporting the significance of 100-levels in predicting returns. However, this may be due in part to the fact that they did not disaggregate the effects of upward and downward movements through barriers.
Ceuster, Dhaene and Schatteman (1998) compared the last digits of the DJIA, FTSE-100, or the Nikkei 225 with the empirical distribution of a Monte Carlo simulation. They did not find any indication of the existence of psychological barriers in those three indices.
Cyree, Domian, Louton and Yobaccio (1999) showed that the last two digits of the DJIA, the S&P 500, the Financial Times U.K. Actuaries (London) and the DAX are not equally distributed. Prices next to barriers turn up less frequently than prices in a more distant position. The TSE 300, CAC 40, Hang Seng and Nikkei 225 exhibit some significant evidence. They also analysed the distribution of the returns with regard to expected returns and volatility in a modified GARCH model to conclude that upward movements through barriers tended
to have a consistently positive impact on the conditional mean return and also that conditional variance tendedto be higher in pre-crossing sub periods and lower in post-crossing sub periods.
More recently, Bahng (2003) applied the methodology of Donaldson and Kim (1993) to analyse seven major Asian indices including ones from South Korea, Taiwan, Hong Kong, Thailand, Malaysia, Singapore and Indonesia between 1990 and 1999. Their analysis showed that the Taiwanese index did have price barrier effects and that the price level distributions of the Taiwanese, Indonesian and Hong Kong indices were explained by quadratic functions.
Dorfleitner and Klein (2009) focused on the DAX 30, the CAC 40, the FTSE-50 and the Euro-zone-related DJ EURO STOXX 50 for different periods until 2003. They found fragile traces of psychological barriers in all indices at the 1000-level. There were also indications of barriers at the 100-level except in the CAC index.
The literature on psychological barriers in stock indices continues to be active today. For example, Shawn and Kalaichelvan (2012) examined five European indices (FTSE-100, CAC 40, DAX 30, ATX and SMI) in a 10-year period from January 2001 to December 2011. They found evidence of barriers in the SMI at the 1000-level but no significant evidence of barriers in the other indices.
Woodhouse, Singh, Bhattacharya and Kumar (2016) investigated the existence of barriers in the NASDAQ Composite index over a 41-year period from 1971 to 2012. Statistically significant barrier effects were detected at certain index levels (usually at multiples of 100). The authors emphasize the importance of finding significant barriers in a stock market that would normally be considered very efficient in informational terms. Moreover, Woodhouse et al. (2016) attribute the presence of barriers to behavioral factors.
252
Rev. Bras. Gest. Neg. São Paulo v.20 n.2 apr-jun. 2018 p.248-272
Júlio Lobão / João Fernandes
2013. No evidence was detected of psychological barriers in the Italian market but there was a strong indication of barriers in the Greek stock market and weak evidence of barriers in the Iberian stock markets.
Different studies have concluded that price barriers or at least significant deviations from uniformity also exist in other asset classes such as exchange rates (Grauwe & Decupere, 1992; Mitchell & Izan, 2006), bonds (Burke, 2001), commodities (Aggarwal & Lucey, 2007; Lucey & O’Connor, 2016) and derivatives (Chen & Tai, 2011; Dowling, Cummins, & Lucey, 2016; Jang et al., 2015; Schwartz, Van Ness, & Van Ness, 2004). Overall, the evidence of price barriers in various asset classes seems to be fairly robust.
3
Data and Methodology
3.1
Data
In this study we examine the existence of psychological barriers in the prices of a group of individual stocks belonging to each one of the following three stock indices: the TAIEX (Taiwan), the BOVESPA (Brazil) and the FTSE JSE All Share (South Africa). The markets to analyse were chosen according to the weights of each country in the MSCI Emerging Markets
Index. As of November 2014, the countries with the highest weights were China, Taiwan and South Korea. However, as Chinese stocks had been already studied in relation to this topic (see Cai et al., 2007) and South Korea is culturally and geographically very close to Taiwan, Brazil and South Africa (the fourth and fifth most weighted national markets, respectively) replaced the first two abovementioned countries.
253 Rev. Bras. Gest. Neg. São Paulo v.20 n.2 apr-jun. 2018 p.248-272
Psychological Barriers in Single Stock Prices: Evidence from Three Emerging Markets
Table 1
Summary statistics on stock price data series
Country Stock
Index Company
Return series Level series Mean SD Skewness Kurtosis Minimum
Price
Maximum Price
Taiwan TAIEX
Chinatrust Financial
Holding -0.000317 0.030805 -13.808229 518.885039 3.50 41.90 Chin-Poon Industrial -0.000115 0.026045 -1.9949 35.750792 12.65 69.50 Chung Hwa Pulp -0.000109 0.024756 -1.673726 32.317514 5.90 37.30 Kerry TJ Logistics 0.000323 0.026254 0.060959 1.260051 4.70 31.80 King’s Town Bank 0.000195 0.028839 -2.820349 63.815137 2.82 32.70 Shihlin Electric &
Engineering -0.000064 0.029982 -14.384963 558.384085 4.65 40.50 Taiwan Fertilizer -0.000494 0.050485 -37.402754 1968.23058 2.22 48.40 Ton Yi Industrial 0.000182 0.029621 17.480666 713.107338 3.69 27.95 Wei Chuan Foods 0.000007 0.023178 0.335319 3.546742 4.64 18.20 Yuen Foong Yu Paper
Manufacturing 0.000345 0.029436 13.336126 495.189697 6.70 77.50
Brazil BOVESPA
Bradesco 0.000232 0.049384 20.703822 1237.04217 7.65 203.20 Eletrobras -0.00049 0.031003 -2.790172 58.800639 4.41 59.88 Metalurgica Gerdau -0.000522 0.034531 -9.23499 179.106093 9.68 116.60
Vale -0.000244 0.032211 -14.942904 442.003684 16.00 159.89
South
Africa FTSE JSE All Share
Arcelormittal 0.000032 0.040008 -20.404694 885.438385 5.90 261.00 Business
Connexion Group -0.000487 0.030911 -17.55071 588.307265 3.05 55.50 Firstrand 0.000447 0.019407 -0.016888 2.492593 9.80 229.00 MTN Group 0.00057 0.024234 0.240566 4.604589 6.11 51.00
Netcare 0.000956 0.018686 0.202933 3.121805 8.30 260.10 Richemont Securities -0.000095 0.042397 -41.591147 2248.34992 0.73 37.95
Sabmiller 0.00058 0.016012 0.13616 2.807637 41.00 668.91 Sanlam 0.000536 0.017986 0.114349 2.724185 5.85 73.20 Standard Banking Group 0.000441 0.018474 0.176634 2.471849 21.30 149.30
Woolworths Holding -0.000317 0.030805 -13.808229 518.885039 2.65 83.75
3.2
Methodology
3.2.1
Definition of barriers
Following Brock, Lakonishok and LeBaron (1992) and Dorfleitner and Klein (2009), we will use the so-called band technique and barriers will
thus be defined as a certain range around the actual barrier. The main reason is that market participants will most certainly become active at a certain level before the price touches a round price
level. Considering a price of €100, for instance, over-excitement is expected to begin at €99 or €101, or even at €95 or €105. Barriers will thus be defined as multiples of the lth power of ten, with
254
Rev. Bras. Gest. Neg. São Paulo v.20 n.2 apr-jun. 2018 p.248-272
Júlio Lobão / João Fernandes
Barrier level l=2 (100s) 95-05; 90-10; 75-25
Barrier level l=1 (10s) 9.5-0.5; 9.0-1.0; 7.5-2.5 Barrier level l=0 (1s). 0.95-0.05; 0.90-0.10; 0.75-0.25
For each stock, we select different barrier levels to examine for possible psychological barriers. Naturally, the tick size of each market will correspond to the lower boundary in terms of barrier levels.
3.2.2
M-values
M-values refer to the last digits in the
integer portion of prices in the analysed security. Initially used by Donaldson and Kim (1993),
M-values considered potential barriers at the levels
…, 300, 400, …, 3400, 3500, i.e. at:
k x 100,k=1,2,… (3.5)
Later, Ceuster et al. (1998) claimed that this definition was too narrow because the series was not multiplicatively regenerative, resulting, for instance, in 3400 being considered a barrier, whereas 340 would not be. Additionally, the authors claimed that, as defined by Eq. (3.1), the gap between barriers would tend to zero as the price series increased, disrupting the intuitive appeal of a psychological barrier. Thus, one should also consider the possibility of barriers at the levels …, 10, 20, …, 100, 200, …, 1000, 2000, …, i.e. at:
k x 10l,k=1,2,…,9; l= ...,-1,0,1,…; (3.6)
and, on the other hand, at the levels …, 10, 11, …, 100, 110, …, 1000, 1100, …, i.e. at:
k x 10l,k=10,11,…,99; l= ...,-1,0,1,…;
M-values would then be defined according
to these barriers. For barriers at the levels defined in Eq. (2.1a), the M-values would be the pair of
digits preceding the decimal point:
e, por outro lado, nos níveis …, 10, 11, …, 100, 110, …, 1000, 1100, …, ou seja, em:
(3.7)
where Pt is the integer part of Pt and mod 100
refers to the reduction module 100. For barriers at the levels defined by Eq. (3.2) and Eq. (3.3), the M-values would be defined respectively as
the second and third and the third and fourth significant digits. Formally,
e, por outro lado, nos níveis …, 10, 11, …, 100, 110, …, 1000, 1100, …, ou seja, em:
(3.5 e 3.6)
where logarithms are to base 10. In practical terms, if Pt = 1234.56, then
e, por outro lado, nos níveis …, 10, 11, …, 100, 110, …, 1000, 1100, …, ou seja, em:
= 34. At this level, barriers should appear when
e, por outro lado, nos níveis …, 10, 11, …, 100, 110, …, 1000, 1100, …, ou seja, em:
= 00. Additionally,
e, por outro lado, nos níveis …, 10, 11, …, 100, 110, …, 1000, 1100, …, ou seja, em:
= 23 and
e, por outro lado, nos níveis …, 10, 11, …, 100, 110, …, 1000, 1100, …, ou seja, em:
= 12.
3.2.3
Uniformity test
Having computed the M-values, the next
step consists of examining the uniformity of their distribution. Following Aggarwal and Lucey (2007), this will be done through a Kolmogrov-Smirnov Z-statistic test. Thus, we will be testing H0: uniformity of the M-value distribution against H1: non-uniformity of the M-value distribution.
255 Rev. Bras. Gest. Neg. São Paulo v.20 n.2 apr-jun. 2018 p.248-272
Psychological Barriers in Single Stock Prices: Evidence from Three Emerging Markets
3.2.4
Barrier tests
Barrier tests are used to assess whether observations are less frequent near barriers than would be expected considering a uniform distribution. The existence of a psychological barrier implies we will observe a significantly lower closing price frequency within an interval around the barrier (Donald & Kim, 1993; Ley & Varian, 1994). Therefore, the objective of the barrier tests is to investigate the influence of round numbers on the non-uniform distribution of M-values. We will use two types of barrier
tests: the barrier proximity test and the barrier hump test.
3.2.4.1
Barrier proximity test
This test examines the frequency of observations, f(M), near potential barriers and will be performed according to Eq. (3.7):
(3.7)
The dummy variable will take the value of unity when the price of the stock is at the supposed barrier and zero elsewhere. As was mentioned in section 3.2.1, this barrier will not be strictly considered as an exact number but also as a number of different specific intervals, namely with an absolute length of 5%, 10% and 25% of the corresponding power of ten as barriers. The null hypothesis of no barriers will thus imply that β
equals zero, while β is expected to be negative and significant in the presence of barriers as a result of the lower frequency of M-values at these levels.
3.2.4.2
Barrier hump test
The second barrier test will examine not just the tails of frequency distribution near the potential barriers, but the entire shape of the distribution. It is thus necessary to define the alternative shape that the distribution should take in the presence of barriers (Aggarwal & Lucey, 2007; Donaldson & Kim, 1993). Bertola and Caballero (1992), who analysed the behaviour
of exchange rates in the presence of target zones imposed by forward-looking agents, suggest that a hump-shape is an appropriate alternative for the distribution of observations.
The test to examine this possibility will follow Eq. (3.8), in which the frequency of observation of each M-value is regressed on the M-value itself and on its square:
β
β
Segundo a hipótese nula, “sem barreiras”,
ϒ
ϒ
(3.8)
Under the null hypothesis of no barriers,
ϒ is expected to be zero, whereas the presence of barriers should result in ϒ being negative and significant.
3.2.5
Conditional effect tests
The rejection of uniformity in the observations of M-values is not sufficient to prove
the existence of psychological barriers (Ley & Varian, 1994). Therefore, it is necessary to analyse the dynamics of the returns series around these barriers, namely regarding mean and variance in order to examine the differential effect on returns due to prices being near a barrier, and whether these barriers were being approached in an upward or in a downward movement (Aggarwal & Lucey, 2007; Cyree et al., 1999).
Accordingly, we will thus define four regimes around barriers: BD for the five days before prices reach a barrier in a downward movement, AD for the five days after prices cross a barrier in a downward movement, and BU and AU for the five days before and after prices breach a barrier in an upward movement, respectively. These dummy variables will take the value of unity for the days noted and zero otherwise. In the absence of barriers, we expect the coefficients of the indicator variables in the mean equation to be non-significantly different from zero.
256
Rev. Bras. Gest. Neg. São Paulo v.20 n.2 apr-jun. 2018 p.248-272
Júlio Lobão / João Fernandes
Following Aggarwal and Lucey (2007), we started with an OLS estimation of Eq. (3.9), but heteroscedasticity and autocorrelation were clearly present across our data base. Therefore, full analysis of the effects in the proximity of barriers required us to also apply the former test to the
variances. Eq. (3.10) represents this approach assuming autocorrelation similar to in Aggarwal and Lucey (2007) and Cyree et al. (1999). Besides the abovementioned dummy variables it includes a moving average parameter and a GARCH parameter.
The four possible hypotheses to be tested are the following:
H1: There is no difference in the conditional mean return before and after a downward crossing of a barrier.
H2: There is no difference in the conditional mean return before and after an upward crossing of a barrier.
H3: There is no difference in the conditional variance before and after a downward crossing of a barrier.
H4: There is no difference in the conditional variance before and after an upward crossing of a barrier.
4
Empirical Findings
4.1
Uniformity test
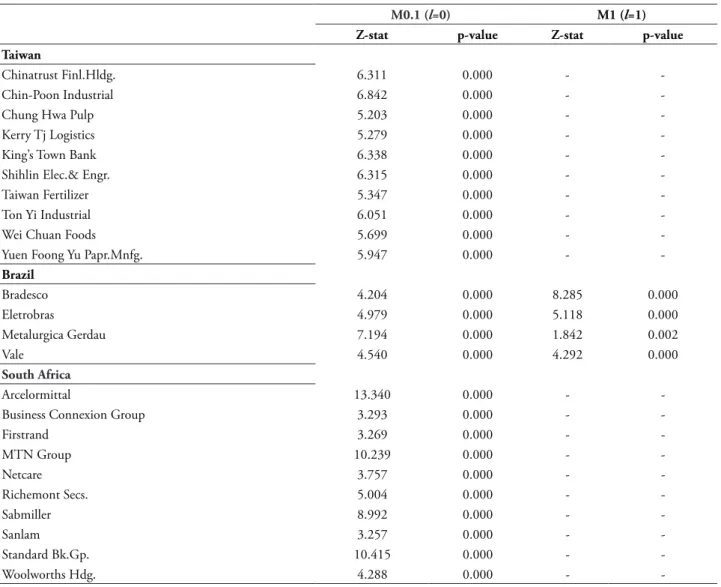
Table 2 provides the results of a uniformity test concerning the distribution of digits for the stock prices under analysis. Overall, there is strong evidence that the M-values do not follow
257 Rev. Bras. Gest. Neg. São Paulo v.20 n.2 apr-jun. 2018 p.248-272
Psychological Barriers in Single Stock Prices: Evidence from Three Emerging Markets
Table 2
Z test for uniformity of digits in the 30 individual stock price data series
M0.1 (l=0) M1 (l=1)
Z-stat p-value Z-stat p-value Taiwan
Chinatrust Finl.Hldg. 6.311 0.000 -
-Chin-Poon Industrial 6.842 0.000 -
-Chung Hwa Pulp 5.203 0.000 -
-Kerry Tj Logistics 5.279 0.000 -
-King’s Town Bank 6.338 0.000 -
-Shihlin Elec.& Engr. 6.315 0.000 -
-Taiwan Fertilizer 5.347 0.000 -
-Ton Yi Industrial 6.051 0.000 -
-Wei Chuan Foods 5.699 0.000 -
-Yuen Foong Yu Papr.Mnfg. 5.947 0.000 -
-Brazil
Bradesco 4.204 0.000 8.285 0.000
Eletrobras 4.979 0.000 5.118 0.000
Metalurgica Gerdau 7.194 0.000 1.842 0.002
Vale 4.540 0.000 4.292 0.000
South Africa
Arcelormittal 13.340 0.000 -
-Business Connexion Group 3.293 0.000 -
-Firstrand 3.269 0.000 -
-MTN Group 10.239 0.000 -
-Netcare 3.757 0.000 -
-Richemont Secs. 5.004 0.000 -
-Sabmiller 8.992 0.000 -
-Sanlam 3.257 0.000 -
-Standard Bk.Gp. 10.415 0.000 -
-Woolworths Hdg. 4.288 0.000 -
-Note. Table 2 shows the results of a Kolmogorov-Smirnov test for uniformity. Z-stat stands for the value of the test statistic, while p-value gives the marginal significance of this statistic. H0: uniformity in the distribution of digits, H1: non uniformity in the distribution of digits.
4.2
Barrier tests
4.2.1
Barrier proximity test
The results for the barrier proximity tests are shown in Tables 3 to 6 for all the intervals mentioned in sections 3.2.1 and 3.2.4. As mentioned above, in the presence of a barrier we would expect β to be negative and significant, implying a lower frequency of M-values at these
points. Considering a barrier at the exact zero module point, the results in Table 3 show that there is no evidence of psychological barriers in all the stocks under analysis. Either all the series are
not significant or β is not negative. If we assume a barrier in the interval 98-02, the conclusions are exactly the same as for the strict point barrier (results not reported).
Table 4 shows similar results for the 95-05 interval: the evidence of psychological barriers continues to be rejected for all the stocks.
258
Rev. Bras. Gest. Neg. São Paulo v.20 n.2 apr-jun. 2018 p.248-272
Júlio Lobão / João Fernandes
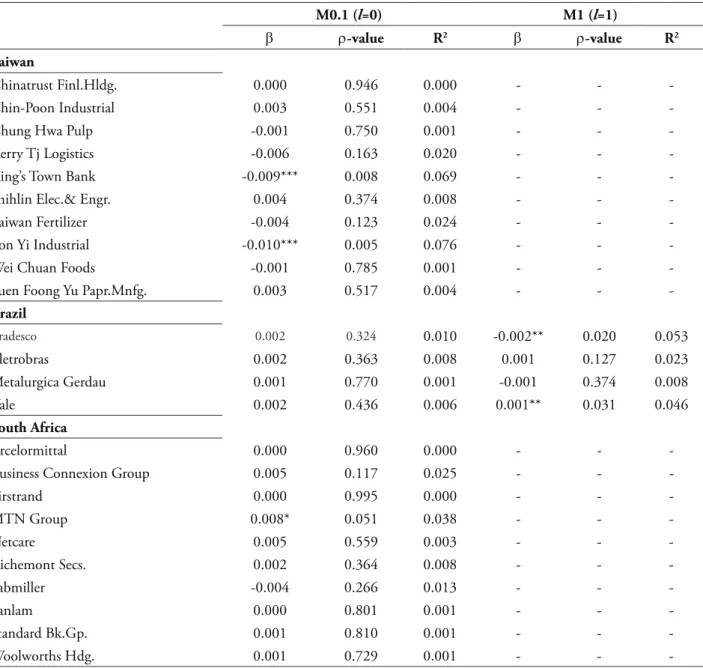
Either all the other series continue to be not significant or β is not negative. Finally, Table 6 presents the results for the largest barrier interval. Besides Ton Yi Industrial, we now find a negative and significant β for King’s Town Bank (Taiwan) at the first barrier level and for Bradesco at the second barrier level.
Overall, the results suggest that psychological barriers are not an important
phenomenon in the single stocks under study. Besides Ton Yi Industrial, King’s Town Bank and Bradesco, all the other stocks present no consistent evidence of a barrier around round numbers for the whole sample period. The R-squares are significantly low, which is in line with previous studies focusing on stock indices.
Table 3
Barrier proximity test: strict barrier
M0.1 (l=0) M1 (l=1)
β ρ-value R2 β ρ-value R2
Taiwan
Chinatrust Finl.Hldg. -0.002 0.586 0.003 - -
-Chin-Poon Industrial 0.003 0.495 0.005 - -
-Chung Hwa Pulp 0.007 0.205 0.016 - -
-Kerry Tj Logistics -0.010 0.141 0.022 - -
-King’s Town Bank -0.007 0.148 0.021 - -
-Shihlin Elec.& Engr. -0.007 0.414 0.007 - -
-Taiwan Fertilizer 0.000 0.939 0.000 - -
-Ton Yi Industrial -0.010 0.138 0.022 - -
-Wei Chuan Foods -0.002 0.720 0.001 - -
-Yuen Foong Yu Papr.Mnfg. -0.002 0.820 0.001 - -
-Brazil
Bradesco 0.010*** 0.005 0.078 n.a.
Eletrobras 0.002 0.592 0.003 0.000 0.990 0.000
Metalurgica Gerdau 0.005 0.140 0.022 0.000 0.683 0.002
Vale -0.003 0.380 0.008 0.002 0.125 0.024
South Africa
Arcelormittal -0.001 0.903 0.000 - -
-Business Connexion Group -0.001 0.891 0.000 - -
-Firstrand -0.003 0.463 0.006 - -
-MTN Group -0.003 0.569 0.003 - -
-Netcare 0.001 0.830 0.000 - -
-Richemont Secs. -0.001 0.688 0.002 - -
-Sabmiller -0.003 0.549 0.004 - -
-Sanlam 0.001 0.749 0.001 - -
-Standard Bk.Gp. 0.000*** 0.005 0.976 - -
-Woolworths Hdg. -0.006 0.388 0.008 - -
259 Rev. Bras. Gest. Neg. São Paulo v.20 n.2 apr-jun. 2018 p.248-272
Psychological Barriers in Single Stock Prices: Evidence from Three Emerging Markets
Table 4
Barrier proximity test: 95-05 barrier
M0.1 (l=0) M1 (l=1)
β ρ-value R2 β ρ-value R2
Taiwan
Chinatrust Finl.Hldg. -0.002 0.586 0.003 - -
-Chin-Poon Industrial 0.003 0.495 0.005 - -
-Chung Hwa Pulp 0.007 0.205 0.016 - -
-Kerry Tj Logistics -0.010 0.116 0.025 - -
-King’s Town Bank -0.004 0.373 0.008 - -
-Shihlin Elec.& Engr. -0.007 0.414 0.007 - -
-Taiwan Fertilizer 0.000 0.939 0.000 - -
-Ton Yi Industrial -0.008 0.145 0.021 - -
-Wei Chuan Foods 0.003 0.388 0.008 - -
-Yuen Foong Yu Papr.Mnfg. 0.009 0.285 0.012 - -
-Brazil
Bradesco 0.006** 0.038 0.043 n.a.
Eletrobras 0.004 0.137 0.022 0.002* 0.094 0.028
Metalurgica Gerdau 0.004 0.255 0.013 -0.001 0.189 0.017
Vale -0.002 0.390 0.008 0.001 0.378 0.008
South Africa
Arcelormittal 0.004 0.499 0.005 - -
-Business Connexion Group 0.004 0.317 0.010 - -
-Firstrand -0.002 0.491 0.005 - -
-MTN Group -0.002 0.647 0.002 - -
-Netcare -0.003 0.147 0.021 - -
-Richemont Secs. -0.001 0.688 0.002 - -
-Sabmiller -0.003 0.549 0.004 - -
-Sanlam 0.000 0.918 0.000 - -
-Standard Bk.Gp. 0.000 0.963 0.000 - -
-Woolworths Hdg. -0.003 0.364 0.008 - -
260
Rev. Bras. Gest. Neg. São Paulo v.20 n.2 apr-jun. 2018 p.248-272
Júlio Lobão / João Fernandes
Table 5
Barrier proximity test: 90-10 barrier
M0.1 (l=0) M1 (l=1)
β ρ-value R2 β ρ-value R2
Taiwan
Chinatrust Finl.Hldg. -0.002 0.586 0.003 - -
-Chin-Poon Industrial 0.003 0.495 0.005 - -
-Chung Hwa Pulp 0.007 0.205 0.016 - -
-Kerry Tj Logistics -0.010 0.116 0.025 - -
-King’s Town Bank -0.004 0.373 0.008 - -
-Shihlin Elec.& Engr. -0.007 0.414 0.007 - -
-Taiwan Fertilizer 0.000 0.939 0.000 - -
-Ton Yi Industrial -0.008 0.145 0.021 - -
-Wei Chuan Foods 0.003 0.388 0.008 - -
-Yuen Foong Yu Papr.Mnfg. 0.009 0.285 0.012 - -
-Brazil
Bradesco 0.006** 0.038 0.043 n.a.
Eletrobras 0.004 0.137 0.022 0.002* 0.094 0.028
Metalurgica Gerdau 0.004 0.255 0.013 -0.001 0.189 0.017
Vale -0.002 0.390 0.008 0.001 0.378 0.008
South Africa
Arcelormittal 0.004 0.499 0.005 - -
-Business Connexion Group 0.004 0.317 0.010 - -
-Firstrand -0.002 0.491 0.005 - -
-MTN Group -0.002 0.647 0.002 - -
-Netcare -0.003 0.147 0.021 - -
-Richemont Secs. -0.001 0.688 0.002 - -
-Sabmiller -0.003 0.549 0.004 - -
-Sanlam 0.000 0.918 0.000 - -
-Standard Bk.Gp. 0.000 0.963 0.000 - -
-Woolworths Hdg. -0.003 0.364 0.008 - -
261 Rev. Bras. Gest. Neg. São Paulo v.20 n.2 apr-jun. 2018 p.248-272
Psychological Barriers in Single Stock Prices: Evidence from Three Emerging Markets
Table 6
Barrier proximity test: 75-25 barrier
M0.1 (
l=0) M1 (l=1)
β ρ-value R2 β ρ-value R2
Taiwan
Chinatrust Finl.Hldg. 0.000 0.946 0.000 - -
-Chin-Poon Industrial 0.003 0.551 0.004 - -
-Chung Hwa Pulp -0.001 0.750 0.001 - -
-Kerry Tj Logistics -0.006 0.163 0.020 - -
-King’s Town Bank -0.009*** 0.008 0.069 - -
-Shihlin Elec.& Engr. 0.004 0.374 0.008 - -
-Taiwan Fertilizer -0.004 0.123 0.024 - -
-Ton Yi Industrial -0.010*** 0.005 0.076 - -
-Wei Chuan Foods -0.001 0.785 0.001 - -
-Yuen Foong Yu Papr.Mnfg. 0.003 0.517 0.004 - -
-Brazil
Bradesco 0.002 0.324 0.010 -0.002** 0.020 0.053
Eletrobras 0.002 0.363 0.008 0.001 0.127 0.023
Metalurgica Gerdau 0.001 0.770 0.001 -0.001 0.374 0.008
Vale 0.002 0.436 0.006 0.001** 0.031 0.046
South Africa
Arcelormittal 0.000 0.960 0.000 - -
-Business Connexion Group 0.005 0.117 0.025 - -
-Firstrand 0.000 0.995 0.000 - -
-MTN Group 0.008* 0.051 0.038 - -
-Netcare 0.005 0.559 0.003 - -
-Richemont Secs. 0.002 0.364 0.008 - -
-Sabmiller -0.004 0.266 0.013 - -
-Sanlam 0.000 0.801 0.001 - -
-Standard Bk.Gp. 0.001 0.810 0.001 - -
-Woolworths Hdg. 0.001 0.729 0.001 - -
-Note. Table 6 shows the results of a regression f(M)=α+βD+ε, where f(M) stands for the frequency of appearance of the M-values, D is a dummy variable that takes the value of unity when the M-value is in the 75-25 interval and 0 otherwise. Refer to section 3.2.4 for details. *, **, *** indicates significance at the 10%, 5% and 1% level, respectively.
4.2.2
Barrier hump test
Table 7 shows the results for the barrier hump test, which is meant to test the entire shape of the distribution of M-values. Assuming
it should follow a hump-shape distribution, we thus expected ϒ tobe negative and significant in
the presence of barriers. However, the evidence of persistent barriers is again weak. For the 24 securities under analysis, the null hypothesis of no barriers is rejected in just two situations: Kerry Tj Logistics (Taiwan) and Ton Yi Industrial
262
Rev. Bras. Gest. Neg. São Paulo v.20 n.2 apr-jun. 2018 p.248-272
Júlio Lobão / João Fernandes
Table 7
Barrier hump test
M0.1 (l=0) M1 (l=1)
γ ρ-value R2 γ ρ-value R2
Taiwan
Chinatrust Finl.Hldg. -0.0000024 0.851 0.011 - -
-Chin-Poon Industrial 0.0000009 0.920 0.004 - -
-Chung Hwa Pulp 0.0000015 0.517 0.011 - -
-Kerry Tj Logistics -0.0000046* 0.083 0.041 - -
-King’s Town Bank -0.0000032 0.153 0.043 - -
-Shihlin Elec.& Engr. 0.0000015 0.616 0.032 - -
-Taiwan Fertilizer -0.0000023 0.219 0.023 - -
-Ton Yi Industrial -0.0000061** 0.016 0.062 - -
-Wei Chuan Foods -0.0000007 0.731 0.008 - -
-Yuen Foong Yu Papr.Mnfg. 0.0000037 0.265 0.019 - -
-Brazil
Bradesco 0.0000018 0.195 0.036 0.0000040 0.052 0.206
Eletrobras 0.0000013 0.381 0.047 0.0000007 0.212 0.095
Metalurgica Gerdau 0.0000002 0.931 0.022 -0.0000005 0.193 0.019
Vale 0.0000002 0.867 0.011 0.0000008 0.060 0.044
South Africa
Arcelormittal 0.0000011 0.713 0.002 - -
-Business Connexion Group 0.0000025 0.146 0.027 - -
-Firstrand -0.0000002 0.844 0.008 - -
-MTN Group 0.0000050* 0.054 0.065 - -
-Netcare -0.0000013 0.561 0.010 - -
-Richemont Secs. -0.0000015 0.379 0.013 - -
-Sabmiller -0.0000033 0.167 0.021 - -
-Sanlam -0.0000002 0.869 0.000 - -
-Standard Bk.Gp. 0.0000000 0.996 0.002 - -
-Woolworths Hdg. -0.0000001 0.952 0.001 - -
-Note. Table 7 shows the results of a regression f(M)=α+ϕM+ϒM2+η, where f(M), the frequency of appearance of each M-value
is regressed on M, the M-value itself, and M2, its square. *, ** indicates significance at the 10% and 5% level, respectively.
4.2.3
Conditional effects test
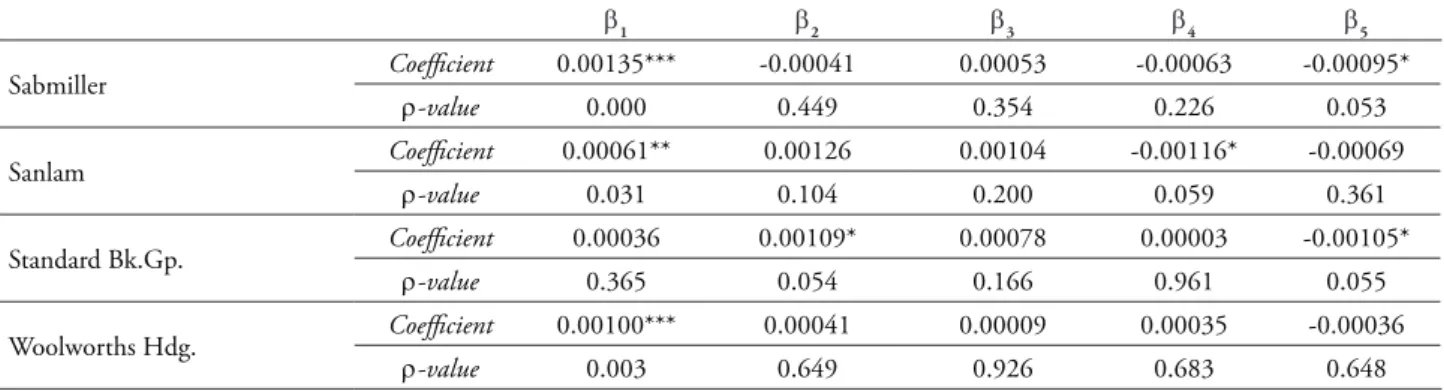
Assuming the existence of psychological barriers, we expected the dynamics of the individual returns series to be different around these points. However, the results in Table 8 provide no clear evidence of mean effects around barriers, as there is no clear pattern of effects on individual stock returns before and after crossing
263 Rev. Bras. Gest. Neg. São Paulo v.20 n.2 apr-jun. 2018 p.248-272
Psychological Barriers in Single Stock Prices: Evidence from Three Emerging Markets
Table 8
GARCH analysis: mean equation
β
1 β2 β3 β4 β5
Taiwan
Chinatrust Finl.Hldg. Coefficient 0.00030 -0.00072 -0.00290 -0.00014 -0.00088
ρ-value 0.565 0.515 0.401 0.911 0.441 Chin-Poon Industrial Coefficient 0.00020 -0.00054 -0.00124 -0.00114 -0.00003
ρ-value 0.550 0.462 0.197 0.175 0.972 Chung Hwa Pulp Coefficient -0.00001 0.00156 -0.00645*** 0.00146 -0.00030
ρ-value 0.970 0.118 0.000 0.138 0.657
Kerry Tj Logistics Coefficient 0.00023 0.00010 0.00062 0.00078 -0.00010
ρ-value 0.599 0.913 0.434 0.352 0.884
King’s Town Bank Coefficient -0.00129 0.00159 0.00212 0.00102 0.00040
ρ-value 0.236 0.304 0.182 0.568 0.807 Shihlin Elec.& Engr. Coefficient 0.00101 -0.00007 -0.00170 -0.00188 -0.00119
ρ-value 0.105 0.949 0.549 0.087 0.258
Taiwan Fertilizer Coefficient -0.00225 0.00346 0.00095 0.00474 0.00386
ρ-value 0.569 0.437 0.833 0.247 0.361 Ton Yi Industrial Coefficient 0.00159 -0.00108 0.00069 -0.00188 -0.00187
ρ-value 0.402 0.666 0.779 0.473 0.448
Wei Chuan Foods Coefficient 0.00011 0.00119 -0.00079 -0.00032 -0.00096
ρ-value 0.821 0.244 0.442 0.702 0.242 Yuen Foong Yu Papr.Mnfg. Coefficient -0.00113 0.00121 0.00240 0.00228 0.00175
ρ-value 0.478 0.575 0.258 0.302 0.415
Brazil
Bradesco Coefficient 0.00049 -0.00083 -0.00016 0.00573 0.00410
ρ-value 0.840 0.935 0.986 0.756 0.852
Eletrobras Coefficient -0.00002 -0.00479** 0.00205 0.00480 0.00688**
ρ-value 0.951 0.047 0.478 0.134 0.027 Metalurgica Gerdau Coefficient -0.00012 0.00137 -0.00393 0.00102 -0.00332
ρ-value 0.823 0.535 0.311 0.633 0.784 Vale Coefficient -0.00299*** 0.00375 0.00357* 0.00185 0.00218
ρ-value 0.000 0.111 0.080 0.392 0.118
South Africa
Arcelormittal Coefficient -0.01122*** 0.00715*** 0.00584*** 0.00435*** 0.00521***
ρ-value 0.000 0.000 0.000 0.000 0.000 Business Connexion Group Coefficient 0.00075 0.00049 0.00306 -0.00087 -0.00287
ρ-value 0.702 0.845 0.368 0.699 0.350
Firstrand Coefficient 0.00126*** -0.00086 -0.00186** -0.00096 -0.00047
ρ-value 0.000 0.368 0.049 0.247 0.548
MTN Group Coefficient 0.00091* 0.00198*** 0.00090 -0.00163** -0.00106
ρ-value 0.086 0.004 0.190 0.012 0.107
Netcare Coefficient 0.00108*** -0.00061 0.00014 0.00113 -0.00090
ρ-value 0.000 0.557 0.889 0.210 0.331
Richemont Secs. Coefficient -0.00039 0.00127 0.00179 0.00097 -0.00133
264
Rev. Bras. Gest. Neg. São Paulo v.20 n.2 apr-jun. 2018 p.248-272
Júlio Lobão / João Fernandes
β
1 β2 β3 β4 β5
Sabmiller Coefficient 0.00135*** -0.00041 0.00053 -0.00063 -0.00095*
ρ-value 0.000 0.449 0.354 0.226 0.053
Sanlam Coefficient 0.00061** 0.00126 0.00104 -0.00116* -0.00069
ρ-value 0.031 0.104 0.200 0.059 0.361
Standard Bk.Gp. Coefficient 0.00036 0.00109* 0.00078 0.00003 -0.00105*
ρ-value 0.365 0.054 0.166 0.961 0.055
Woolworths Hdg. Coefficient 0.00100*** 0.00041 0.00009 0.00035 -0.00036
ρ-value 0.003 0.649 0.926 0.683 0.648
Note. Table 8 shows the results of the mean equation of a GARCH estimation of the form Rt=β1+ β2BD+ β3AD+ β4BU+
β5AU+εt; εt ~N(0,Vt); Vt= α1+ α2BD+ α3AD+ α4BU+ α5AU+α6Vt-1+α7ε
2t-1+ηt. BD, AD, BU and AU are dummy variables.
BD takes the value 1 in the 5 days before crossing a barrier in a downward movement and zero otherwise, whereas AD is for the 5 days after the same event. BU is for the 5 days before crossing a barrier from below, while AU is 1 in the 5 days after the same upward crossing. Vt-1 refers to the moving average parameter and ε2
t-1stands for the GARCH parameter.
Barriers at l=0 are tested in the case of the Taiwanese and South African stocks and barriers at l=1 are tested in the case of the stocks from Brazil. *, **, *** indicates significance at the 10%, 5% and 1% level, respectively.
Table 9 contains the results for the conditional variance equation. In this case, the evidence is substantially stronger, although there is still no clear pattern for all the stocks. The constant is positive and significant for all the stocks. The GARCH term in the conditional variance is positive and significant for almost all the stocks, indicating significant GARCH effects around the barriers. The coefficients of the lagged squared residuals are all significant at the 1% level. The variance effects are particularly evident before a downward movement through a barrier and both before and after crossing a barrier in an upward move: the coefficients of BD, BU and AU in the variance equation are negative and statistically significant in thirteen, thirteen and twelve of the twenty-four stocks, respectively. This indicates that these stock prices tend to calm before falling
through a barrier and are near a barrier when they are in an upward move. However, these effects are not uniform across the series tested. In each case, there are a small number of stocks that exhibit exactly the opposite behavior to what we have just described.
The results in the post-crossing period when the stock prices are in a downward movement are much more heterogeneous. There is almost the same number of stocks exhibiting a higher level of volatility or a lower level of volatility in these circumstances.
265 Rev. Bras. Gest. Neg. São Paulo v.20 n.2 apr-jun. 2018 p.248-272
Psychological Barriers in Single Stock Prices: Evidence from Three Emerging Markets
Table 9
GARCH analysis: variance equation
α1 α2 α3 α4 α5 α6 α7
Taiwan
Chinatrust Finl. Hldg.
Coefficient 0.00051*** -0.00001 0.00210*** 0.00009** -0.00011*** -0.00970 0.18937***
ρ-value 0.000 0.797 0.000 0.010 0.000 0.597 0.000 Chin-Poon
Industrial
Coefficient 0.00000** 0.00001*** 0.00001** 0.00002*** -0.00002*** 0.96333*** 0.03308***
ρ-value 0.015 0.000 0.013 0.000 0.000 0.000 0.000 Chung Hwa
Pulp
Coefficient 0.00003*** -0.00001** 0.00011*** 0.00002*** -0.00001** 0.72062*** 0.26840***
ρ-value 0.000 0.016 0.000 0.000 0.021 0.000 0.000 Kerry Tj
Logistics
Coefficient 0.00000*** 0.00000 -0.00001*** 0.00000** 0.00000** 0.94371*** 0.05395***
ρ-value 0.000 0.343 0.002 0.031 0.034 0.000 0.000 King’s Town
Bank
Coefficient 0.00046*** -0.00022*** -0.00016*** -0.00018*** -0.00019*** 0.66827*** 0.08427***
ρ-value 0.000 0.000 0.000 0.000 0.000 0.000 0.000 Shihlin Elec.&
Engr.
Coefficient 0.00014*** -0.00003*** 0.00056*** -0.00001 -0.00002** 0.74821*** -0.00109***
ρ-value 0.000 0.003 0.000 0.398 0.026 0.000 0.000 Taiwan
Fertilizer
Coefficient 0.00256*** -0.00057*** -0.00090*** -0.00112*** -0.00109*** 0.60680*** -0.00081***
ρ-value 0.000 0.000 0.000 0.000 0.000 0.000 0.001 Ton Yi
Industrial
Coefficient 0.00088*** -0.00033*** -0.00031*** -0.00034*** -0.00033*** 0.60280*** 0.10481***
ρ-value 0.000 0.000 0.000 0.000 0.000 0.000 0.002 Wei Chuan
Foods
Coefficient 0.00012*** -0.00002** -0.00001** -0.00006*** -0.00005*** 0.56758*** 0.27590***
ρ-value 0.000 0.010 0.016 0.000 0.000 0.000 0.000 Yuen Foong Yu
Papr.Mnfg.
Coefficient 0.00086*** -0.00024*** -0.00024*** -0.00023*** -0.00025*** 0.59462*** -0.00157***
ρ-value 0.000 0.000 0.000 0.000 0.000 0.000 0.000
Brazil
Bradesco Coefficient 0.00243*** -0.00124*** -0.00144*** -0.00134*** -0.00020* 0.59653*** 0.06108**
ρ-value 0.000 0.000 0.000 0.000 0.074 0.000 0.028 Eletrobras Coefficient 0.00003*** -0.00004 0.00006** 0.00004 0.00031*** 0.80687*** 0.17350***
ρ-value 0.000 0.105 0.048 0.143 0.000 0.000 0.000 Metalurgica
Gerdau
Coefficient 0.00017*** -0.00010*** 0.00027*** -0.00017*** 0.00158*** 0.78247*** 0.04313***
ρ-value 0.000 0.000 0.000 0.000 0.000 0.000 0.000 Vale Coefficient 0.00006*** -0.00005** -0.00002 -0.00004** -0.00001 0.57772*** 0.95679***
ρ-value 0.000 0.010 0.511 0.049 0.700 0.000 0.000
South Africa
Arcelormittal Coefficient 0.00086*** -0.00024*** -0.00024*** -0.00023*** -0.00025*** 0.59462*** -0.00157***
266
Rev. Bras. Gest. Neg. São Paulo v.20 n.2 apr-jun. 2018 p.248-272
Júlio Lobão / João Fernandes
β
1 β2 β3 β4 β5
Business Connexion Group
Coefficient 0.00091*** -0.00019*** 0.00012*** -0.00082*** -0.00001 0.57829*** 0.14874***
ρ-value 0.000 0.000 0.000 0.000 0.742 0.000 0.000 Firstrand Coefficient 0.00001*** 0.00001 -0.00001** 0.00000 0.00000 0.88323*** 0.08433***
ρ-value 0.000 0.335 0.026 0.725 0.388 0.000 0.000 MTN Group Coefficient 0.00001*** -0.00001 0.00001* 0.00000 -0.00001* 0.92142*** 0.06647***
ρ-value 0.000 0.134 0.064 0.728 0.066 0.000 0.000 Netcare Coefficient 0.00001*** 0.00001*** -0.00001*** 0.00000 0.00000 0.89718*** 0.08286***
ρ-value 0.000 0.008 0.005 0.225 0.314 0.000 0.000 Richemont
Secs.
Coefficient 0.00177*** 0.00006** 0.00006** -0.00149*** -0.00023*** 0.59261*** -0.00084***
ρ-value 0.000 0.038 0.031 0.000 0.005 0.000 0.000 Sabmiller Coefficient 0.00000*** 0.00001*** -0.00001** 0.00000 0.00000 0.92882*** 0.04540***
ρ-value 0.000 0.000 0.010 0.854 0.564 0.000 0.000 Sanlam Coefficient 0.00001*** -0.00002*** 0.00002*** -0.00001** 0.00001** 0.89712*** 0.08334***
ρ-value 0.000 0.000 0.000 0.020 0.014 0.000 0.000 Standard
Bk.Gp.
Coefficient 0.00001*** 0.00001** 0.00000 0.00000 -0.00001** 0.90760*** 0.07153***
ρ-value 0.000 0.011 0.498 0.314 0.012 0.000 0.000 Woolworths
Hdg.
Coefficient 0.00001*** 0.00000 0.00001* -0.00001** 0.00000 0.90326*** 0.05793***
ρ-value 0.000 0.530 0.059 0.016 0.926 0.000 0.000
Note. Table 9 shows the results of the variance equation of a GARCH estimation of the form Rt=β1+ β2BD+ β3AD+ β4BU+
β5AU+εt; εt ~N(0,Vt); Vt= α1+ α2BD+ α3AD+ α4BU+ α5AU+α6Vt-1+α7ε
2t-1+ηt. BD, AD, BU and AU are dummy variables.
BD takes the value 1 in the 5 days before crossing a barrier in a downward movement and zero otherwise, whereas AD is for the 5 days after the same event. BU is for the 5 days before crossing a barrier from below, while AU is 1 in the 5 days after the same upward crossing. Vt-1 refers to the moving average parameter and ε
2
t-1stands for the GARCH parameter.
Barriers at l=0 are tested in the case of Taiwanese and South African stocks and barriers at l=1 are tested in the case of the stocks from Brazil. *, **, *** indicates significance at the 10%, 5% and 1% level, respectively.
Table 10 shows the test results for the four barrier hypotheses mentioned in section 3.2.5. If some kind of barrier indeed existed, we would expect that the restraints in terms of mean and variance would be relaxed after the price crossed that barrier. In line with our previous analysis, the
267 Rev. Bras. Gest. Neg. São Paulo v.20 n.2 apr-jun. 2018 p.248-272
Psychological Barriers in Single Stock Prices: Evidence from Three Emerging Markets
Table 10
Barrier hypothesis tests
H1 H2 H3 H4
Taiwan
Chinatrust Finl.Hldg. χ
2 0.3667 0.1786 4652.9829*** 21.5242***
ρ-value 0.545 0.673 0.000 0.000
Chin-Poon Industrial χ
2 0.3496 0.8909 0.5382 125.4598***
ρ-value 0.554 0.345 0.463 0.000
Chung Hwa Pulp χ
2 28.1751*** 21.443 74.1356*** 13.9914***
ρ-value 0.000 0.143 0.000 0.000
Kerry Tj Logistics χ
2 0.2024 0.6776 4.2348** 5.1816**
ρ-value 0.653 0.410 0.040 0.023
King’s Town Bank χ
2 0.0543 0.0591 4.6443** 0.4129
ρ-value 0.816 0.808 0.031 0.520
Shihlin Elec.& Engr.
χ2 0.2936 0.2014 508.7208*** 0.6995
ρ-value 0.588 0.654 0.000 0.403
Taiwan Fertilizer χ
2 0.1396 0.0220 3.0149* 0.0735
ρ-value 0.709 0.882 0.083 0.786
Ton Yi Industrial χ
2 0.2103 0.0000 0.1266 0.0799
ρ-value 0.647 0.999 0.722 0.777
Wei Chuan Foods χ
2 19.484 0.2833 0.1674 27.076
ρ-value 0.163 0.595 0.682 0.100
Yuen Foong Yu Papr. Mnfg.
χ2 0.1378 0.0297 0.0040 0.1007
ρ-value 0.711 0.863 0.950 0.751
Brazil
Bradesco χ
2 0.0015 0.0032 0.2241 12.4491***
ρ-value 0.969 0.955 0.636 0.000
Eletrobras χ
2 3.2442* 0.2223 4.9873** 19.2599***
ρ-value 0.072 0.637 0.026 0.000
Metalurgica Gerdau χ
2 13.915 0.1247 185.0170*** 204.0019***
ρ-value 0.238 0.724 0.000 0.000
Vale χ
2 0.0028 0.0123 0.7391 0.9379
ρ-value 0.958 0.912 0.390 0.333
South Africa
Arcelormittal χ
2 12.636 0.6954 0.0136 24.068
ρ-value 0.261 0.404 0.907 0.121
Business Connexion Group
χ2 0.4632 0.2634 68.0694*** 260.5567***
ρ-value 0.496 0.608 0.000 0.000
Firstrand χ
2 0.5526 0.1902 3.2510* 0.4276
ρ-value 0.457 0.663 0.071 0.513
MTN Group χ
2 12.193 0.3762 3.1588* 0.4674
268
Rev. Bras. Gest. Neg. São Paulo v.20 n.2 apr-jun. 2018 p.248-272
Júlio Lobão / João Fernandes
H1 H2 H3 H4
Netcare χ
2 0.2872 22.544 8.6299*** 13.745
ρ-value 0.592 0.133 0.003 0.241
Richemont Secs. χ
2 0.0254 0.1554 0.0000 195.8572***
ρ-value 0.873 0.693 0.995 0.000
Sabmiller χ
2 14.299 0.2018 23.1278*** 0.1689
ρ-value 0.232 0.653 0.000 0.681
Sanlam χ
2 0.0381 0.2413 96.7367*** 7.6482***
ρ-value 0.845 0.623 0.000 0.006
Standard Bk.Gp. χ
2 0.1586 18.867 3.1401* 3.5203*
ρ-value 0.690 0.170 0.076 0.061
Woolworths Hdg. χ
2 0.0589 0.3428 0.4141 17.399
ρ-value 0.808 0.558 0.520 0.187
Note. Table 10 shows the results for a 2 test of four different null hypotheses. H1: There is no difference in the conditional
mean return before and after a downward crossing of a barrier; H2: There is no difference in the conditional mean return before and after an upward crossing of a barrier. H3: There is no difference in the conditional variance before and after a downward crossing of a barrier; H4: There is no difference in the conditional variance before and after an upward crossing of a barrier. *, **, *** indicates significance at the 10%, 5% and 1% level, respectively.
The first hypothesis, which tested differences in conditional mean returns before and after a downwards crossing of a barrier, is only rejected at a 10% level for two stocks overall (Chung Hwa Pulp and Eletrobras), whereas the second one, which focuses on the upward movement, is not rejected for any of the stocks.
Again following our previous findings, the evidence is slightly more consistent regarding the conditional volatility of the stock prices, although it is somewhat scattered. Regarding the third parameter restriction, which tested the difference in the conditional variance before and after a downwards crossing of a barrier, we now find that this difference is statistically significant at a 10% level for eleven out of the twenty-four stocks in the sample. Regarding the volatility dynamics in upwards movements across barriers, we can reject the inexistence of differences in conditional variance before and after an upwards breaching of a barrier for ten of the stocks that comprise the sample.
Our findings are consistent with the few papers that have focused on a similar subject: the study by Dorfleitner and Klein (2009), which analysed German stocks, and the study by Cai et al. (2007) regarding price resistance in Chinese stocks.
Overall, our evidence suggests that although there are no significant effects in terms of returns on stock prices around barrier points, volatility is in fact affected in nearly half of the stocks under scrutiny. A similar result was obtained by Cyree et al. (1999) for several indices representing developed stock markets. The authors noticed that their result – a simultaneous increase in conditional return and decrease in conditional variance – appeared to represent an “aberration” in the equilibrium risk–return relationship. As also pointed out by Aggarwal and Lucey (2007), such findings pose some relevant implications for the positive risk-return relationship postulated by the standard financial models. As variance is normally used as a proxy for risk, changes in this parameter should be linked to changes in expected returns. However, our findings suggest that this relationship may be biased in the case of individual stock prices near round numbers.
5
Conclusion
269 Rev. Bras. Gest. Neg. São Paulo v.20 n.2 apr-jun. 2018 p.248-272
Psychological Barriers in Single Stock Prices: Evidence from Three Emerging Markets
rational decisions, the average market practitioner is often affected, directly or indirectly, by this phenomenon. Following the evidence presented by previous studies showing that stock indices were indeed affected by psychological barriers, our study focused on individual stocks, as they are usually the securities that investors actually trade on stock exchanges.
Following the most widely used methodologies for studying psychological barriers, we provide new evidence regarding psychological barriers in single stock prices for three of the most important emerging markets. Considering a sample period of 15 years (2000-2014), we examined the existence of the phenomenon in some of the major stocks trading in Taiwan, Brazil and South Africa.
In summary, the effects of psychological barriers on individual stocks are much less consistent than what previous studies have found regarding stock indices. The evidence is mostly scattered and only slightly significant. No relevant overall pattern was found in our tests.
Although a uniform distribution is rejected for the prices of every single stock under analysis, barrier tests show no consistent evidence of psychological barriers around round numbers for all barrier levels. Nonetheless, our test for conditional effects shows that in fact nearly half of the stocks suffered some impacts in terms of volatility around barriers. More specifically, the evidence suggests that these stocks tended to be significantly less volatile before breaching a barrier in a downward movement and then recorded significant turbulence after this point was crossed. Considering upward movements, we found a significant decrease in volatility near round numbers.
All in all, our main result is that there are no consistent barriers in single stock prices, in spite of the documented effects on volatility. Our findings are thus in line with the ones of Dorfleitner and Klein (2009), who focused only on German stocks, and also with the results of Cai et al. (2007) for price resistance in Chinese stocks.
Round numbers do not appear to be of special importance at least for investors in single stocks. However, the implications of these results for the debate about market efficiency are, in our view, ambiguous. It is true that the absence of psychological barriers is consistent with a highly informationally efficient market. But what is often disregarded is that the absence of psychological barriers would also be what one would expect to observe in a financial market dominated by noise traders and where prices were dictated by complex patterns of shifting fads and moods.
The implications of the results presented here are somewhat problematic for standard risk-return equilibrium models that predict a positive relationship between these two variables. The findings regarding the barrier hypothesis tests presented in Table 10 above show that in about half of the stocks under analysis there were statistically significant changes in the volatility of prices between the pre-crossing and the post-crossing periods. Changes in variance, as a proxy for risk, should of course be associated with changes in expected returns. However, only in the case of two stocks (Chung Hwa Pulp and Eletrobras) was there a contemporaneous and statistically significant change in the returns observed between these two periods. This leads us to conclude that the relationship between risk and return became weaker around the psychological barriers for an important number of stocks in the sample.
270
Rev. Bras. Gest. Neg. São Paulo v.20 n.2 apr-jun. 2018 p.248-272
Júlio Lobão / João Fernandes
regarding employment, inflation and interest rate is scheduled to be announced. On other days, the beta is unrelated or even negatively related to average returns. The results of our study suggest an additional circumstance were the relationship between risk and return tends to be weaker: in the proximity of psychological barriers (in our case, round numbers).
The significance of our results for those investors who use trading strategies based on round numbers as support and resistance levels is evident. The empirical evidence presented here does not support the possibility of obtaining abnormal positive returns with such strategies.
Lastly, there is the issue of reconciling the results obtained in the study of single stocks with the existing empirical evidence suggesting that there are significant psychological barriers in stock indices. How is it possible that several studies have found significant barriers in stock market indices (e.g., Bahng, 2003; Cyree et al., 1999; Donaldson & Kim, 1993; Koedijk & Stork, 1994; Woodhouse et al., 2016) when the evidence on barriers in individual stocks is so fragile? There are, in our opinion, at least two possible non-mutually exclusive explanations. First, psychological barriers are not a statistically significant phenomenon nowadays because by exploiting this anomaly investors have eliminated it (e.g., Marquering, Nisser, & Valla, 2006; Schwert, 2003). The second explanation has to do with a problem that Dorfleitner and Klein (2009) referred to as “publication bias”. According to these authors, studies with significant results are more likely to be published, whereas studies without such results are often not published. The lack of published studies with non-significant results would then lead to a biased perception that psychological barriers are a common phenomenon in financial markets.
With this article, we hope to contribute to tackling the problem identified by Dorfleitner and Klein (2009).
References
Aggarwal, R., & Lucey, B. M. (2007). Psychological barriers in gold prices? Review of Financial Economics, 16(2), 217-230.
Bahng, S. (2003). Do psychological barriers exist in the stock price indices? Evidence from Asia’s emerging markets. International Area Studies Review,6(1), 35-52.
Bertola G., & Caballero, R. J. (1992). Target zones and realignments. American Economic Review, 82(3), 520-536.
Brock, W., Lakonishok, J., & LeBaron, B. (1992). Simple technical trading rules and the stochastic properties of stock returns. Journal of Finance, 47(5), 1731−1764.
Burke, S. (2001). Barriers in U.S. Benchmark Bonds. [Unpublished manuscript], Vancouver.
Cai, B. M., Cai, C. X., & Keasey, K. (2007). Influence of cultural factors on price clustering and price resistance in China’s stock markets.
Accounting and Finance, 47(4), 623-64.
Chen, M. & Tai, V. W. (2011). Psychological barriers and prices behaviour of TAIFEX futures.
Global Economy and Finance Journal, 4(2), 1-12.
Cyree, K. B., Domian, D. L., Louton, D. A., & Yobaccio, E. J. (1999). Evidence of psychological barriers in the conditional moments of major world stock indices. Review of Financial Economics, 8(1), 73-91.
Ceuster, M. J. K., Dhaene, G., & Schatteman, T. (1998). On the hypothesis of psychological barriers in stock markets and Benford’s Law.
Journal of Empirical Finance,5(3), 263-279.
Grauwe, P., & Decupere, D. (1992). Psychological barriers in the foreign exchange markets. Journal of International and Comparative Economics, 1(2),
271 Rev. Bras. Gest. Neg. São Paulo v.20 n.2 apr-jun. 2018 p.248-272
Psychological Barriers in Single Stock Prices: Evidence from Three Emerging Markets
Donaldson, R. G. (1990a). Psychological barriers in asset prices, rationality and the efficient market hypothesis [Working Papers, n. 114]. Princeton Financial Research Center Memorandum.
Donaldson, R. G. (1990b). International evidence on psychological barriers in asset prices and the efficient market hypothesis [Working Papers, n. 116]. Princeton Financial Research Center Memorandum.
Donaldson, R. G., & Kim, H. Y. (1993). Price Barriers in the Dow Jones Industrial Average.
Journal of Financial and Quantitative Analysis, 28(3), 313-330.
Dorfleitner, G., & Klein, C. (2009). Psychological barriers in European stock markets: Where are they? Global Finance Journal, 19(3), 268-285.
Dowling, M., Cummins, M., & Lucey, B. M. (2016). Psychological barriers in oil futures markets. Energy Economics, 53, 293-304.
Fama, E., & French, E. F. (1998). Value versus Growth: The International evidence. Journal of Finance, 53(6), 1975-1999.
Fama, E., & French, E. F. (2004). The Capital asset pricing model: Theory and evidence. Journal of Economic Perspectives, 18(3), 25-46.
George, T. J., & Hwang, C. (2004). The 52-week high and momentum investing. Journal of Finance, 59(5), 2145-2176.
Jang, B., Kim, C., Kim, K. T., Lee, S., & Shin, D. (2015). Psychological barriers and option pricing.
Journal of Futures Markets, 35(1), 52–74.
Koedijk, K. G., & Stork, P. A. (1994). Should we care? Psychological barriers in stock markets.
Economics Letters,44(4). 427-432.
Ley, E., & Varian, H. R. (1994). Are there psychological barriers in the Dow-Jones index?
Applied Financial Economics, 4(3), 217-224.
Lobão, J., & Pereira, C. (in press). Psychological barriers at round numbers in stock market indices: Evidence from four Southern European countries.
Cuadernos de Economía – Spanish Journal of Economics and Finance.
Lucey, M. E., &¨O’Connor, F. A. (2016). Mind the gap: Psychological barriers in gold and silver prices. Finance Research Letters, 17, 135-140.
Marquering, W., Nisser, J., & Valla, T. (2006). Disappearing anomalies: A dynamic analysis of the persistence of anomalies. Applied Financial Economics, 16(4), 291−302.
Mitchell, J., & Izan, H. Y. (2006). Clustering and psychological barriers in exchange rates. Journal of International Financial Markets, Institutions and Money, 16(4), 318-344.
Savor, P., & Wilson, M. (2014). Asset pricing: A tale of two days. Journal of Financial Economics, 113(2), 171-201.
Schwartz, A. L., Van Ness, B. F., & Van Ness, R. A. (2004). Clustering in the futures market: Evidence from S&P 500 futures contracts. Journal of Futures Markets,24(5), 413-428.
Shawn, L. K. J., & Kalaichelvan, M. (2012). A critical evaluation of the significance of round numbers in European equity markets in light of the predictions from Benford’s law. International Research Journal of Finance and Economics, (95),
196-210.
Schwert, G. W. (2003). Anomalies and Market Efficiency. In G. Constantinides, M. Harris, & R. Stulz (Eds.), Handbook of the Economics of Finance.
(Cap. 15, pp. 937-972). Amsterdam ; Boston : Elsevier/North-Holland.
Shiller, R. J. (2015). Irrational Exuberance (3rd
ed.). Princeton, N.J. : Princeton University Press.