AN EFFICIENT EXPERIMENTAL METHODOLOGY FOR
VISCOELASTIC COMPLEX MODULUS IDENTIFICATION
Rui A.S. Moreira∗ and José Dias Rodrigues†
∗Departamento de Engenharia Mecânica. Universidade de Aveiro
Campus Santiago. 3810-193 Aveiro. Portugal
e-mail: rmoreira@mec.ua.pt, web page: http://www.mec.ua.pt
†Departamento de Engenharia Mecânica e Gestão Industrial
Faculdade de Engenharia da Universidade do Porto R. Dr. Roberto Frias, s/n. 4200-465 Porto. Portugal e-mail: jdr@fe.up.pt, web page: http://www.fe.up.pt
Keywords: Viscoelastic Materials, Complex Modulus, Experimental Characterization
Abstract. The numerical simulation of viscoelastic damping treatments requires a correct
identification of the complex modulus of the viscoelastic materials. In this work, a simple and accurate experimental setup and methodology to identify the complex modulus of viscoelastic materials in shear are presented, tested and validated using commonly applied viscoelastic materials. The test system is based on the direct complex stiffness measurement. A numerical processing analysis is performed on the measured data in order to verify the validity of the measurement and to construct the usual nomogram representation of the complex modulus. This direct approach avoids the identification limitations of the vibrating beams technique usually applied in the viscoelastic complex modulus characterization.
1 INTRODUCTION
The numerical simulation of viscoelastic damping treatments requires an accurate numerical representation of the dynamic properties of the viscoelastic material, namely its complex modulus. However, this property is strongly dependent on the frequency and temperature of the treatment application.
The usual approach, using vibrating beams, identifies the viscoelastic properties from the damping and flexural modification imposed by a viscoelastic layer that materializes the core of sandwich beam specimens [1]. However, this identification methodology is based on a simplified and approximate analytical model of the composite beam [8]. Moreover, its accuracy is closely related to the relative modification of the sandwich beam structure, which is, in general, very reduced. Finally, the data is obtained only for discrete frequency values corresponding to the natural frequencies of the specimens.
The direct identification methodologies [3, 4, 5] are actually a more interesting approach since the viscoelastic material properties are identified directly from the measured dynamic response of a discrete system with a viscoelastic spring, usually materialized by a shear deformed viscoelastic layer. Despite the simplicity associated with the analytical model and the identification procedure, the development of an efficient experimental setup, representing a discrete dynamic system with a single degree of freedom, is not a simple task and it requires restraining the spurious degrees of freedom. In this work, a special purpose experimental setup is proposed to provide a reliable and simple complex modulus identification tool. The system is based on the direct complex modulus identification of viscoelastic samples in shear from the broadband frequency response.
2 ANALYTICAL MODEL
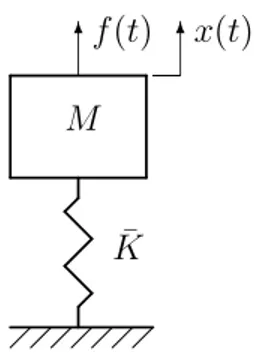
By using a direct approach, the identification procedure is based on the characterization of a complex value spring that represents the viscoelastic specimen (Figure 1).
M
¯ K
6f(t) 6x(t)
Figure 1. Single degree of freedom analytical model
The differential equation of motion for this single degree of freedom system, excited by the dynamic force f(t), is defined as:
Mx(t) + ¯¨ Kx(t) = f (t) (1)
where M and ¯K represent, respectively, the mass of the system and the spring complex valued
stiffness, x(t) is the displacement and ¨x(t) is the time second derivative.
Assuming stationary harmonic motion with frequency ω and complex amplitude ¯X, Equation
(1) can be rewritten as:
£ − ω2
M + ¯K¤ ¯
X = F (2)
and, therefore, the frequency response function (receptance function) of the dynamic system can be defined as:
α(ω) = X¯
F =
1
The complex value stiffness of the viscoelastic specimen can be directly determined through the inverse frequency response function, the dynamic stiffness function Z, as:
¯
K = ω2M + Z (4)
from which it results:
K(ω) = ω2
M +REAL(Z) (5a)
η(ω) = IMAG(Z)
ω2M +REAL
(Z) (5b)
where η represents the loss factor of the viscoelastic material and K represents the real part of the complex value stiffness, which can be directly related to the storage shear modulus G0 of the viscoelastic material, the specimen thickness h and the shear area AS through the relation defined as:
K = G0AS
h (6)
3 EXPERIMENTAL SETUP
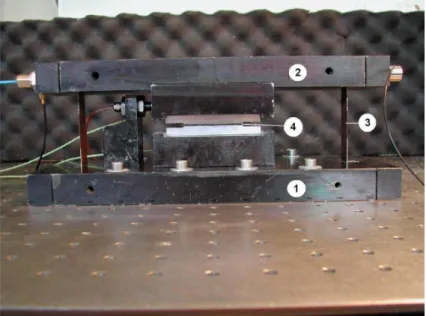
The experimental setup illustrated in Figure 2 presents the proposed experimental assembly that is capable of representing the single degree of freedom system to be used along the identification process [6].
Figure 2. Experimental assembly
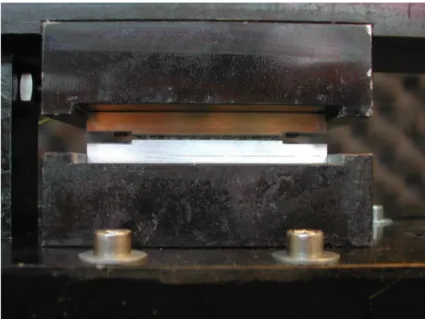
The upper bar (2) represents the moving mass while the thin viscoelastic layer (4) introduced between two rigid blocks, as depicted in Figure 3, represents the complex value stiffness of the discrete dynamic system. Effectively, one of these rigid blocks is mounted on the moving mass
while the other one is mounted on the fixed base (1), thus leading the viscoelastic specimen to deform in shear. The two thin lamina springs (3) located at both ends of the moving mass present very low stiffness, although they provide the necessary restraining condition to minimize the effects of spurious degrees of freedom and, thus, a single degree of freedom dynamic system is obtained.
Figure 3. Viscoelastic specimen
The excitation is provided by an electrodynamic shaker (Ling Dynamic Systems - model 201) linked to the moving mass through a stinger and driven by a random signal generated by the signal generator of a spectral analyzer (Brüel & Kjær - model 2035) and amplified at a power amplifier (Ling Dynamic Systems - PA25E). The applied excitation force is measured using a piezoelectric force transducer (Brüel&Kjær - model 8200). The response of the moving mass is measured through a piezoelectric accelerometer (Brüel& Kjær - model 4371) as well as a proximity probe (Philips PR6423). The signal conditioning and the frequency response functions determination are performed by the referred spectral analyzer.
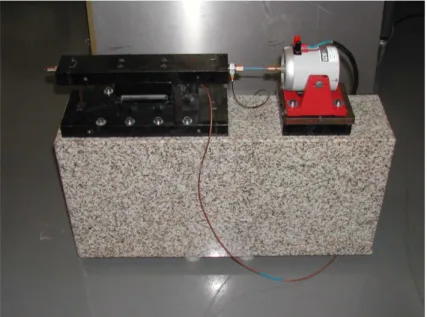
The experimental setup, including the electrodynamic shaker, is rigidly assembled on a granitic stone block (Figure 4) supported by four cylindrical silicone rubber pads to minimize the rigid body modes frequencies of the assembly.
In order to make use of the temperature-frequency equivalence principle [7], the assembly is introduced into a temperature controlled thermal chamber, providing near isothermal conditions between 0◦C and 35◦C (shaker operation range). The temperature of the viscoelastic material is evaluated using two thermocouple probes located near the specimen.
Figure 4. Experimental setup
4 EXPERIMENTAL DATA
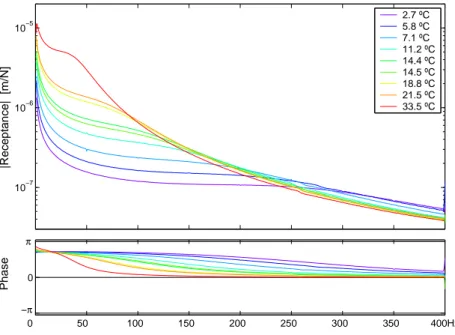
After signal conditioning, the response signals of the moving mass, provided simultaneously by the accelerometer and by the proximity probe, and the excitation force signal, provided by the force transducer, are used to calculate the frequency response functions of the experimental dynamic system. These frequency response functions, evaluated at each temperature step, are finally used to identify the complex modulus distribution along the frequency range of the analysis for the selected temperature using Equation (4) or Equation (5). Figures 5 and 6 represent, respectively, the receptance and accelerance functions measured in the bandwidth [0-400]Hz at nine temperature steps between 2.7 and 33.5◦C using a 0.57mm x 480mm2 3M ISD112 viscoelastic material specimen.
Despite the theoretical redundancy provided by both response transducers, previous experimental tests pointed out that the proximity probe, which provides directly a relative motion measurement, is more sensible to the high frequency noise generated by the thin springs, the stinger and shaker trunnion. On the other hand, the signal provided by the accelerometer contains, obviously, the rigid body modes effects at low frequencies. Therefore, by using both transducers, it is possible to enlarge the useful frequency range.
0 50 100 150 200 250 300 350 400Hz 0 π −π Phase 10−7 10−6 10−5 |Receptance| [m/N] 2.7 ºC 5.8 ºC 7.1 ºC 11.2 ºC 14.4 ºC 14.5 ºC 18.8 ºC 21.5 ºC 33.5 ºC
Figure 5. Measured frequency response functions: receptance functions
0 50 100 150 200 250 300 350 400Hz 0 π −π Phase 10−3 10−2 10−1 100 |Accelerance| [ms − 2/N] 2.7 ºC 5.8 ºC 7.1 ºC 11.2 ºC 14.4 ºC 14.5 ºC 18.8 ºC 21.5 ºC 33.5 ºC
Figure 6. Measured frequency response functions: accelerance functions
5 DATA VERIFICATION AND VALIDATION
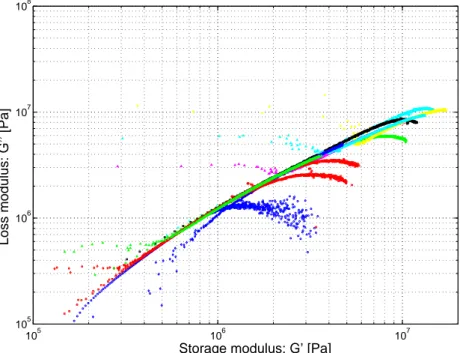
To identify and filter out possible random errors due to the high frequency noise, rigid body modes or other error sources, the identified complex modulus functions are plotted in a useful
graphical representation called Wicket Plot. Figure 7 represents the Wicket plot of the identified complex modulus functions for the 3M ISD112 specimen, where the storage modulus functions are plotted against the corresponding loss modulus functions.
105 106 107
105 106 107 108
Storage modulus: G’ [Pa]
Loss modulus: G’’ [Pa]
Figure 7. Wicket plot of the identified complex modulus functions
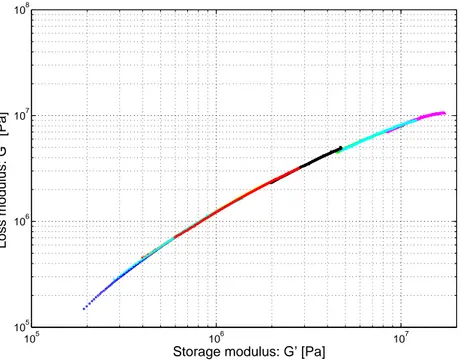
This graphical representation stands out the master curve of the complex modulus, being possible to identify erroneous data sets and the representative frequency range of each complex modulus function. Filtering data by removing all the erroneous points it is possible to obtain a reliable data set of complex modulus, as illustrated in Figure 8, which can be used to characterize the considered viscoelastic material.
The set of complex modulus functions, identified at different temperatures, should finally be correlated, using the frequency-temperature equivalence principle, to identify the shift factor
αT distribution of the material [7]. The shift factor relationship is described by the Arrhenius equation as: log [αT(T )] = TA µ 1 T − 1 T0 ¶ (7) where T is the absolute temperature of each data set, T0is the reference temperature and TAis identified by fitting the experimental data to the model.
105 106 107 105
106 107 108
Storage modulus: G’ [Pa]
Loss modulus: G’’ [Pa]
Figure 8. Wicket plot of the filtered complex modulus functions
6 RESULTS
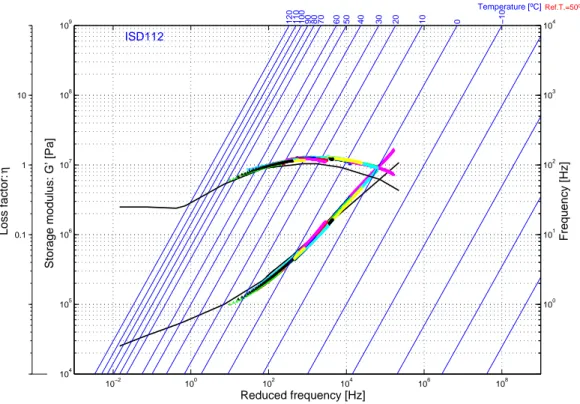
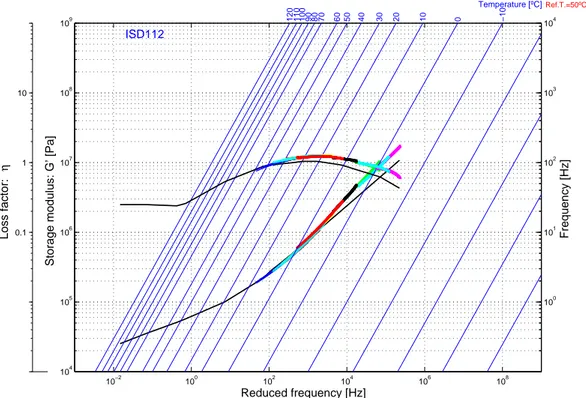
The identified complex modulus functions, using the identified shift factor distribution, can be represented in a unified and universal representation, the so-called reduced-frequency nomogram [7]. This representation is very useful and broadly applied since it represents simultaneously the frequency and the temperature effect on the complex modulus of a viscoelastic material by a single pair of curves: one for the storage modulus and another representing the loss factor distribution.
Figure 9 overlaps the nomogram of the 3M ISD112 viscoelastic material provided by the manufacturer (black curves) [8] with the identified nomogram using a 0.57mm x 480mm2 specimen made of the same material (color curves).
Figure 10 identically represents the identified and the published nomograms for the same material using a second experimental specimen with different dimensions (0.65mm x 970mm2). Both nomograms, obtained with different specimens of the same material, are identical, which demonstrates that measurements are consistent, and they well agree with the one published by the viscoelastic material manufacturer.
10−2 100 102 104 106 108 104 105 106 107 108 109
Storage modulus: G’ [Pa]
Reduced frequency [Hz] −10 0 10 20 30 40 50 60 70 80 90 100 110 120 Temperature [ºC] Ref.T.=50ºC 100 101 102 103 104 Frequency [Hz] ISD112 0.1 1 10 Loss factor: η
10−2 100 102 104 106 108 104 105 106 107 108 109
Storage modulus: G’ [Pa]
Reduced frequency [Hz] −10 0 10 20 30 40 50 60 70 80 90 100 110 120 Temperature [ºC] Ref.T.=50ºC 100 101 102 103 104 Frequency [Hz] ISD112 0.1 1 10 Loss factor: η
7 CONCLUSION
The usually applied technique to identify the complex modulus of soft viscoelastic materials, using vibrating beams with damping treatments, provides an indirect measuring approach based on the evaluation of the perturbation effects produced by the damping layer on the modal parameters of the beams. Moreover, the identification process is not simple as it uses a set of approximate equations or assumed field numerical models.
The application of a discrete dynamic system, describing a single degree of freedom analytical model, can provide a more reliable identification methodology since it is based on the direct characterization of the complex stiffness materialized by a viscoelastic material specimen usually in shear deformation. However, the development of an experimental setup, capable to represent such a simple model, requires restraining of all the spurious degrees of freedom.
The proposed experimental setup provides such restraining effect using a set of two thin lamina springs to guide the mass motion of the system. The mounting of the experimental setup on a rigid and heavy stone block supported by elastic pads is also effective to minimize the system rigid body modes effects as well as to attenuate the effects of ground noise.
The identification methodology is capable to describe directly the shear complex modulus of a selected viscoelastic material, usually applied in constrained and integrated viscoelastic treatments, providing results similar to those published by the material manufacturer.
8 ACKNOWLEDGMENT
The authors gratefully acknowledge 3M Company for providing the viscoelastic materials used in this work.
REFERENCES
[1] ASTM, E756-98 standard test method for measuring vibration-damping properties of materials, Annual Book of ASTM Standards, V. 04.06, ASTM (1998).
[2] D. Ross, E.E. Ungar and E.M. Kerwin Jr., Damping of plate flexural vibrations by means of viscoelastic laminae, Structural Damping, ASME publication, New York, USA, 49-88 (1959).
[3] B.R. Allen, A direct complex stiffness test system for viscoelastic material properties,
Proceedings of 3th Smart Structures and Materials (SPIE), San Diego, CA, USA, February
(1996).
[4] G. Kergourlay and E. Balmès, Caractérisation de films viscoélastiques em fréquence, température et précontrainte, GIENS 2003, Giens, France, May (2003).
[5] G. Ramorino, D. Vetturi, D. Cambiaghi, A. Pegoretti and T. Ricco, Developments in dynamic testing of rubber compounds: assessment of non linear effects, Polymer testing, 22, 681-687 (2003).
[6] R. Moreira, Modelação e análise de tratamentos viscoelásticos multi-camada para controlo
passivo de vibrações, PhD Thesis, Faculdade de Engenharia da Universidade do Porto,
[7] D.I.G. Jones, Handbook of viscoelastic vibration damping, Jonh Wiley & Sons, UK (2001). [8] 3M, ScotchDamp TM vibration control systems, 3M Industrial Specialties division, St. Paul,