Subspace identification of wind turbine shaft vibrations
measured with a piezoelectric sensor
Dominik Kujawa1, Tomasz Zawadzki2
1Institute of Control and Computation Engineering University of Zielona Góra
ul. Podgórna 50, 65-246 Zielona Góra, Poland [email protected],[email protected]
http://www.uz.zgora.pl 2Girne Amerikan Üniversitesi,
Universite Caddesi, P.K. 5,
Karmi Kampüsü, Karaoğlanoğlu, Girne / KKTC [email protected]
Abstract
The paper presents a new approach to the parameter identification of a wind turbine shaft vibrations measured with piezoelectric sensor. The system order and unknown processes matrices are determined using the wind force as the model input and wind turbine shaft vibrations as the model output. The identified model can be used to estimate the shaft vibrations and design an early damage monitoring system. The real system results have been presented.
Keywords: state space models, subspace methods, identification algorithms, parameter estimation.
1. Introduction
The increasing demand for electricity along with the diminishing world’s energy resources results in increasing electricity acquiring from alternative sources such as solar energy, rivers water flow and wind energy which is known for ages when man learned to use the wind to run various types of devices. Wind power is by far the fastest growing and most common used technology of electrical energy production from renewable sources.
The contemporary designs of wind turbines are technically advanced high-efficiency devices. In order to maximize the efficiency, more efficient aerodynamic profiles are developed and the latest technologies for bearing and shaft materials are applied. Currently, the efficiency of wind turbines is similar to the efficiency of coal power plants and is approx. 30%, with 25% of the capacity (optimal wind conditions). The rapid development of technology allows to build more efficient wind turbines with higher power, but it involves an increase in the size of the structure, and hence higher costs of the construction and exploitation [1], [2].
Large structures are exposed to different kinds of failures, and downtime, in turn, is caused by their removal would require substantial financial costs. Removing and
replacing defective parts at heights of tens of meters is a very complex operation. It becomes even more complicated when the workplace of turbines are open waters of the sea [3], [4].
The wind turbine shaft, into which rotor blades are attached, is particularly vulnerable to the damage. Subjected to a torsion force, a shearing stress is produced in the shaft. Due to a high price of materials used in the manufacture of a shaft, they show high mechanical strength properties.
The damage detection method proposed in the paper involves the measurement and analysis of dynamic real time parameters of the shaft (during normal operation of the plant), enabling an early detection of damage or providing with the information about the possibility of such damage in the future. The diagnostic system in newly designed structures is often an integral part of the structure of wind turbine. The monitoring of the particular parameters allows one to create the conditions to guarantee trouble-free operation for a predetermined time, or even extend the life-cycle of the part (alignment, etc..). In the event of damage, a quick reaction minimizes the impact of damage to other components, respectively. The development and implementation of such systems is of vital interest to the leading companies in this field. The use of the study results will allow to significantly reduce operating costs through optimal planning technical maintenance, increasing safety and reducing environmental hazards that may arise during the removal of the consequences of a possible failure simultaneously [5].
assessment provides non-destructive testing means which can detect damage, thus preventing a major failure. These methods include, among others, ultrasound resonant method, acoustic emission, infrared techniques, radiography. The used techniques are based on signal processing methods such as wavelet transforms, neural networks and genetic algorithms [6], [7].
The new approach proposed in this paper uses subspace identification algorithm and to build the system model, the input-output signals are acquired from a piezoelectric sensor and a wind force sensor. Signal acquisition based on a group of vibration methods analyze dynamic parameters of the structure. At the moment of damage of property structures, factors such as: stiffness, mass, damping change as well. Thus, the modal parameters are changed (natural frequency, damping modal). Based on the input-output data analysis, changes in the object can be detected [4].
Vibratory methods are mainly based on the characteristics of natural object vibrations, for example: natural frequencies or vibration characters. The damage location and its size can be determined by finding the difference between the dynamic characteristics of damaged and undamaged state. In many studies, the natural frequency of the structure is used to show damage to the structure. The advantage of this method is the ease and accuracy of measurement. Changing the natural frequency of the structure indicates occurrence of the damage [8].
Prediction error identification algorithm and the N4SID algorithm can be used to determine the vibration model of an undamaged shaft of a wind turbine.
Subspace algorithms comprise of two steps [9], [10], [11], [12], [13]. In the first step, a weighted projection of the row space of data Hankel matrices is performed and the system order and the extended observability matrix are obtained straightforwardly from the input-output signals. The second step, in turn, determines the unidentified system matrices either by means of determining the state sequences and combining them with the input-output signals [14], [15] or determining the matrices A and C directly from the extended observability matrix and using them to determine the remaining system matrices [16], [17]. Subspace methods do not require any canonical parameterization. They are an interesting alternative to the well-known prediction error methods due to a simple and general parameterization in the Multiple-Input Multiple-Output (MIMO) case. No nonlinear optimization is necessary and reliable state-space models for MIMO dynamic systems are derived directly from the input-output data [18]. Moreover, the computational complexity of subspace methods is modest in comparison to the well-known prediction error methods [19], [20].
The subspace identification approach proposed in the paper uses appropriate Hankel matrices built from the measured input-output signals that are susceptible to vibration frequencies and the wind force.
To detect a fault, the algorithm analyzes the values of the actual system outputs and compares them with the corresponding behavior of the model built using the input-output data acquired before the fault occurrence.
In the deterministic-stochastic approach, the disorder of construction can be treated as an additional excitation causing the change in the system output. During signal measuring, we encounter the problem of noise, which may result from imperfections of measuring equipment. This is particularly applicable for low damage, and hence a small change in a signal which may be indistinguishable from noise. In this case, the proposed subspace identification method is appropriate as the possibility of damage can be analyzed.
The remaining of the paper is organized as follows. Section 2 presents the wind turbine experimental research.
The identification problem is formulated and the proposed solution based on subspace algorithm is presented in Sections 3 5. Section 6 presents the identification results based on a real system input-output data. Conclusions are given in Section 7.
2. Experimental wind turbine measurements
The experimental wind turbine has been mounted on the roof of a dwelling house, Fig. 1.Fig. 1. Wind turbine mounted on the roof of a house.
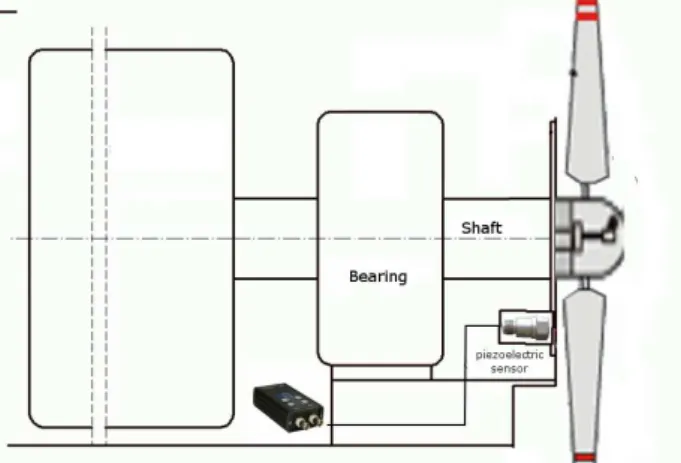
MTN Vibration sensors are made of stainless steel for continuous monitoring of vibration in difficult conditions. The electronics inside the sensor is enclosed in a Faraday cage and insulated to minimize noise. The sensor has IP67 standard, two-wire 4-20 mA output, proportional to the range of the transmitter. It is equipped with a 2-pin MS, 4-pin M12 connector and braided ETFE stainless steel cable [21].
Fig. 2. Overview scheme showing connection of piezoelectric sensor components to the module.
A two-channel data acquisition module designed for use with IEPE sensors is used in the system part. The device inputs are configured as AC. The current input type is indicated by the corresponding panel LED. The inputs can be switched using buttons. The device is fully powered by the USB port. Its small size and weight make the device easy to use.
The module has an additional amplification (1,10,100) for each channel indicated by a panel LED and switched using buttons. It also has an exceeding the input voltage range gauge for both channels also indicated by LEDs mounted on the panel [22].
3. Deterministic discrete processes
Consider the state-space model [20] of a discrete linear dynamical process of the following form:
) ( ) ( ) 1
(p Ax p Bu p
x (1)
) ( ) ( )
(p Cx p Du p
y (2)
where:
p 1 Z
0 – the independent temporal variable,
n
R p
x( ) – the state vector,,
l
R p
y( ) – the output vector,
m
R p
u( ) – the input vector,
A,B,C,D– matrices of appropriate dimensions.
To complete process description, it is necessary to specify the initial condition [6], [13]:
dx0 (3)
where dRn is a vector with known constant entries. Define the following Hankel block matrices [2]:
def i |
U021
1 2
1 0
i
U U U
Y0|2i1def
1 2
1 0
i
Y Y Y
where
)] 1 ( ) 1 ( ) (
[
uk uk uk j
Uk
)] 1 ( ) 1 ( ) (
[
yr yr yr j
Yk
Define also the Hankel block matrices:
f p i i|
|i
U U U
U
1 2
1 0
-f p i | i
|i
U U U
U
12 1
0
f p i i
i
Y Y Y
Y
1 2 |
1 | 0
f p
i i
i
Y
Y
Y
Y
1 2 |1
| 0
The number of block rows i should be larger than the maximum order of the system and to use all data samples, the number of column should be equal to 2i1 [13]. Define block Hankel matrices Wp and Wp consisting of
p
p U
Y , and Yp,Up, respectively:
p p
p |i
|i def
|i UY UY W
W
1 0
1 0 1 0
p p p
Y U W
xi ... xi j
Xi def () ( 1)Define the extended observability matrix Γi and the reversed extended controllability matrix i
1 2 i def i CA ... CA CA C Γ
A B ... AB B
Δi def i1[ ] [ ][ ]
Assume also that the pair{A,C} is observable and the pair {A,B }is controllable [14], [13]. Finally, define the lower block triangular Toeplitz matrix Hi
[ ] [ ] [ ] 0 ] [ ] [ 0 ] [ ] [ 0 0 ] [ 3
2 B CA B ... D
CA ... ... ... ... ... B C B CA ... D B C ... D H i i def i
4. Identification problem
Given measurements of the input u(p) and the outputs y(p) generated by the process (1) (2) determine its order and the matrices A,B,C,D up to within a similarity transformation.
Following Theorem 1 [12], the state-space model (1) (2) can be written in a matrix form†
, U Δ X A X , U H X Γ Y , U H X Γ Y p i p i f f i f i f p i p i p (4)
5. Stochastic discrete processes
Consider the state-space model of a discrete linear dynamical process of the following form
x(p1)Ax(p)Bu(p)w(p) (5) y(p)Cx(p)Du(p)v(p) (6)
where the covariance matrix of the zero mean white vector sequences w(p) and v(p) is
wT q wT q
SQT RS qk v
k w
E
) ( ) ( ) ( ) ( ( (7)
and
q denotes the discrete Kronecker delta.The identification problem is: given measurements of the input u(p) and the outputy(p), generated by (5) and (6), determine the system order and the matrices
D C, B,
A, up to a similarity transformation, and the covariance matrices Q, and S R.
We assume that u(p) and y(p) are uncorrelated with )
(p
w and v(p),u(p) and y(p) are persistently exciting of order 2 , and i w(p) and v(p) are not identically zero. Based on Theorem 12 [12], the combined deterministic-stochastic Algorithm 1 or its robust version can be applied to determine the process order and the unknown matrices
. , , , , ,
,B C D Q S R
A The combined deterministic-stochastic Algorithm 1 consists of the following steps [12]:
1) Calculate the oblique projection
p U f
i Y W
O / f (8)
2) Calculate the singular value decomposition
T T
T
i USV
V V S U U W O
W 1 11
2 1 1 2 1 2
1 [ ] 0 00
(9)
3) Find the order of the process (6) (7) by the inspection of the singular values in S1.
4) Calculate i from
2 1
1 1 1
1 US
W
i
(10)
5) Solve the following set of linear equations in a least squares sense for A,C andK
v w f i i i i i
i Z KU
C A Y Z † | 1 † 1 (11)
where Zi and Zi1 are the orthogonal projections
f p f
i Y / UW
and †denotes the Moore-Penrose pseudo-inverse of the matrix.
6) Using the least squares method, determine BandDfrom the following over-determined set of equations B D N K K K K i i | 2 1| 2 |1 1| 1 (14) where 0 0 0 0 0 0 0 0 0 | 2 | 2 | 2 3 | 2 2 | 2 | 2 1 | 2 2 | 2 1| 2 |1 1 |1 1 3 |1 2 2 |1 1 |1 1 1 |1 2 1| 1 1 1| 1 i i i i i l i i i i i i i i I M M M M M M M N 1 0 0 i l I (15) with i i i C A | 2 2 | 2 1| 2 |1 2 |1 1| 1 † (16)
1 1 1
†
i M M Mi
M (17)
i i K K K K K K K | 2 2 | 2 1| 2 |1 2 |1 1| 1 (18)
7) Determine Q, andS Rfrom the residuals w and v
T v T w v wT R E
S S Q (19)
6. Identification results
The combined subspace identification algorithm was tested with the experimental input-output data set. The data set was created in the following way: for 1280 values, each value consists of 20 averaged trials where each trail contains the wind force and vibrations values. The test was performed in the following way: averaged values of vibrations and the wind force, observed within a minute for a properly operating wind turbine, for the test time were included to the model construction. The observed
piezoelectric sensor values are shown in Fig. 3 and the change of wind force is shown in Fig. 4. The data acquisition time is 1280 minutes.
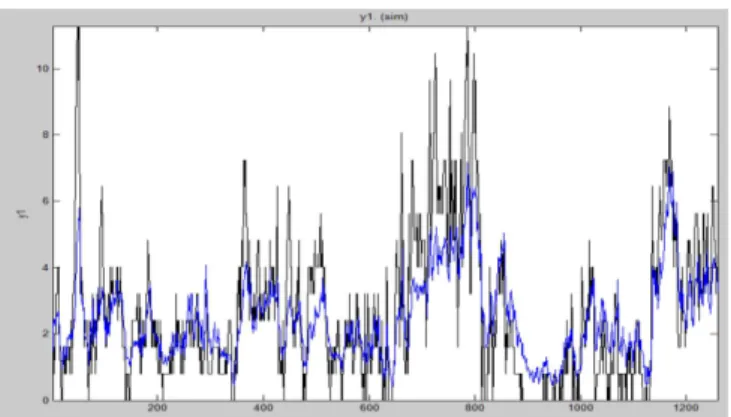
Fig. 5 shows the responses of the system and the second order model; fit to the actual values is 66%. Fig. 6 shows the 4th order model response which fit to the actual values is 89%.
0 200 400 600 800 1000 1200 1400 0 0.1 0.2 0.3 0.4 0.5 0.6 0.7
sampling interval rate (1 minutes)
sensor values rates [mm/s
2]
Sensor vibrations
Fig. 3. Sensor values of vibrations[mm/s2] with use
piezoelectric.Averaged vibration values based on 1280 passes measured by piezoelectric sensor.
Fig. 5. System vibrations rate and the second order model response.
Fig. 6. System vibrations rate and the fourth order model response.
7. Conclusions
The paper presents a new approach to the subspace identification of a wind turbine vibrations. Wind force has an influence on the vibration of the shaft, the stronger is the wind, the stronger are the vibrations. For the subspace identification, the input-output data set was created using input and output values averaged in one minute windows. In the future, models of various types of damage will be developed, e. g. rotor blades or a generator.
The identification experiments are performed on the basis of real measurement input-output data. To identify the system model, the combined deterministic-stochastic identification algorithm was applied with the wind force as the input and the vibration rate as the output.
ACKNOWLEDGMENT
The author is a scholar within Sub-measure 8.2.2 Regional Innovation Strategies, Measure 8.2 Transfer of knowledge,
Priority VIII Regional human resources for the economy Human Capital Operational Programme co-financed by the European Social Fund and the State Budget of Poland.
REFERENCES
[1] H. Z. Yang, H. J. Li and S. Q. Wang, „Damage localization of
offshore platforms under ambient excitation,” China Ocean Engineering, vol. 17, nr 4, pp. 495-504, 2003.
[2] L. M. Khoo, P. R. Mantena and P. Jadhav, „Structural damage assesment using vibration modal analysis,” Structural Health Monitoring, vol. 3, nr 2, pp. 177-194, 2004.
[3] A. M. Yan and J. C. Golinval, „Structural damage localization by combining flexibility and stiffness methods,” Engineering Structures, vol. 27, nr 12, pp. 1752-1761, 2005.
[4] C. Y. Kao and S. L. Hung, „Detection of structural damage via free vibration responses generated by approximating artificial neural networks,” Computers & Structures, vol. 81, nr 28-29, pp. 2631-2644, 2003.
[5] K. Moslem and R. Nafaspour, „Structural damage detection by genetic algorithms,” AIAA Journal, vol. 40, nr 7, pp. 1395-1401, 2002.
[6] M. L. Fugate, H. Sohn and C. R. Farrar, „Vibration-based damage detection using statistical process control,” Mechanical Systems and Signal Processing, vol. 15, nr 4, pp. 707-721, 2001.
[7] J. Lopez-Diez, M. Torrealba, A. Guemes and C. Cuerno, „Application of statistical energy analysis for damage detection in spacecraft structures,” Damage Assessment of Structures VI: Key Engineering Materials, nr 293-294, pp. 525-532, 2005.
[8] J. T. Kim, Y. S. Ryu, H. M. Cho and N. Stubbs, „Damage identification in beam-type structures: frequency- based method vs mode shape based method,” Engineering structures, vol. 25, nr 1, pp. 57-67, 2003.
[9] A Janczak and D. Kujawa, „Subspace approach to identification of linear repetitive processes,” Proceedings of the 2009 Int. Workshop on Multidimensional (nD) Systems, Thessaloniki, Greece, pp. 120–123, 2009.
[10] P. Van Overschee and B. De Moor, „A unifying theorem for three subspace identification algorithms,” Automatica, vol. 31, pp. 1853– 1864, 1995.
[11] P. Van Overschee and B. De Moor, „N4SID: Subspace algorithms for identification of combined deterministic-stochastic systems,” Automatica, vol. 30, pp. 75–93, 1994.
[12] P. Van Overschee and B. De Moor, Subspace Identification for Linear Systems: Theory, Implementation, Applications, Kluwer Academic Publishers, Boston, 1996.
[13] S. J. Qin, „An overview of subspace identification,” Computers and Chemical Engineering, vol. 30, pp. 1502–
[14] M. Verhaegen, „Application of subspace model identification technique to identify LTI systems operating in closed-loop,” Automatica, vol. 29, pp. 1027–11040, 1993.
[15] M. Verhaegen, „Identification of deterministic part of MIMO state space models given in innovation form from input-output data,” Automatica, vol. 30, pp. 61–74, 1994.
[16] L. Ljung, System Identification: Theory for the User, 2nd ed, Prentice Hall, Upper Saddle River, N.J., 1999.
[17] L. Hladowski, K. Galkowski, Z. Cai, E. Rogers, C. T. Freeman and P. L. Lewin, Experimentally supported 2D systems based iterative learning control law design for error convergence and performance, Control Engineering Practice, vol. 18, pp. 339–348, 2010.
[18] E. Rogers, K. Galkowski, and D. H. Owens, Theory and Applications for Linear Repetitive Processes, Springer, Berlin, 2007.
[20] A. Chiuso and G. Picci, „Some algorithmic aspects of subspace identification with inputs,” Int. Journal of Applied Mathematics and Computer Science, vol. 11, pp. 55–75, 2001.

![Fig. 3. Sensor values of vibrations [mm/s 2 ] with use piezoelectric. Averaged vibration values based on 1280](https://thumb-eu.123doks.com/thumbv2/123dok_br/17208401.243230/5.892.472.789.313.543/sensor-values-vibrations-piezoelectric-averaged-vibration-values-based.webp)