INÊS MARIA FERREIRA DE MORAIS CERVEIRA
WEAKFISH CYNOSCION REGALIS (PISCES: SCIAENIDAE) (BLOCH & SCHNEIDER, 1801) ECOLOGY IN ITS NON-INDIGENOUS RANGE AND ITS
POTENTIAL AS A NEW FISHING RESOURCE
UNIVERSIDADE DO ALGARVE Faculdade de Ciências e Tecnologias
INÊS MARIA FERREIRA DE MORAIS CERVEIRA
WEAKFISH CYNOSCION REGALIS (PISCES: SCIAENIDAE) (BLOCH & SCHNEIDER, 1801) ECOLOGY IN ITS NON-INDIGENOUS RANGE AND ITS
POTENTIAL AS A NEW FISHING RESOURCE
Mestrado em Biologia Marinha
Trabalho efetuado sob a orientação de: Professora Doutora Maria Alexandra Teodósio Doutor Pedro Morais
UNIVERSIDADE DO ALGARVE Faculdade de Ciências e Tecnologias
Declaração de autoria de trabalho
WEAKFISH CYNOSCION REGALIS (PISCES: SCIAENIDAE) (BLOCH & SCHNEIDER, 1801) ECOLOGY IN ITS NON-INDIGENOUS RANGE AND ITS POTENTIAL AS A
NEW FISHING RESOURCE
Declaro ser o autor deste trabalho, que é original e inédito. Autores e trabalhos consultados estão devidamente citados no texto e constam da listagem de referências incluída.
__________________________________________ (Inês Maria Ferreira de Morais Cerveira)
A Universidade do Algarve reserva para si o direito, em conformidade com o disposto no Código do Direito de Autor e dos Direitos Conexos, de arquivar, reproduzir e publicar a obra, independentemente do meio utilizado, bem como de a divulgar através de repositórios científicos e de admitir a sua cópia e distribuição para fins meramente educacionais ou de investigação e não comerciais, conquanto seja dado o devido crédito ao autor e editor respetivos.
I Agradecimentos
À minha orientadora, Professora Doutora Alexandra Teodósio, pela orientação, pelo apoio e confiança que depositou em mim desde o início e ainda pelas oportunidades que me proporcionou.
Ao meu co-orientador, Doutor Pedro Morais, pelo seu aconselhamento, no trabalho e na vida, pela exigência e por nunca duvidar das minhas capacidades.
À equipa do laboratório ECOREACH do CCMR, em particular à Vânia Baptista, pela amizade, por todo o seu apoio em todas as fases deste trabalho e por me ter acolhido em sua casa como se fosse da família. À Joana Cruz pela ajuda e pelos conselhos, mas acima de tudo pelas horas de conversa e bom humor. Sem elas o trabalho teria sido mais difícil. À Ester Dias do CIIMAR, pela sua orientação, paciência e compreensão que teve ao ajudar-me em todo o trabalho.
Ao Júlio André Cipriano da Setúbal Alive, pela sua amabilidade, por se ter disponibilizado a arranjar exemplares de corvinata-real e por nos ter ensinado a pescar no estuário do Sado.
Ao Chef Leonel Pereira do restaurante São Gabriel em Almancil, pela sua excentricidade, interesse e entusiasmo neste tema, que foram fundamentais para o desenvolvimento e divulgação deste trabalho.
Aos meus colegas de mestrado, em especial à Sara Pereira, pela sua amizade, companheirismo e pelos bons momentos experienciados.
À minha família, que me apoia e motiva sem questionar as minhas escolhas.
Ao Luis, pelo amor, por estar sempre comigo nos bons e maus momentos e sempre me incentivar a fazer o que mais gosto.
II Resumo
As espécies invasoras podem interferir em processos ecológicos previamente estabelecidos num ecossistema, existindo assim uma preocupação acrescida com as espécies que possam prejudicar populações de espécies nativas com valor comercial. É o caso da corvinata-real Cynoscion regalis (Pisces: Sciaenidae), também conhecida por corvina americana ou rainha, uma espécie nativa da costa NE da América do Norte, que estabeleceu uma população invasora no estuário do Sado, tendo já sido registada em vários pontos da Península Ibérica. Os pescadores manifestaram a sua preocupação com a competição que possa existir entre a corvinata-real e os peixes nativos com valor comercial, contudo, não há evidências científicas que demonstrem que a corvinata-real está a competir com espécies nativas por alimento e espaço. Assim, o principal objetivo deste trabalho é fornecer as primeiras informações relativas à ecologia da população de corvinata-real no estuário do Sado, enquanto os seus objetivos específicos são: i) determinar a dieta e estratégia alimentar usada pela corvinata-real, através da análise de conteúdos estomacais, bem como de três espécies nativas com valor comercial – corvina-legítima Argyrosomus regius, robalo Dicentrarchus labrax e sargo Diplodus sargus; ii) inferir a sua posição trófica e a sobreposição de nicho trófico com estas três espécies nativas, através da análises de isótopos estáveis de carbono e azoto; iii) inferir o uso do habitat da corvinata-real através da análise da química de otólitos e averiguar a sobreposição de habitat com as três espécies nativas; iv) discutir os potenciais impactos desta invasão nos recursos pesqueiros do estuário do Sado, tendo em consideração a dieta e o habitat usado pela espécie ao longo do ciclo de vida; v) avaliar o potencial da corvinata-real como um novo recurso pesqueiro, através de inquéritos realizados a consumidores voluntários, e acções de sensibilização (parceria com chefs locais e publicação de dois comunicados de imprensa).
Os resultados dos conteúdos estomacais apontam que no estuário do Sado, a corvinata-real é predadora de crustáceos (53%) (principalmente mysidaceos, carídeos, isópodes e caranguejos), peixes (45%) (principalmente peixe-rei Atherina sp. e anchova Engraulis encrasicolus e cefalópodes (2%). Um caso de canibalismo foi verificado. Assim, esta espécie parece alimentar-se dos mesmos grupos de presas e em proporção semelhante ao que acontece na região nativa. A estratégia alimentar é generalista e a população aparenta ser composta por indivíduos especialistas, ou seja, indivíduos que têm preferência por diferentes presas, havendo assim uma baixa sobreposição de presas entre
III indivíduos. Este foi certamente um fator importante que influenciou esta espécie a estabelecer-se nesta região.
Os resultados da análise de isótopos estáveis revelaram que a corvinata-real, a corvina-legítima e o robalo estão a alimentar-se no mesmo nível trófico, enquanto que o sargo está um nível trófico abaixo, uma indicação de que o sargo está a consumir presas diferentes ou em diferente proporção. Não houve uma sobreposição significativa de nicho isotópico, ou índice de Pianka (calculado com base no número e tipos de presas consumidas), entre a corvinata-real e as outras três espécies, rejeitando a hipótese de que a corvinata-real está a competir por alimento com estas espécies nativas. No entanto, a probabilidade de sobreposição de nicho foi maior com a corvina-legítima, indicando uma maior probabilidade de competição por alimento, possivelmente por serem espécies taxonomicamente próximas. A análise química dos otólitos revelou que identicamente à região nativa, a corvinata-real realiza um padrão anual de migrações, usando o estuário (até à zona de água doce) na primavera e no verão, e as áreas costeiras no inverno. Confirma-se, assim, a utilização simultânea do estuário pela corvinata-real, corvina-legitima, robalo e sargo, evidenciando a competição pelo uso do habitat.
Em relação aos potenciais impactos desta espécie noutros recursos pesqueiros, a corvinata-real poderá afectar a demografia das suas presas, algumas com valor comercial na região do estuário do Sado (ex: carapau Trachurus trachurus, anchova Engraulis encrasicolus, lula comum Loligo vulgaris, e choco comum Sepia officinalis. Poderá também competir com espécies nativas através da competição por alimento, uma vez que outras espécies também se alimentam das mesmas presas (ex:dourada Sparus aurata, sargo-do-senegal Diplodus bellottii, a anchova Engraulis encrasicolus, o carapau Trahurus trachurus, o choco comum Sepia officinalis, lula comum Loligo vulgaris, polvo comum Octopus vulgaris, golfinho-roaz Tursiops truncatus). Contudo é difícil responsabilizar a corvinata-real por algum impacto, uma vez que outros factores podem prejudicar espécies nativas, como a perda de habitat ou pesca excessiva. Há também a possibilidade de espécies nativas usarem a corvinata-real como alimento, uma questão que deverá ser abordada em estudos futuros com maiores amostragens de espécies nativas.
Os resultados dos inquéritos revelaram que esta espécie tem um grande potencial para ser bem aceite no mercado: grande parte dos consumidores demonstrou interesse em adquirir o peixe posteriormente; a maioria prefere peixe selvagem e por isso muitos optariam por adquirir a corvinata-real em vez de peixes nativos provenientes de
IV aquacultura; reconhecem que a espécie está subvalorizada (5€ kg-1) e estão dispostos a
pagar em média mais 3€ kg-1 que o preço médio actual. Verificamos também que o
principal motivo que levou os consumidores a preferirem outras espécies de peixes nativos (ex: corvina-legítima, dourada, sardinha) é a falta de informação sobre a espécie e o hábito de consumo. Assim, uma opção para contornar este conservacionismo dos consumidores será criar acções de divulgação que os informem sobre os benefícios de consumir uma espécie invasora, destacar a sua proveniência (mar), e promover o seu uso em pratos que melhorem o seu sabor e textura, nomeadamente pratos que envolvam o peixe partido, como caldeiradas ou massadas.
As acções de sensibilização criadas neste trabalho (parceria com chefs locais e publicação de comunicados de imprensa) demonstraram que existe interesse na corvinata-real e na temática das espécies invasoras, permitindo assim a promoção deste novo recurso-pesqueiro e a consciencialização dos portugueses sobre o aparecimento de espécies invasoras. Assim, a comercialização da corvinata-real tem potencial para ser optimizada e poderá vir a contribuir para a redução da população no estuário do Sado e minimizar os seus possíveis impactos. Contudo, é importante considerar os riscos e benefícios desta abordagem e incluir acções de monitorização e de divulgação que clarifiquem que os benefícios da sua comercialização não superam os benefícios do controlo da população a longo prazo.
Palavras-chave: invasões biológicas, sobreposição ecológica, isótopos estáveis, otólitos, Península Ibérica
V Abstract
Weakfish Cynoscion regalis, a species native to the NE-coast of North America has established an invasive population in the Sado estuary, and since it is being captured in large numbers in Sado estuary and it is already being sold in fish markets, anglers expressed their concern with competition between weakfish and native prize fish; however, there are no scientific evidences showing that weakfish will outcompete native species for food and space. Therefore, we determined weakfish diet through stomach content analysis, and for three native prize fish: meagre, European bass, and white seabream. Results revealed that weakfish has a generalist feeding strategy and is preying on crustaceans (53%), fish (45%) and cephalopods (2%). We inferred trophic position through isotopic carbon and nitrogen content analysis in muscle and fin tissues, and weakfish, meagre and seabass are feeding at the same trophic level, and seabream a trophic level below. There was no significant isotopic niche overlap between weakfish and the three species, although it was higher for meagre. To infer competition for space, we determined weakfish habitat use through otolith chemistry analysis that revealed an annual pattern of migrations, using the estuary in spring/summer and coastal areas in winter, confirming the simultaneous use of the estuary among weakfish and the three natives.
To evaluate the potential of weakfish as a new fishing resource, we provided inquiries to consumers and created awareness events to engage the media and assess public interest on this matter. Inquiries revealed that consumers recognize weakfish potential, since they showed interest in acquiring the fish, would pay more than the current mean price, and would opt to buy weakfish instead of farmed native fish. The feedback from the awareness events was positive, indicating that invasive species subject attracts enough interest to promote weakfish successfully and increase society’s awareness on invasive species.
Keywords: biological invasions, ecological overlap, stable isotopes, otoliths, Iberian Peninsula
VI Table of Contents Acknowledgments ... I Resumo ... II Abstract ... V Table of Contents ... VI Index of Figures ... VIII Index of Tables ...XII List of Abbreviations ... XIV
Chapter I: Introduction ...1
1. Biological Invasions ...1
1.1. Non-indigenous species and invasive species ...1
1.2. Introduction vectors in aquatic ecosystems ...2
1.3. Invasiveness of aquatic species ...5
1.4. Impacts of invasive species ...7
1.5. Detection and management of non-indigenous species ...8
2. Objectives ...10
Chapter II: Weakfish Cynoscion regalis (Bloch & Schneider, 1801): a new invasive species in Europe ...11
1. Introduction ...11
2. Materials and Methods ...16
2.1. Study area ...16
2.2. Otolith chemistry ...17
2.3. Diet ...20
2.4. Carbon and nitrogen stable isotopes ...23
3. Results ...25
3.1. Otolith chemistry ...25
3.2. Diet ...27
3.3. Carbon and nitrogen stable isotopes ratios and derived metrics ...32
4. Discussion ...34
5. Conclusion ...39
Chapter III: Weakfish as a new fishing resource: could weakfish be accepted by the Portuguese consumers? ...40
1. Introduction ...40
2. Materials and Methods ...43
VII 2.2. Awareness events ...45 3. Results ...49 3.1. Questionnaire survey ...49 3.2. Awareness events ...54 4. Discussion ...61 4.1. Questionnaire survey ...62 4.2. Awareness events ...63
4.3. Commercial harvest program to control population density ...64
5. Conclusion ...70
Chapter IV: Final considerations ...71
VIII Index of Figures
Chapter I: Introduction
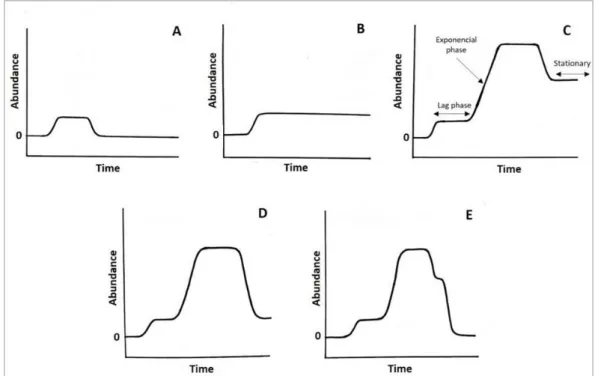
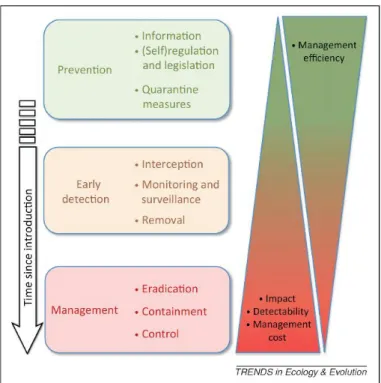
Figure 1.1. Five possible scenarios of non-indigenous species dynamics after introduction: A) establishment fails; B) established but species remains non-invasive; C) species becomes invasive after an exponential abundance increase, and then it reaches an equilibrium; D) invasion fails due to intrinsic and/or external factors, but species remains established; E) invasion and establishment fails after successful introduction.………..2 Figure 1.2. Ballast water discharge in the Sado estuary, Setúbal, Portugal.………..………3 Figure 1.3. Schematic summary of the ideal management strategy of (potentially) invasive species over time. The more time elapses since lintroduction the higher the management costs, while management efficiency reduces management cost. Retrieved from (Simberloff et al. 2013)………...………8
Chapter II: Insights into the ecology of weakfish Cynoscion regalis (Pisces: Sciaenidae) (Bloch & Schneider, 1801) in its non-native range
Figure 2.1. Locations where Cynoscion regalis (Bloch & Schneider, 1801) was reported in Europe: 1− Scheldt estuary, September 2009 (ANB 2011); 2—Gulf of Cádiz, 2011 (Bañón et al. 2017); 3—Sado estuary, in September 2014, although it was noticed in the area for “some” years before (MundoDaPesca 2014); 4—Tagus estuary, 2013 or 2014 (Abreu 2017); 5—Mira estuary, 2013 or 2014 (Abreu 2017); 6—Praia da Vieira, October 2015 (Gomes et al. 2017); 7—Ría de Vigo, June 2016 (Vigoe 2016); 8—Ría do Barqueiro, June 2016 (Vigoe 2016); 9— Guadiana estuary, June 2016 (Morais & Teodósio 2016); 10—Praia do Barranco das Belharucas, July 2016 (Morais & Teodósio 2016); 11—Ria Formosa (Jesus 2017). Map retrieved from Google Earth.………..………...…13 Figure 2.2. Location of the Sado estuary on the western coast of Portugal. The open box comprises Port of Setúbal location. Maps retrieved from Google Earth……….17 Figure 2.3. Ventral view of the optic capsules of weakfish Cynoscion regalis (Bloch & Schneider, 1801). A: Optic capsule exposed. B: Otoliths exposed after removing part of the capsule and ready to be extracted………...………18 Figure 2.4. External morphology of the inner side of a right sagitta otolith of weakfish Cynoscion regalis (Bloch & Schneider, 1801). On the left (A) the dashed line circumscribes the sulcus acusticus that comprises the ostium, the postostial lobe, precaudal depression, caudal joint and cauda. On the right (B), a schematic representation of the position of the section
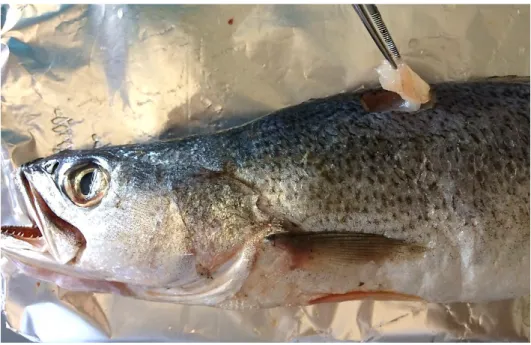
IX containing the nucleus. Arrows indicate otolith position in relation to the fish. Image adapted from (Béarez et al. 2016)………..……….18 Figure 2.5. Sectioning a weakfish Cynoscion regalis (Bloch & Schneider, 1801) otolith using a low-speed saw with a diamond-cut disc. Water was used to lubricate the saw and prevent overheating………...….19 Figure 2.6. Section of a weakfish Cynoscion regalis (Bloch & Schneider, 1801) sagitta otolith after being cut with a low speed saw. The sulcal region displays a triangular shape pointing towards the core of the otolith………....19 Figure 2.7. The New-Costello diagram where it is possible to infer a species feeding strategy, niche width contribution (BPC - between phenotype component, WPC - high within phenotype component) and prey importance. Diagram retrieved from Amundsen et al. (1996)……...…..22 Figure 2.8. Extraction of muscle from the dorsal region of weakfish Cynosicion regalis (Bloch & Schneider, 1801) for carbon and nitrogen stable isotope analysis………..…24 Figure 2.9. Size class distribution (%) of weakfish Cynosicion regalis (Bloch & Schneider, 1801), meagre Argyrosomus regius (Asso, 1801), European bass Dicentrarchus labrax (Linnaeus, 1758), and seabream Diplodus sargus (Linnaeus, 1758) samples. The numbers on top of each bar represent the number of individuals (n)………26 Figure 2.10. Otolith strontium isotopes (87Sr/86Sr) transect of a five-year-old weakfish Cynoscion regalis (Bloch & Schneider, 1801) using LA-ICPMS. The laser transect starts at the otolith core and extends to the posterior end of the otolith……….26 Figure 2.11. The feeding strategy diagram of weakfish Cynoscion regalis (Bloch & Schneider, 1801), meagre Argyrosomus regius (Asso, 1801), European bass Dicentrarchus labrax (Linnaeus, 1758), and white seabream Diplodus sargus (Linnaeus, 1758) according to the new diagram approach of the Costello method by Amundsen et al. (1996). Prey-specific abundance was plotted against the frequency of occurrence of prey in the diet of the predator. The preys whose species could not be identified were considered as one single species (e.g., “mysid n.i.” is a single species belonging to the Mysida order)………30 Figure 2.12. 13C (‰) and 15N (‰) stable isotope ratios bi-plot with overlaid standard ellipses, created by SIBER analysis, for weakfish Cynoscion regalis (Bloch & Schneider, 1801) (red), meagre Argyrosomus regius (Asso, 1801) (black), European bass Dicentrarchus labrax (Linnaeus, 1758) (green), and white seabream Diplodus sargus (Linnaeus, 1758) (blue). Top: fin samples. Down: muscle samples………..……34
X Chapter III: Weakfish as a new fishing resource: could weakfish be accepted by the Portuguese consumers?
Figure 3.1. Questionnaire survey delivered to a panel of 30 weakfish consumers……….…….44 Figure 3.2. Press release published at CCMAR’s website about the weakfish taste test done at the Algarve Mental Health Association on September 2017 (CCMAR 2017a)………….……47 Figure 3.3. Press release published at CCMAR’s website about the appearance of the Atlantic blue crab in the Guadiana estuary, Algarve (CCMAR 2017b)………...48 Figure 3.4. Age-distribution (%) of the consumers that replied to the questionnaire survey on weakfish………49 Figure 3.5. Percentage of consumers evaluating on the general traits of weakfish (appearance, flavor, and texture) as bad, indifferent, or good……….…50 Figure 3.6. Cooking methods chosen by consumers to cook weakfish at their home………...51 Figure 3.7. Comparison between the average price consumers are willing to pay for weakfish and the price that they consider to be the fair price……….52 Figure 3.8. The consumers’ preference between weakfish and other three native species (meagre, gilthead seabream, and seabass) when these natives are wild (A), farmed (B), and if the price of farmed fish is the same as weakfish (C)………..52 Figure 3.9. Preference order by which consumers ranked weakfish (A), gilthead seabream (B), horse mackerel (C), meagre (D), salmon (E), sardine (F) and sole (G). Consumers placed their preferred species in 1st place and the least favourite in 7th place……….…53
Figure 3.10. Consumers’ preference regarding fish origin: sea, aquaculture, and no preference...54 Figure 3.11. Tasting session at ASMAL canteen. Chef Avelino Falé with his staff (left) and the weakfish dish that was served – roasted weakfish with roast potatoes and red bell peppers (right)………....55 Figure 3.12. Image posted by Chef Leonel Pereira on Instagram about his experiments with weakfish at his experimental kitchen in the São Gabriel restaurant (CreativeCookGarage 2018)……….55 Figure 3.13. Seminar presented by chef Leonel Pereira at the University of Algarve showing some of the results and techniques applied to prepare weakfish and other invasive species……….…..56
XI Figure 3.14. Number of news published and broadcasted mentioning weakfish as an invasive species in Portugal, as a consequence of the press releases made by the communication department of CCMAR on September 2017, and the article published by LUSA on December 30, 2017……….…57 Figure 3.15. Interview given to Jornal das 8 on TVI aired on October 8th, 2017………59 Figure 3.16. Interview given to Portugal em Direto of RTP 1 on October 9th, 2017…………59
Figure 3.17. Some of the online news headlines retrieved from Portuguese websites, as result of the LUSA article published in December 2017………..…60 Figure 3.18. Conceptual framework on non-indigenous fish research with the potential to be commercially exploited……….68
XII Index of Tables
Chapter II: Insights into the ecology of weakfish Cynoscion regalis (Pisces: Sciaenidae) (Bloch & Schneider, 1801) in its non-native range
Table 2.1. Comparison between weakfish Cynoscion regalis (Bloch & Schneider, 1801) and the different prize fish: meagre Argyrosomus regius (Asso, 1801), European bass Dicentrarchus labrax (Linnaeus, 1758), and white seabream Diplodus sargus (Linnaeus, 1758), in respect to biology and habitat. 1- Bigelow and Schroeder (1953); 2- Froese and Pauly (2018); 3- FAO (2018); 4- Lowerre-Barbieri (1994); 5- Prista et al. (2009); 6- Shabana et al. (2012); 7- Lowerre‐Barbieri et al. (1996); 8- Bigelow and Schroeder (1953); 9- Gil et al. (2013); 10- Mercer (1989); 11- Wassef and El Emary (1989); 12- Cabral and Costa (2001); 13- Abecasis et al. (2009).………..………...….15 Table 2.2. Number of preys found in the stomachs of weakfish Cynoscion regalis (Bloch & Schneider, 1801), meagre Argyrosomus regius (Asso, 1801), European bass Dicentrarchus labrax (Linnaeus, 1758), and white seabream Diplodus sargus (Linnaeus, 1758)………….…28 Table 2.3. Comparison of mean prey taxa per species (weakfish Cynoscion regalis (Bloch & Schneider, 1801), meagre Argyrosomus regius (Asso, 1801), European bass Dicentrarchus labrax (Linnaeus, 1758), and white seabream Diplodus sargus (Linnaeus, 1758), mean abundance of prey per species, and Shannon-Weaver index based on relative abundance of taxonomic prey groups……….….29 Table 2.4. 13C (‰) and 15N (‰) of fin and muscle tissues (mean ± SD) of weakfish Cynoscion regalis (Bloch & Schneider, 1801) (red), meagre Argyrosomus regius (Asso, 1801) (black), European bass Dicentrarchus labrax (Linnaeus, 1758) (green), and white seabream Diplodus sargus (Linnaeus, 1758) (blue). Diff. is the mean difference between tissues (‰)………32 Table 2.5. Ellipse metrics (p= 0.95) statistics (TA- total area, SEA- Standard Elipse Area, SEAc-
corrected Standard Elipse Area) calculated based on the 13C (‰) and 15N (‰) values of fin and muscle tissues of weakfish Cynoscion regalis (Bloch & Schneider, 1801) (red), meagre Argyrosomus regius (Asso, 1801) (black), European bass Dicentrarchus labrax (Linnaeus, 1758) (green), and white seabream Diplodus sargus (Linnaeus, 1758) (blue)……….…..33 Table 2.6. Probability of overlap (%) of weakfish Cynoscion regalis (Bloch & Schneider, 1801) with meagre Argyrosomus regius (Asso, 1801), European bass Dicentrarchus labrax (Linnaeus, 1758) and white seabream Diplodus sargus (Linnaeus, 1758), of fin and muscle samples (p= 0.95)……….….33
XIII Chapter III: Weakfish as a new fishing resource: could weakfish be accepted by the Portuguese consumers?
Table 3.1. Hypotheses formulated in the consumers’ questionnaire survey………...45 Table 3.2. Links to twenty-two national media news mentioning weakfish, as a result of the two press releases published in September 2017 by CCMAR. Articles were published online between September 28 and October 21, 2017. They are listed in chronological order………...57 Table 3.3. Links to twenty-four national media news pieces about invasive species published after the article published by LUSA on December 30, 2017 (Lusa 2017). These articles were published online between December 30, 2017, and February 2, 2018. News are listed chronologically……….……60 Table 3.4. Summary table of the results obtained in response to the hypotheses formulated in this work………62 Table 3.5. Benefits, risks, and solutions to consider when adopting a program based on the consumption of weakfish………...69
XIV List of Abbreviations
ASMAL − Algarve Mental Health Association BPC − Between-phenotype component
eDNA − Environmental DNA FO – Frequency of occurrence
IRMS − Isotope-ratio mass spectrometry
LA-ICPMS − Laser ablation inductively coupled plasma mass spectrometry NW − Northeast
PSA – Prey specific abundance SEA − Standard ellipse area
SEAc – Corrected standard Elipse Area SIA – Stable Isotope Analysis
SIBER − Stable Isotope Bayesian Ellipses in R UK − United Kingdom
US − United States
1 Chapter I: Introduction
1. Biological invasions
1.1. Non-indigenous species and invasive species
Biological invasions and their impacts on the functioning of ecosystems has been a topic of profound debate and research over the last two decades (Sousa et al. 2011; Simberloff et al. 2013; Boltovskoy et al. 2018). The introduction of non-indigenous species may lead to the establishment of self-sustaining populations outside of their native range (Leppäkoski et al. 2002). However, non-indigenous species do not necessarily become invasive. A non-indigenous species is introduced through anthropogenic vectors (e.g., shipping, biofouling, canals, pet trade, aquaculture), which allows them to overcome biogeographical barriers that limit natural dispersal (Blackburn et al. 2014). After the introduction, individuals from a given species may perish or survive and establish a viable population. Intrinsic (e.g., phenotypic plasticity) and/or extrinsic factors (e.g., lack of natural enemies) may favour invasiveness or not, which may disrupt the established community dynamics, threatens biological diversity, and even economic loses (CBD 2017; Boltovskoy et al. 2018). There is no consensus about the definition of invasive species, since it is usually composed of subjective terms such as "negative impacts" or "threat to biodiversity" that may lead to different interpretations (Russell & Blackburn 2017), however, it is up to scientists to justify its application through scientific evidence (Colautti & MacIsaac 2004). It is relevant also to distinguish the invasion process from a natural range expansion which results from the natural movement of a species to surrounding areas of its distribution range when prevailing biotic and/or abiotic factors change (e.g., landscape fragmentation, global climate change, resource distribution, mating opportunities, predation risk, competition) (Gibbs et al. 2010).
The invasion process is divided into four stages: transport, introduction, establishment, and spread. After introduction, the dynamics of a non-indigenous species is illustrated by five possible scenarios (Figure 1.1): A) a species is introduced but establishment fails; B) a species is introduced, establishes a population but remains non-invasive; C) a species becomes invasive after establishment; D) a species is introduced, the invasion process is triggered and fails due to intrinsic and/or external factors, however the species remains established; E) a species fails to establish even after becoming invasive at an initial stage. During the invasion process (C), a species tries to succeed in
2 the new environment, and its abundance may remain low and unnoticed for an undetermined period of time – the lag phase (Mack et al. 2000; Crooks 2005), however certain conditions may trigger invasiveness and the population's abundance exponentially increases until reaching an equilibrium (Novak 2007).
Figure 1.1. Five possible scenarios of non-indigenous species dynamics after introduction: A) establishment fails; B) established but species remains non-invasive; C) species becomes invasive after an exponential abundance increase, and then it reaches an equilibrium; D) invasion fails due to intrinsic and/or external factors, but species remains established; E) invasion and establishment fails after successful introduction.
1.2. Introduction vectors in aquatic systems
Biological invasions occur when organisms are transported and introduced into new regions through introduction vectors. These vectors may determine the distribution, frequency, and even the species that are introduced (Mack et al. 2000)). In aquatic ecosystems, the most common introduction vectors are shipping (Wonham et al. 2000; Keller et al. 2011; Bailey 2015), biofouling (Frey et al. 2014; Ruiz et al. 2015), canals (Carlton & Ruiz 2005), pet trade and public aquaria (Padilla & Williams 2004; Strecker et al. 2011), aquaculture (Welcomme 1991; Naylor et al. 2001), and intentional introductions (Bax et al. 2003).
3 Introduction through shipping is common for organisms transported in the hull of ships, in ballast water or dry ballast, cargo, decks, and anchors, usually carrying many specimens of several species to form a viable inoculum (Minchin & Gollasch 2002). Ballast water specifically can transport viruses, bacteria, plankton (including meroplankton), and sediment-associated species (Minchin & Gollasch 2002) because water-intake grids only prevent the entry of large biota (Wonham et al. 2000; Seebens et al. 2013). After the establishment of a population, natural dispersal may occur, as well as secondary introductions through intraregional ship transportation (Minchin & Gollasch 2002). Ballast water is considered the largest unintentional introduction vector of marine organisms, including some of the most problematic invasions, like the zebra mussel in North America or toxic dinoflagellates in Australia (Ruiz et al. 2015). The increased size of ships and their ballast water tanks, faster travels and frequent stops at different ports increase propagule pressure because organisms are less stressed, the diversity of species and number of individuals is greater as well as the potentially affected areas (Carlton 1996). So, defining areas where ballast water can be discharged safely and areas suitable for collecting water are among the many preventive measures that try to minimize this problem (IMO 2017). Biofouling introductions are usually associated with shipping and less commonly with rafting (e.g., tsunami wrecks from Japan reached the west coast of the US) which also facilitates transoceanic dispersal of a wide variety of sessile and mobile species (Carlton et al. 2017).
4 Artificial canals that were created to shorten navigation routes are also a pathway for the introduction of non-indigenous species by connecting distinct biogeographical regions (e.g., Suez and Panama canals) (Azzurro et al. 2016) or facilitating the spread of non-indigenous species into other river basins, either naturally or not (Bij de Vaate et al. 2002).
Pet trade and public aquaria are also responsible for the introduction of fish, plants, and invertebrates (Cohen et al. 2007; Duggan 2010). They are easily accessible over the internet so transport and impacts can occur on a global scale and affect most aquatic ecosystems, except polar ecosystems. The release of pets in nature occurs because people consider it the least detrimental for the animal (Severinghaus & Chi 1999; Gertzen et al. 2008). Pet release occurs when people lack the interest in the animal, either because they became too aggressive, big, or fertile (Gertzen et al. 2008; Duggan 2010). Aquarium and ornamental trade usually choice healthy individuals that are more likely to withstand harvesting and transport harsh conditions, and yet survive and reproduce in aquariums at the final destination, being responsible for one-third of the worst aquatic invasions (Padilla & Williams 2004). The most efficient way to reduce aquarium trade introductions is prevention, which involves tracking every stage of pet trade, evaluate human behavior, species popularity (Gertzen et al. 2008), and create outreach strategies on environmental and legal consequences for those releasing pets in nature (Duggan 2010).
Intentional introductions may include species used in aquaculture, recreational angling (Savini et al. 2010), and biocontrol (Mack et al. 2000). Indeed, fish stocking for angling and aquaculture are the most significant pathways for non-indigenous fish introductions into European freshwaters during the 20th century (Welcomme 1991; Elvira & Almodóvar 2001). Species used in aquaculture are not necessarily deliberately introduced, but it usually occurs owing to fish escapees (Bartley 2011). Non-indigenous species are also used in biocontrol approaches, resulting in the attack and/or risk of extinction of non-targeted native species – sometimes even of species that should be preserved (Simberloff & Stiling 1996).
After introduction, a series of unintentional dispersal events might occur, either mediated by faunal transport – e.g., aquatic birds might transport cysts of non-indigenous species between different basins (Green & Fisher 2004); fish can disperse their parasites into other basins – e.g., the natural movements of eels in fresh, brackish, and coastal waters have accelerated dissemination and extended the range of the asian parasite Anguillicoloides crassus (Kuwahara, Niimi and Itagaki 1974) throughout Europe (Kirk
5 2003) – or by humans (e.g., biofouling of recreational boats, waders used by anglers or scientists) (Waterkeyn et al. 2010).
1.3. Invasiveness of aquatic species
Invasive species share traits and conditions that potentiate their invasiveness and that favor them in the prevailing abiotic and biotic characteristics of the non-indigenous ecosystem (Richardson & Pyšek 2006). To succeed, an invasive species must get through different stages: entering a means of transportation, survive the transport in conditions that allow it to successfully exit the transport vector, and then establish a population that may or may not become invasive.
Propagule pressure is a factor dictating establishment and eventually the invasiveness of a population. It is defined as the amount of nonindigenous individuals released in the new environment, whether in the adult or early-life stages (Johnston et al. 2009). There are two ways to achieve a high propagule pressure: a single introduction with a high abundance of individuals (propagule size) or successive introductions of fewer individuals (propagule number), and that could involve different temporal rates (Simberloff 2009). It represents the potential for introduction, so the higher the propagule pressure the higher the probability of introduction success and later on of invasion success (Johnston et al. 2009).
Some hypotheses emerged to explain what happens to a new species when it establishes into a new range. The Enemy-Release Hypothesis states that the release from natural enemies, as parasites or predators, could provide a competitive advantage to nonindigenous species, enhancing demographic expansion and invasiveness (Gendron et al. 2011). Parasites reduce host density and their body size, so leaving them behind is clearly beneficial (Torchin et al. 2001). Indeed, some non-indigenous populations are less parasitized than native populations (Torchin et al. 2003), likely owing to five main reasons: (1) most of the native parasitic fauna is left behind since only some non-indigenous hosts are being transported (Gendron et al. 2011); (2) non-non-indigenous species are usually introduced at an early-life stage, so chances of parasites co-introduction is reduced because parasites usually accumulate in larger and older organisms (Sasal et al. 1997); (3) non-indigenous species that survived until introduction are more likely to be less parasitized and/or are more resistant to diseases/parasites (Gendron et al. 2011); (4)
6 some parasites depend on intermediate hosts, but intermediate hosts are not necessarily introduced in tandem with the introduced species so the parasites will become extirpated (Torchin et al. 2003); (5) host-specific relation disables colonization by native parasites at the new location; however, this might be temporary since new host-parasite associations over time might occur (Krakau et al. 2006; Gendron et al. 2011).
Phenotypic plasticity also promotes invasiveness (Niu et al. 2012), by enabling a broad spectrum of behavioral, morphological, and physiological traits providing non-indigenous species with a competitive advantage in relation to native competitors and in a wider range of ecosystems (Knop & Reusser 2012; Weir & Salice 2012). Phenotypic plasticity enables non-indigenous species to maintain fitness in stressful conditions (robust species), to increase fitness in favorable conditions (opportunistic species), or both (robust and opportunistic species) (Richards et al. 2006). Some of the invasive species intrinsic traits are similar to traits of opportunistic species, which means that they can take the maximum advantage of the conditions provided to them. Some of these traits are linked with reproductive traits (e.g., number and size of eggs, parental care) (Bernardo 1996), higher growth rates (e.g., larger individuals are less susceptible to predation), higher number of generations (i.e., reaching a larger population faster than other native species), or dispersal capacity (e.g., swimming capacities, resistance to dissection), and even personality (Cote et al. 2010).
The receiving habitat also plays a key role in the invasion process. When a communities’ equilibrium state is surpassed, either by press- or pulse-disturbances (Bengtsson 2002), a new equilibrium state has to be reached, enabling native opportunistic species or non-indigenous species to succeed within the community (sensu priority effect hypothesis) (Young et al. 2001). Also, while establishing in a new location, the lack of evolutionary history between the non-indigenous species and the native community may result in a lack of antipredator behavior from native species (Strauss et al. 2006; Sih et al. 2010). Some “naïve species” do not know how to deal with a new species and may even approach by curiosity which confers some advantage to the non-indigenous species (Zuberi et al. 2011).
7 1.4. Impacts of invasive species
Invasive aquatic species induce ecological (Mack et al. 2000; Strayer 2012; Gallardo et al. 2016) and evolutionary (Mooney & Cleland 2001; Grosholz 2002; Lee 2002) changes in recipient ecosystems. At a species-level, non-indigenous species can alter the demography of native species by competing for resources, by preying on them, or aggressiveness (Mooney & Cleland 2001; Crooks 2002b). At the community and ecosystem levels, non-indigenous species exert their impact through multiple mechanisms: (1) limiting resources (e.g., food, space, refuge habitats, mating partner) (Mack et al. 2000); (2) disrupting the established energy flow and food web dynamics (Crooks 2002b); (3) changing disturbance regimes (Bengtsson 2002); (4) altering the biotic and/or abiotic physical structure of the ecosystem (i.e., ecosystem engineers) (Crooks 2002a; Byers et al. 2012); (5) facilitate the introduction of other non-indigenous species and incrementing their impacts, a process known as invasional meltdown (Montgomery et al. 2011). However, each introduction is different and the impacts of non-indigenous species might not always be negative. In some cases, non-indigenous species may benefit native species by serving as food resource (Crooks 2002a, b), by establishing indirect or commensal relationships (Crooks 1998), and by serving as ecosystem engineers which may provide refuge habitats and modulate abiotic factors (Simberloff & Von Holle 1999; Crooks 2002a).
Impacts might also arise from hybridization between a non-indigenous species and a native species: (1) the creation of an invasive hybrid genotype leading to the formation of an hybrid more invasive than the introduced species (i.e, heterosis or hybrid vigor) can ultimately lead to the extirpation of the native parental species (Grosholz 2002); (2) the creation of sterile hybrids, that compete for resources with native species and might lead to a native population species to decline trough the waste of native gametes (Parker et al. 1999); (3) the loss of native genotypes trough introgressive hybridization, i.e., the stable integration of genetic material from one species into another through repeated backcrossing, until the “foreign” alleles become present throughout the recipient community (Baack & Rieseberg 2007; Schierenbeck 2011). At a longer time scale, repeated hybridization might homogenize biota across biogeographic realms and thus altering evolutionary pathways (Mack et al. 2000; Crooks 2002a).
Besides the ecological and evolutionary impacts on non-native species on ecosystems, they also induce economic impacts. In UK and Ireland combined, for
8 example, the current estimate of annual cost reached 2.5 billion € (Kelly et al. 2013). Therefore, the detection and management of non-indigenous species is of paramount importance for the society.
1.5. Detection and Management of non-indigenous species
Management of invasive species requires organization and comprehension of the invasion process over time. Usually, by the time when the impacts of invasive species are noticed, the changes produced in the ecosystem are already irreversible and it substantially increases the management efforts and costs (Vilà et al. 2011). So, the optimal strategy to manage invasive species relies on prevention rather than on dealing with invasions’ impacts (Figure 1.3). Management policies that are timely taken increase efficiency and save money, a process that can be divided in three main steps: (1) prevention; (2) early detection; (3) management (Figure. 1.3).
Figure 1.3. Schematic summary of the ideal management strategy of (potentially) invasive species over time. The more time elapses since lintroduction the higher the management costs, while management efficiency reduces management cost. Retrieved from (Simberloff et al. 2013).
Prevention is achieved by promoting management actions that aim at searching for species that are prone to cause significant economic impacts (Økland et al. 2011).
9 Such actions provide information related to risk prevention, which might involve informing the society on a potential threat, as it is the case of the “Protect Your Waters Program” (StopAquaticHitchhikers 2019). This program informs society on the risks posed by non-indigenous species and aims at preventing their introduction in and dispersal into the Great Lakes (North America). Prevention also concerns producing new policies, as the new restrictive ballast water policies (i.e., pathway constriction- ballast water treatment; interception- mid-ocean ballast water exchange) that aims at reducing propagule pressure (Simberloff et al. 2013).
Early-detection policies usually involve the detection of non-indigenous species at the site of entry (e.g., harbors), owing to active monitoring and surveillance on targeted (specific species control) or non-targeted species (multiple species) (Thomsen & Willerslev 2015). Non-targeted monitoring is becoming more efficient owing to environmental DNA (eDNA) analyses, which are obtained directly from an array of sample types (e.g., water, soil, sediment) that may contain DNA molecules from skin, mucous, sperm, secretions, eggs, faeces, urine, blood, and many others (Bohmann et al. 2014; Pedersen et al. 2015). The potential of this technique is enormous mainly due to their capability to screen several taxonomic groups simultaneously and because it even allows estimating species density (Thomsen & Willerslev 2015; Pawlowski et al. 2018). If early detected, species removal is ecologically less risky than later interventions, since interspecific relations within the invaded community were not established yet (Simberloff et al. 2013), and persistence can be monitored with this technique after the adoption of containment/eradication countermeasures (Pawlowski et al. 2018). Citizen science monitoring programs based on contributions of fishers, divers, and others could also be used along with traditional monitoring programs to help detect a species presence earlier − e.g., citizen observations documented lionfish 1–2 years earlier and more frequently than traditional reef fish monitoring programs (Scyphers et al. 2015).
When non-indigenous species are detected at the invasion stage, then the only procedure left is to manage the invasion mostly due to the lower probabilities of containing, controlling, and eradicating the invasion, all of which come at a greater financial cost (Figure 1.3). Eradication often impacts non-targeted native species (Caut et al. 2009); so, research must be conducted to avoid collateral impacts and minimize reinvasion (Simberloff et al. 2013). Upon species removal, active restoration is mandatory to re-establish native communities and avoid the risk of a community being dominated by opportunistic or non-indigenous species (Gaertner et al. 2012).
10 2. Objectives
Invasive species disrupt established ecological dynamics and special concern exist on those that may impair populations of native commercial species. This is the case of weakfish Cynoscion regalis (Pisces: Sciaenidae) (Bloch & Schneider, 1801) (Actinopterygii: Sciaenidae), a species native to the NW-Atlantic Ocean that established an invasive population in the Sado estuary (Portugal, Europe). Anglers are concerned with the competition between weakfish and prize fish (e.g., meagre, seabreams, seabass). However, there are no scientific evidence showing that weakfish will outcompete these native species for food and space. Nonetheless, weakfish has already been sold in some fish markets; so, it is possible that weakfish might represent a new fishing resource for local fishing communities, as it happens with other native species. Thus, the overall objective of this thesis is to provide the first comprehensive ecological dataset on an invasive weakfish population, while the specific objectives are to:
i) determine weakfish diet and trophic position through stomach content analysis; ii) infer trophic position overlap with several prize fish – meagre Argyrosomus regius (Asso, 1801), European bass Dicentrarchus labrax (Linnaeus, 1758), and white seabream Diplodus sargus (Linnaeus, 1758) – through carbon and nitrogen stable isotopes analyses;
iii) infer weakfish habitat use through the analysis of otolith chemistry, since this technique allows to retrospectively assign habitat along the entire life of each individual analysed;
iv) discuss potential impacts of weakfish invasion upon fishery resources from the Sado estuary, considering diet and habitat use;
v) evaluate the potential of weakfish as a new fishing resource through inquiries made to voluntary consumers.
11 Chapter II: Insights into the ecology of weakfish Cynoscion regalis (Pisces: Sciaenidae) (Bloch & Schneider, 1801) in its non-native range
1. Introduction
Invasive species may threaten recipient ecosystems and induce changes in native species abundance, ecological integrity, and ecosystem functioning (Vander Zanden et al. 1999). A species that successfully establish itself in a new ecosystem means that it has been able to integrate into the food web of its new habitat, and this often happens in the form of competition. In turn, through competition, the common preferred resources may become depleted (exploitative competition), or their access is blocked (interference competition), forcing the use of less preferred resources (Mooney & Cleland 2001; Amarasekare 2002). Competitive interactions are strongly influenced by the ecological strategies used by the novel species, such as feeding strategy. For example, a generalist invader will become more likely to adapt to a new environment since it relies on a wide variety of resources, minimizing direct competition (Sax & Brown 2000; Guzzo et al. 2013), while a novel specialist will compete directly with indigenous species for their preferred resources, possibly leading to natives exclusion (Juncos et al. 2015). Consequently, putative impacts (e.g., niche narrowing, changes in fitness, physiological condition, abundance of native competitors) (Curtis et al. 2017; Britton et al. 2018) are stronger when a native species resembles the invader, as functional similarity as they may use identical feeding strategies, prefer the same resources, and use the same spaces (Hardin 1960; Ricciardi & Atkinson 2004).
Weakfish Cynoscion regalis (Bloch & Schneider, 1801) is native from the NE-coast of North America and has recently established invasive populations in the Iberian Peninsula (Morais & Teodósio 2016; Morais et al. 2017), and so far, there is no information on the ecology of the species in the new range. Weakfish was recorded for the first time in the Scheldt estuary (Belgium/The Netherlands) in 2009 (ANB 2011), however the species did not establish a population because temperature is often lower than its thermal limits (SeaTemperature 2018), since it ceases feeding at 7.9 ºC and dies at 3.3 ºC (Bigelow & Schroeder 1953). In the Iberian Peninsula, weakfish is present in the Gulf of Cádiz at least since 2011 (Bañón et al. 2017) and it has reached an invasive status in the Sado estuary at least since 2012 (MundoDaPesca 2014; Bañón et al. 2017). It was also captured in other locations along the Atlantic coast of Iberian Peninsula: Tagus
12 and Mira estuary at least since 2013 or 2014, Praia da Vieira (Leiria) in 2015, Ría de Vigo in 2016, Ría del Barqueiro in 2016, Guadiana estuary and Olhos de Água in 2016, Ria Formosa in 2017 (Morais et al. 2017) (Figure 2.1). The existence of two viable populations in the Iberian Peninsula was hypothesized, one in the Sado estuary and the other in the Gulf of Cadiz (Morais et al. 2017). Both locations are near ports with intense transoceanic shipping traffic: the Sado estuary contains a harbour (Port of Setubal) and is located 60 km north of the 6th busiest transhipment port in Europe (Port of Sines) (APPA 2018), while Guadalquivir estuary is near a US military base, a shipyard, and a large port (Porto of Cádiz) in 30 km range, reinforcing the ballast water hypothesis as one of the possible introduction vectors for this species. Aquaculture escapees/release is another hypothesis for the introduction of weakfish in the Iberian Peninsula; however, there are no records of weakfish production on Portuguese and Spanish aquaculture facilities (Morais & Teodósio 2016). This last hypothesis can only be excluded after genetic analyses. In the meantime, two facts support the “ballast water hypothesis”, (1) the short duration of transoceanic ship travel between the east coast of North America and the western Iberian Peninsula coast (nine days; SeaRates (2018)), and (2) the physiological plasticity of weakfish larvae and young-of-the-year, that may suggest that weakfish specimens circumvented ballast water exchange regulations (Able & Fahay 2010). Thus, if this hypothesis is correct, successful establishment of a weakfish population may have occurred through the rise of a viable population or through continuous and successful introductions via ballast water (Morais & Teodósio 2016). Although there are no published studies confirming the reproduction of this species in Iberian Peninsula, the size of the fish, abundance, and distribution seem to indicate it. Morais and Teodósio (2016) hypothesized three scenarios for pathways of weakfish introduction in Iberian Peninsula: (1) weakfish was introduced in three locations (Galicia, Sado estuary, and Gulf of Cádiz) followed by successful establishment, forming three localized populations; (2) weakfish was introduced in one of the extreme regions (Galicia or Gulf of Cadiz) followed by posterior dispersion; and (3) weakfish was introduced in a central area with posterior establishment and dispersal (Morais & Teodósio 2016). Since establishment of fish after introduction via ballast water is not the most common (Wonham et al. 2000; Padilla & Williams 2004) the first hypothesis (i.e., establishment in three sites) is very unlikely (Morais & Teodósio 2016). From the other two scenarios, the third was considered the most likely, since Sado estuary (the central area) is the site where anglers describe the species for the longest time, it has the highest number of non-indigenous
13 marine species in Portugal (Chainho et al. 2015), the traffic of transoceanic ships is intense (Morais & Teodósio 2016; APSS 2018), and has the abiotic conditions to favour fish survival, growth (Lankford & Targett 1994; Able & Fahay 2010), establishment and subsequent transport and migration of larvae and adults to other regions (Morais & Teodósio 2016).
Figure 2.1. Locations where Cynoscion regalis (Bloch & Schneider, 1801) was reported in Europe: 1− Scheldt estuary, September 2009 (ANB 2011); 2—Gulf of Cádiz, 2011 (Bañón et al. 2017); 3—Sado estuary, in September 2014, although it was noticed in the area for “some” years before (MundoDaPesca 2014); 4—Tagus estuary, 2013 or 2014 (Abreu 2017); 5—Mira estuary, 2013 or 2014 (Abreu 2017); 6— Praia da Vieira, October 2015 (Gomes et al. 2017); 7—Ría de Vigo, June 2016 (Vigoe 2016); 8—Ría do Barqueiro, June 2016 (Vigoe 2016); 9—Guadiana estuary, June 2016 (Morais & Teodósio 2016); 10— Praia do Barranco das Belharucas, July 2016 (Morais & Teodósio 2016); 11—Ria Formosa (Jesus 2017). Map retrieved from Google Earth.
In the native area, weakfish adults can be found in shallow waters along open sandy shores and in larger bays and estuaries (FWC 2014). Weakfish is a multiple spawner and spawns in nearshore and estuarine areas after a spring-inshore migration, leaving again in autumn to overwintering grounds (Mercer 1989; Lowerre-Barbieri 1994). So, estuarine ecosystems are used as nursery areas where juveniles migrate from high to low salinity waters in the summer, and return to high salinities in the fall, leaving estuaries in December (Mercer 1989; Lowerre‐Barbieri et al. 1996). Weakfish diet
14 consists of a wide variety of prey, that can vary with its size and includes smaller fishes (e.g., anchovies, herring, jacks), crabs, amphipods, mysids, decapod shrimps, squids, shelled molluscs, and annelid worms (Bigelow & Schroeder 1953; Merriner 1975; Stickney et al. 1975).
In the Sado estuary, anglers expressed their concern about the large numbers of weakfish that were being captured and about the possibility of being harmful to native prize fish. However, there are no scientific evidence that weakfish is outcompeting with native species. Considering that this is a recent invasion and that known impacts tend to increase in time (Simberloff 2014), it becomes imperative to study this invasion and assess the need to take control measures. In the Sado estuary, meagre Argyrosomus regius (Asso, 1801) (the most abundant Sciaenidae in the Iberian Peninsula), European bass Dicentrarchus labrax (Linnaeus, 1758), and white seabream Diplodus sargus (Linnaeus, 1758) are three native prize fish species commonly captured (Docapesca 2018). The ecological overlap between weakfish and these native species is probably high, owing to their feeding preferences (e.g., small fish, crabs, mollusks, annelids) and the timing when they use the estuary, either for reproduction, feeding or as nursery habitat (Table 1). Generally, these four species use estuaries during the warmer months, while meagre and weakfish may also compete for protection sites in holes and deep channels (Bigelow & Schroeder 1953; FAO 2018). Weakfish is smaller than meagre and seabass (Wilk 1978; Duncan et al. 2013; Froese & Pauly 2018), so weakfish larvae and juveniles may eventually serve as prey, however, their early maturation (Mercer 1989) might allow weakfish to reach a higher number of generations over time, counterbalancing the predatory effects exerted by the other species. Also, survival, growth, and fecundity of weakfish might be enhanced in the new range if their parasites were left behind (i.e., enemy-release hypothesis) (Torchin et al. 2001; Torchin et al. 2003; Colautti et al. 2004) and if native competitors show a naïve behavior towards them (Sih et al. 2010).
15
Table 2.1. Comparison between weakfish Cynoscion regalis (Bloch & Schneider, 1801) and the different prize fish: meagre Argyrosomus regius (Asso, 1801), European bass Dicentrarchus labrax (Linnaeus, 1758), and white seabream Diplodus sargus (Linnaeus, 1758), in respect to biology and habitat. 1- Bigelow and Schroeder (1953); 2- Froese and Pauly (2018); 3- FAO (2018); 4- Lowerre-Barbieri (1994); 5- Prista et al. (2009); 6- Shabana et al. (2012); 7- Lowerre‐Barbieri et al. (1996); 8- Bigelow and Schroeder (1953); 9- Gil et al. (2013); 10- Mercer (1989); 11- Wassef and El Emary (1989); 12- Cabral and Costa (2001); 13- Abecasis et al. (2009).
Biology and habitat Weakfish Meagre European bass White seabream
Diet
Small fish (e.g., anchovies, herring or drums), crabs, amphipods, mysid and decapod shrimps, squids, shelled molluscs, and annelids. (1) Fish, crabs, amphipods, mysid and decapod shrimps, shelled molluscs and annelids. (2)
Small fish, crabs, decapod shrimps, and cephalopods (e.g., cuttlefish). Feed on more fish as it gets older. (3) Algae, crustaceans, molluscs, annelids, echinoderms and hydrozoans. Juveniles are omnivores and adults are carnivores. (12) Maximum length 98 cm (2) 230 cm (2) 103 cm (2) 45 cm (2) Maximum Weight 9 kg (2) 103 kg (2) 12 kg (2) 1.9 kg (2)
Maximum Age 9-12 years (4) 44 years (5) 30 years (2) 10 years (2) First maturation 0-1 year-old Length at maturity varies within regions ~17.5 cm. (10)
~2 years old Males: 45 cm Females: 47 cm. (6) Males: 4-7 years Females:5-8 years. (3) 2 years. (2) Fecundity Multiple spawner: undetermined fecundity. (7) 2.1–31.1 million eggs (1.0–1.7m females). (9) Batch spawners: 230,000 − 809,000 eggs (33 cm fish). (11) 64,650 − 536,360 eggs. (2)
Spawning Spring – Summer
(8) Spring – Summer (8) Spring (3) Winter (2)
Use of the estuary
Spring-late Summer/early Autumn. (8) Spring-late Summer/early Autumn. (8) Spring-late Autumn. (12) Spring – Autumn. (13)
16 Therefore, we intend to test three hypotheses in this study: (i) weakfish feeding strategy is generalist which favors its establishment in the non-native region; (ii) weakfish is outcompeting the three native species mentioned above for food and space; and (iii) weakfish competition is higher with meagre, since they are taxonomically closer (both species are sciaenids fish) and likely occupy the same ecological niches. To test our hypotheses, we determined: (i) weakfish diet and feeding strategy through stomach content analysis, as well as for meagre, European bass, and white seabream; ii) trophic position through isotopic carbon and nitrogen content analysis in muscle and fin tissues for the four species to assess trophic overlap; (iii) infer weakfish habitat use through the analysis of otolith chemistry, to retrospectively assign habitat used along the entire life of each individual. In this way, we provide the first comprehensive dataset on the invasive weakfish population, that will allow us to perceive the level of ecological overlap between the invader and these prize native species, and discuss possible impacts on other fishery resources in Sado estuary.
2. Materials and Methods 2.1. Study area
The Sado estuary is located on the western coast of Portugal at 30 km south of Lisbon (37º25’-38º40’N, 7º40’- 8º5O’W) (Figure 2.2). It is about 20 km long and 4 km wide and the average depth is 8 m, while the maximum can reach more than 50 m (Martins et al. 2001). It has an area of ~180 km2, of which one third is occupied by intertidal mudflats and salt marshes (Martins et al. 2001). Since only five tributaries provide freshwater to the estuary, salinity is usually high (above 29.5) during the whole year (Neves et al. 2008). The tidal amplitude is semi-diurnal, 4 m during spring tides and 1 m during neap tides (Rocha 1998). The estuary provides numerous habitats (e.g., seagrass meadows, mudflats, saltmarsh, dunes, ponds, puddles) and functions as a nursery area for numerous species (Harzen 1998). A deep-water port is located near the mouth of the estuary, the Port of Setubal, that comprises five terminals for public use and seven for private use, all intended for the carriage of liquid or solid bulk (APSS 2018).
17
Figure 2.2. Location of the Sado estuary on the western coast of Portugal. The open box comprises Port of Setúbal location. Maps retrieved from Google Earth.
2.2. Otolith chemistry
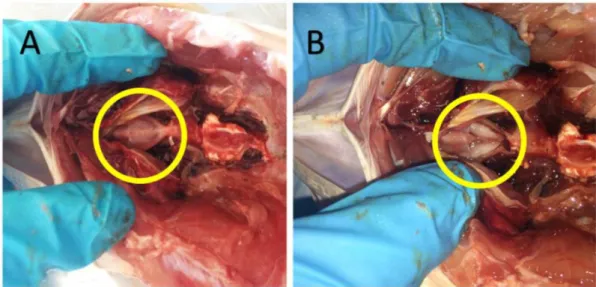
The otoliths were extracted via the branchial region with tweezers, cleaned with distilled water to remove adherent tissues, blotted in absorbent paper, and then let dry in an open plastic vial (Figure 2.3). A 500- μm transversal cross-section was cut near the otolith core to expose annual growth ring increments and perform chemistry analysis along a transect in the otolith. This transect will start in the core of the otolith and end in the posterior end of the otolith to include the entire life of the fish. A guideline was drawn over the inner face of the otolith to indicate the location of the nucleus in a transverse section of the sagitta (Figure 2.4). The inner side of the otolith is clearly distinguished by the sulcus acusticus, composed by the ostium (anterior) and cauda (posterior) (Figure 2.4). Right and left otoliths are distinguished by observing the inner side, with the ostium pointing to the left and cauda pointing to the right: the tip of the cauda will curl downwards in the right sagitta and upwards in the left sagitta. The line was drawn with a sharp pencil, under a stereo microscope, above the ending limit of the ostium (postostial lobe) and passing through the cauda in the dorsal-ventral plan (Figure 2.4).
18
Figure 2.3. Ventral view of the optic capsules of weakfish Cynoscion regalis (Bloch & Schneider, 1801). A: Optic capsule exposed. B: Otoliths exposed after removing part of the capsule and ready to be extracted.
Figure 2.4. External morphology of the inner side of a right sagitta otolith of weakfish Cynoscion regalis (Bloch & Schneider, 1801). On the left (A) the dashed line circumscribes the sulcus acusticus that comprises the ostium, the postostial lobe, precaudal depression, caudal joint and cauda. On the right (B), a schematic representation of the position of the section containing the nucleus. Arrows indicate otolith position in relation to the fish. Image adapted from (Béarez et al. 2016).
Each right otolith was placed in a disk-shaped mold (Ø 25mm), with the inner side facing down, and then epoxy resin (EpoThin resin and EpoThin hardener, Buehler) was poured into the mold, and let dry for at least 9 hours at room temperature. The right otoliths were sectioned transversely using a low-speed saw (Mecatome T180, Presi), equipped with a diamond cut-off disc (type LR Ø 100 mm with 0.5 mm thickness, Presi), and following the pencil guideline drawn on the otolith (Figure 2.5). The otolith sections
19 were observed under a stereo microscope (Leica S8 APO) with dark-field polarization to check the distance between the nucleus and the otolith surface. The desired position is attained when the sulcal region displays a triangular shape pointing towards the core of the otolith (Figure 2.6). If the nucleus was not at the surface of the cut, the section was then sanded using a sequence of silicone carbide grinding papers, with decreasing degree of abrasiveness. Then, diamond suspension solutions of 9 μm, 3 μm, and 1 μm were used over polishing cloths to eliminate scratches from the otolith surface.
Figure 2.5. Sectioning a weakfish Cynoscion regalis (Bloch & Schneider, 1801) otolith using a low-speed saw with a diamond-cut disc. Water was used to lubricate the saw and prevent overheating.
Figure 2.6. Section of a weakfish Cynoscion regalis (Bloch & Schneider, 1801) sagitta otolith after being cut with a low speed saw. The sulcal region displays a triangular shape pointing towards the core of the otolith.
20 After exposing the otoliths’ core, we analysed the concentration of Sr isotopes ratios (87Sr/86Sr) to distinguish marine and freshwater signals from the Sr voltage output given in the analysis (Phillis et al. 2018). Strontium isotope ratios and the intensity of the Sr ion beam (Sr V, used as a proxy for Sr concentration) were done at the UC Davis Interdisciplinary Center for Plasma Mass Spectrometry with a multiple collection laser ablation inductively coupled plasma mass spectrometry (LA-ICPMS). Strontium voltage at the end of the life of the fish will give us an indication of the habitat conditions at time of death (marine, freshwater, brackish) and serve as a reference to interpret the life history of weakfish. The concentration of Sr in the water is generally higher in sea than in freshwater, and since Sr is mostly incorporated into the otolith as function of its concentration in the water, then it is possible to assign the habitats used by a fish along their entire life. Higher Sr voltages in the otolith also correspond to higher salinity environments. Incorporation of Sr in the otolith matrix is possible because Sr has a similar ionic radius to Calcium (Ca), a major constituent of the otolith matrix which is made of calcium carbonate (CaCO3) and otolin.
2.3. Diet
The guts of thirty-three weakfish, five meagres, five seabasses, and five white seabreams were individually frozen in small vials after their dissection while still fresh. The guts of each fish was thawed at room temperature and opened with scissors to reveal their content. Only stomach contents were included in the analysis, except for Diplodus sargus that does not show morphological or chemical differentiation of the stomach (Quignard 1966). Preys were identified to the lowest taxonomic level possible using a stereo microscope (Leica S8 APO) according to the following identification manuals: fish − “Fishes of North-Eastern Atlantic and the Mediterranean” by Whitehead et al. (1985; 1986a; 1986b), crustaceans − “Crustáceos Decápodes Ibéricos” by Alvarez (1968), molluscs − “Conchas Marinhas de Portugal” by Macedo et al. (1999). In cases were preys could not be identified to the species level, they were assumed as a non-identified species, so that all preys could be plotted at the same taxonomic level. For example, if four fish in an advanced digestion state are found in the stomachs of several predators, and the species could not be identified, they will be considered as four individuals of the same species.