Contents lists available atScienceDirect
Journal of Outdoor Recreation and Tourism
journal homepage:www.elsevier.com/locate/jortWeekend visitors' views and perceptions at an urban national forest park of
Cyprus during summertime
Paraskevi Karanikola
a, Thomas Panagopoulos
b,⁎, Stilianos Tampakis
aaDepartment of Forestry and Management of the Environment and Natural Resources, Democritus University of Thrace, 193 Pantazidou street, Orestiada,
Greece
bResearch Centre for Spatial and Organizational Dynamics, University of Algarve, Gambelas Campus, 8005-139 Faro, Portugal
A R T I C L E I N F O
Keywords: Urban forest Green infrastructure National Park Park management Segmentation analysisA B S T R A C T
Urban national forest parks provide nature preservation and recreational opportunities for socio-economically disadvantaged communities as well as tourists. We empirically examine the preferences and satisfaction of visitors in the Athalassa National Forest Park, which is located in a peri-urban area in the capital city of Cyprus. This study examines visitors’ evaluation of the Athalassa in 600 face-to-face interviews during summertime weekends. A two-step cluster analysis identified two distinct clusters of visitors based on the three dimensions of satisfaction that resulted from the factor analysis and the characteristics of the visit. The dual role of the urban forest National Park was highlighted. Both local and tourist visitors were satisfied and appreciative of the setting and support services, although only the local and higher income visitors were willing to pay an entrance fee, whereas tourists avoided expressing their opinion.
Management implications: This study highlighted a number of deficiencies and produced information that could be used to integrate the management decision-making process and assist in defining major lines of action for more inclusive use of urban national forest parks. The results revealed that the visitors were overall satisfied with the park, but the benefits promoted from this important green infrastructure were not evenly distributed across different sections of society with older age groups and those of lower socio-economic status were not accessing the park to the same extent as other groups, thus there is some room for improvement. However, in a time of economic crisis, the management of the park must be based on a combination of satisfying the two clusters and on improving efforts in different infrastructures.
1. Introduction
Historically, national parks were designed to serve as public parks providing opportunities for biodiversity conservation and for the sustainable use of natural resources, research, education and recreation (Ehrenfeld, 1978). National parks are attractive to visitors because of their protected status, which ensures their naturalness (Ferreira & Harmse, 2014). Recreation in natural parks is increasing worldwide (Adams et al., 2008; Duzgunes & Demirel, 2013; Mayer, 2014; Pickering & Hill, 2007;Worboys, Delacy, & Lockwood, 2005). On the other hand, accessible urban green spaces decreases, thus, resi-dents have begun turning to peri-urban national parks as alternative areas for their recreational needs (Rossi, Byrne, Pickering, & Reser, 2015; Rupprecht & Byrne, 2014).
Peri-urban national parks are located at the urban rural fridge of cities or the urban-wild land interface (Ewert, Chavez, & Magill, 1993; Lawton & Weaver, 2008). Various studies have attempted to measure
visitors’ satisfaction to quantify the capacity of a specific park to fulfil the recreational and leisure time needs of visitors (Andkjaer & Arvidsen, 2015;Arabatzis & Grigoroudis, 2010). Visitors' satisfaction, defined as the congruence between visitors’ expectations and outcomes (Vaske, 2008), is often a major management objective and is one of the most commonly used indicators of recreation quality (Manning, 2011; Roemer & Vaske, 2014).
Tourism has a significant impact on the management of urban national parks, with high biodiversity and recreational value. In recent years, tourists have constituted a substantial proportion of visitors to national parks and other protected areas; consequently, their percep-tions and preferences have begun to play a major role in the decisions of national park managers (Sterl, Brandenburg, & Arnberger, 2008; Vistad, 2003). Many studies have assessed visitors’ perceptions of national parks in America (Roemer & Vaske, 2014; Santucci, Floyd, Bocarro, & Henderson, 2014), Africa (Gandiwa et al., 2014); Asia (Deng, Qiang, Walker, & Zhang, 2003), and Europe (Gorner & Cihar,
http://dx.doi.org/10.1016/j.jort.2016.10.002
Received 28 December 2015; Received in revised form 25 June 2016; Accepted 13 October 2016
⁎Corresponding author.
E-mail address:[email protected](T. Panagopoulos).
2213-0780/ © 2016 Elsevier Ltd. All rights reserved.
2011; Papageorgiou & Brotherton, 1999). Comparative studies be-tween the perceptions of national park visitors in Cyprus and other countries would be of a great value, but to date, this information has only been recorded about one park in Cyprus: the National Park of Troodos (Tampakis, Karanikola, Tsantopoulos, & Andrea, 2014).
Public participation questionnaires play a key role in sustainable park development and in landscape planning, because they provide relevant information regarding not only landscape features but also public preferences about landscape characteristics (Loures, Loures, Nunes, & Panagopoulos, 2015). The perceptions and preferences of visitors play a major role in the management decisions made by national park managers all over the world (Dasdemir, 2005; Panagopoulos, 2009;Papageorgiou & Kassioumis, 2005).
Most of the national parks in southern Europe face management issues, which have intensified in the current economic crisis (Vokou et al., 2014). Particularly in Cyprus had as consequence the reduction of the annual income and the expansion of the unemployment rate, which lead to higher concentration in big cities and substantial decline of citizens' quality of life (Arechavala, Zarzosa, & Trapero, 2015). Meanwhile, sustainable cities must be simultaneously economically viable, socially just, politically well managed and ecologically sustain-able to maximize human well-being (Panagopoulos, Duque, & Dan, 2016). Urban national parks were designed to bring nature and recreational opportunities to socio-economically disadvantaged com-munities in urban areas (Byrne, Wolch, & Zhang, 2009).
The goal of the present study was to investigate visitor perceptions and views about the adequacy of national forest park infrastructure and recreational facilities and to assess the dual roles of an urban national forest park. The results of this work could be used as a tool for urban national forest park management.
2. Research methodology
2.1. Study area
Between 1983 and 2004, ten national forest parks were established in Cyprus, covering a total area of 15627.22 ha. The urban National Forest Park of Athalassa, one of the biggest in Cyprus, with an area of 840.2 ha, is situated 5 km south of Nicosia and is surrounded by the suburbs of Aglantzia, Strovolos, Latsia and Geri. Nicosia, the capital of Cyprus, is Europe's last divided city and is separated by a United Nations buffer zone. The Athalassa National Pak is an artificial forest, start planted from 1904 and in 1940 declared as an important State Forest because of its position near the capital of the island.
Athalassa offers an excellent case study of the dual character of parks as both conservation centers, designed to educate the public on the importance of conservation and the natural wonders of the park that give visitors the opportunity to become acquainted with nature, and as an urban forest park used for recreation. Due to its central location on the island, Athalassa is easily reached by local urban residents and also by visitors from across the country.
In addition to major role as a peri-urban green area, Athalassa National Park also provides recreational and exercise facilities, aes-thetic benefits, and environmental education. The park has picnic areas, bicycle tracks, pedestrian lanes, sport grounds, parking facilities, a bird observation point, a botanical garden, a dog walking path and an environmental information center (Fig. 1). A small picturesque lake and the path surrounding it, which is lit at night, are of particular interest (Fig. 2). Over 268 plant species can be found in Athalassa, including 20 native plants. The dominant forest tree is the calabrian pine (Pinus brutia), which creates a beautiful forest landscape both on its own or in combination with other trees, such as the endemic golden oak (Quercus alnifolia) or other native shrubs mainly Tamarix ssp., Arundo donax, Juncus ssp., Rumex dentatus, Cistus creticus, Zizyphus lotus and Grataegus azarolus (Department of Forests, 2014). The large number of eucalyptus species has been planted till 2000 gradually
replaced from other species like Ceratonia siliqua and Olea europea.
2.2. Methodology
This research was conducted through the use of personal interviews lasted between 10 and 15 min. The questionnaire developed for the purpose of this study consists of two major parts and 18 questions. Questionnaires covered a wide range of topics, such as frequency of visitation, the activities involved, the level of satisfaction, the duration and distance covered to visit, willingness to pay an entrance fee, and potential support of management strategies. The questionnaires in-cluded a combination of close-ended questions andfive-point Likert-scaled questions, on a scale from 1 very bad to 5 very good concerning their satisfaction for the visit in the park (Bigne, Andreu, & Gnoth, 2005). Additionally, park users were asked to identify their perceived sense of crowding (Manning, 2007) and to rate the acceptable density of people in the park, with results coded in a 3-point scale from amused to disturbed (Brace, 2009).
The population under study was the total number of visitors. Cluster sampling approach has been chosen, because this particular method allows us to select a sample without being necessary to create and number the sampling framework (Kalamatianou, 2000). In cluster sampling only the existence of one list of groups-clusters is required, and also of the elements pertaining to the selected clusters (Filias et al., 2000). In our application of this method the examined clusters were the weekends of the year when the research was conducted.
The weekends were chosen as clusters because during weekends the park is visited by all the groups of the population (the people who work the weekdays and the visitors from distant areas that prefer weekends for their visits as excursion. The weekdays park usually visit local pensioners and housewives with children.
We estimated the proportion of the population and the standard error of the proportion of the population spusing the following cluster
sampling formulas. p ai mi S N n NnM ai pmi n = ∑ ∑ = − ∑ ( − ) − 1 i n i n p i n =1 =1 2 =1 2
Ν=the number of clusters in the population (52 weekends), n=the number of clusters in the sample,
αi=the number of the elements in the cluster sampling i that have
the specific characteristic of interest,
mi=the number of population members or sampling units in cluster
i (i=1, 2, 3,…, N),
m=the average size of clusters in the sample.
∑
m n mi = 1 i n =1∑
M= mi i n =1M= the average size of clusters for the population
M M N
=
Pre-sampling was carried out before thefinal sample was taken, for whichfive clusters (weekends) was selected. The pre-sampling data were used to estimate thefinal number of clusters with d=0.07 with a probability (1-α)=95%, and the value zα/2=z0.025=1.96. The maximum
sample size was calculated to be 19 clusters (weekends). The biggest sample sizes occurred in spring, which indicates that it is the most important season for visiting. The estimation of n is given below:
Cluster mi ai (ai-pc*mi)2
1 29 16 8.5972
2 32 9 29.3737 3 34 16 0.4611 4 30 22 71.9355 5 37 10 44.5268 Total 162 73 154.8943 p ai mi = ∑ ∑ = 73 162 = 0.4506 c i n i n=1 =1
∑
S n a p m = 1 − 1 ( − ⋅ ) = 1 5 − 1154.8943 = 38.7236 c i n i c i 2 =1 2BecauseΜ is unknown, M can be estimated as:
⎛ ⎝ ⎜ ⎞⎠⎟ ⎛⎝⎜ ⎞⎠⎟ m mi n = ∑ = 162 = 32.4 = = = 18.5844 ≅ 19 n i n Ns NM s 1 =1 1 5 + 52 ⋅ 38.7236 ⋅ 52 ⋅ 32.43 + 38.7236 d zα 2 /2 2 2 2 0.07 1.96 2 2
On-site, face-to-face interviews were carried out in the four entrances of the National Park over 19 weekends. Participants had to be at least 18 years old to respond to the questions of the questionnaire. The period during which the study was conducted was from May 4rd, to September 15th, 2012. The interviewers, who had been thoroughly instructed in the use of the survey forms, asked visitors if they were willing to participate in a 15 min interview. The visitors had partici-pated to the survey some weeks ago kindly denied doing it again. The following analyses include the response sample of 600 park visitors. One observation set corresponds to a completed survey by a respon-dent. The response rate was 95% with 30 visitors refusing to respond because they were in a hurry and they had some other activities to do. As it was perceived, those visitors were not belonging to any specific category, thus the sampling is representative.
All questionnaires were incorporated into a Microsoft Excel data-sheet for data integration, and analyses were conducted using the Statistical Package for Social Sciences (SPSS 16.0), including calculat-ing percentages, cross-tabulations, and multivariate statistical techni-ques (Pearson's chi-square). In analyses of the variable satisfaction with the recreation infrastructure, the Cronbach's alpha reliability coefficient was used and according toHowitt & Gramer (2003), when the alpha coefficient is higher than 0.70, it is regarded as satisfactory. Principal component analysis was used tofind common factors within a group of variables (Sharma, 1996). The Kaiser rule was used to select the number of factors (Karlis, 2005), the matrix rotation of the main factors was used, and the Kaiser method of maximum variance rotation was applied.
A two-step cluster analysis was used to statistically segment the
Fig. 1. Map of the Athalassa National Park (Source: Amazon.com Cyprus).
Fig. 2. View from the Athalassa National Park picnic ground near a small picturesque lake, including the surrounding path.
visitors into two distinct groups (clusters), according to the factors of satisfaction that resulted from the factor analysis (continuous vari-ables) and the characteristics of the visit (categorical varivari-ables). This method is a research tool that helps to determine clusters when their variables have a number of similar characteristics a large sample size. Because the variables are independent of each other, the categorical and continuous variables were analyzed using a polynomial and normal distribution, respectively.
3. Results
3.1. Visitors’ perceptions concerning their visit to the National Park Six hundred completed questionnaires were used, including 428 filled out by local people (218 males and 210 females) and 172 filled out by tourists (91 males and 81 females). The sociodemographic profile of the visitors is shown in Table 1. Most of the interviewed visitors were young (39.3% were younger than 30 years old), married (58%), had children (56%), were highly educated (52.1% had a university education) and working as private employees or students.
The National Park of Athalassa is the only forest park close to the city of Nicosia that has infrastructure and facilities for visitors. In the present study, the overall satisfaction with the outdoor recreation experience and satisfaction with the existing park facilities, services and infrastructure maintenance (absolutely satisfied 10.5%, very
satisfied 32.0%, and satisfied 44.7%) were over the threshold. The 80% threshold was also surpassed by visitor satisfaction with child safety and the overall security of the park (absolutely satisfied 7.0%, very satisfied 32.0%, and satisfied 44.7%). Although the overall level of satisfaction was very high, with 90.7% of them absolutely satisfied or satisfied, 5.8% partly satisfied, and the remaining 3.5% not at all satisfied (Table 2).
As shown inFig. 3a, one third of visitors stated that they visited the park because of their own wishes (28.2%) or after the exhortation of their friends (32.8%), children (21.8%) or mate (17.2%). Visitors had clear seasonal preferences; 48.8% and 31.8% of visitors consider spring and summer, respectively, the ideal season to visit. Autumn was preferable to winter, with 11.7% and 7.7% of visitors, respectively, stating it was the best time for a visit (Fig. 3b).
Most of visitors come to the Park at least once a year (31.5%) or rarely (26.3%), but some (27.7%) come more frequently, visiting at least once a month (Fig. 3c). Only (14.5%) visit the Park every week; these were mostly inhabitants of Nicosia.
Visits usually lasted between 30 and 60 min (45% of respondents, Fig. 3d) and were made for cycling, walking, or other sport activities. A large proportion of visitors (43.7%) stay in the park for one to two hours, and make visits to enjoy leisure time with their children at the playground, for relaxation at the kiosks and the environmental information center, or for environmental education. Fewer visitors (5.3%) stayed at the Park for more than two hours and visited for activities such as picnicking and camping. Some visitors (6%) stop at the park for less than thirty minutes of isolation, bird watching, and walking. These results illustrate the dual purpose of Athalassa as both a
Table 1
Socio-demographic profile of visitors (sp: standard error of proportion).
p (%) Sp Gender Male 51.3 0.0133 Female 48.7 0.0133 Age 18–30 39.3 0.0170 31–40 26.7 0.0102 41–50 22.5 0.0140 > 50 11.5 0.0099
Marital status Unmarried 41.5 0.0178
Married 58.0 0.0174
Divorced/widowed 0.3 0.0016
No answer 0.2 0.0011
Number of children Without children 43.7 0.0186
one child 8.8 0.0093
Two children 19.8 0.0073
Three children 16.8 0.0128
More than three 10.8 0.0085
Educational level Primary School 2.2 0.0036
Lower Secondary 8.8 0.0114 Upper Secondary 30.0 0.0254 Technical School 10.8 0.0123 Technological ed 13.8 0.0155 University 34.3 0.0193 No answer 0.2 0.0011
Profession Private employee 20.8 0.0094
Public servant 15.5 0.0114 Self-employed 8.5 0.0076 Farmer 3.5 0.0070 Pensioner 5.7 0.0066 Student 27.0 0.0142 Homemaker 9.7 0.0089 Unemployed 9.3 0.0118 Annual income ≤5.000 € 3.2 0.0052 5.001−10.000 € 9.8 0.0133 10.001−20.000 € 17.0 0.0160 20.001−30.000 € 10.2 0.0115 > 30.000€ 3.8 0.0059 No answer 56.0 0.0257 Table 2
Visitors' perceptions and satisfaction concerning their visit to the National Park (sp: standard error of proportion).
Not at all Partly satisfied Satisfied Very satisfied Absolutely satisfied Overall satisfaction of the visit p 2.5 5.8 32.2 40.5 18.0 sp 0.0082 0.0082 0.0161 0.0161 0.0127 Safety for children and Park security p 2.1 14.0 46.7 30.2 7.0 sp 0.0066 0.0186 0.0117 0.0239 0.0101 Satisfaction with the infrastruc-ture, services and maintenance p 1.0 11.8 44.7 32.0 10.5 sp 0.0037 0.0173 0.0114 0.0216 0.0094 The park as a place for isolation and meditation p 13.0 25.5 29.7 21.8 10.0 sp 0.0201 0.0274 0.0200 0.0235 0.0147 The Park as a place to meet friends and have leisure time with family p 2.7% 8.0 32.2 31.5 25.7 sp 0.0068 0.0090 0.0240 0.0173 0.0327 The Park as a place for socialization p 27.5 32.8 21.5 13.2 5.0 sp 0.320 0.0243 0.0244 0.0169 0.0094
National Park and an urban park. Most visitors (33.2%) travel 10.1– 20 km to visit the park (Fig. 3e); 26.2% travel 20.1–50 km, and only 7.8% travel more than 50 km. The residents of Nicosia travel less than 10 km to visit the Park (32.8% of visitors).
In this study, most park visitors (46.7%) stated that they feel amused by the presence of other visitors, and 45.2% were indifferent to them. Only 6.7% stated that they were disturbed from the presence of other people and complained about the lack of opportunities to escape crowds (Fig. 3f). The results inTable 2show that few people visit the park for isolation and meditation, and even less for socialization. These results confirm that Athalassa Park is a place where people come to enjoy leisure time with friends and family; 25.7% of visitors strongly agree with this description, 31.5% agree, and only 2.7% strongly disagree. Only 10% strongly agree that the park can be used for isolation and meditation; 32.8% are partly satisfied with the park as a good place for socialization, while 27.5% declared that it is not suitable at all.
Currently, only the plant and animal museum has an entrance fee
(0.5 euro); all other areas of the park are free. Although the level of satisfaction was high, visitors were mostly negative about paying an entrance fee to the park, with 47.2% disagreeing with any fee, 25.5% agreeing with a fee and 27.3% were without an opinion.
3.2. Satisfaction with the existing infrastructure of the park
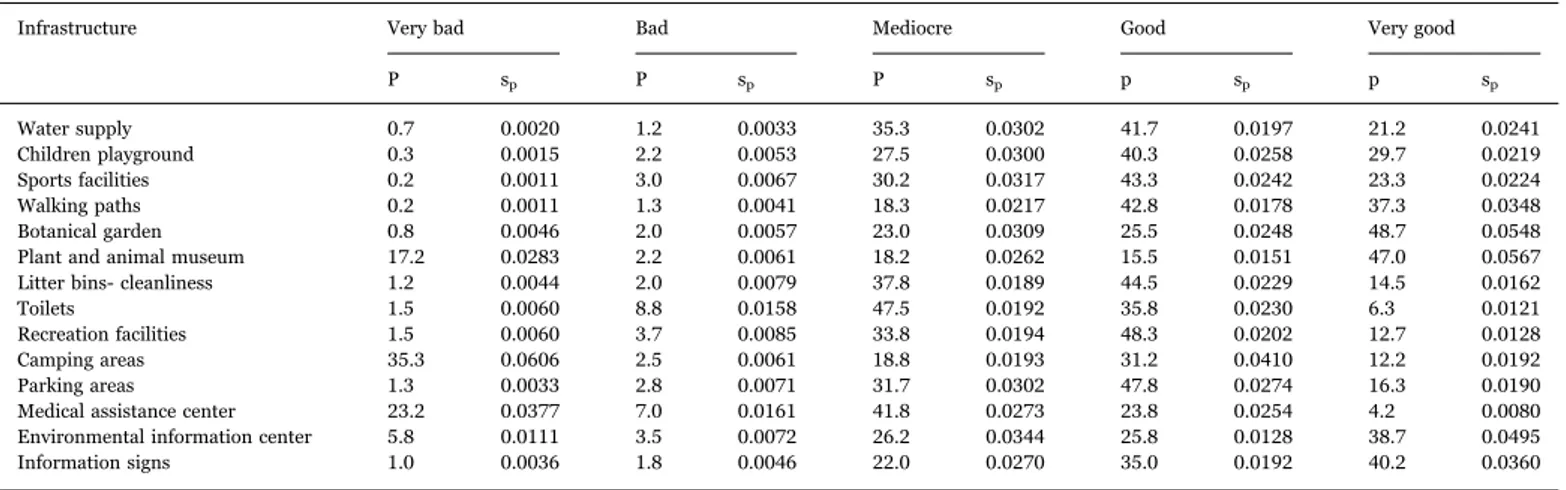
Park users were asked to rate the level of importance and satisfac-tion of existing condisatisfac-tions via a 5-points Likert scale (1 being the most negative value and 5 being the most positive value). Results are reported inTable 3.
The majority of respondents had positive opinion about most of the existing park infrastructure, and considered most characteristics and conditions important for their enjoyment and satisfaction, although camping areas and the medical assistance center were rated as less important. This result may be explained by the fact that most users were at the park for short-term visit. As is shown in Fig. 4, most respondents were satisfied by most of the park's facilities and
tion: water supply (41.7%), playground (40.3%), sport facilities (43.3%), walking paths (42.8%), cleanliness (44.5%), picnic tables and recreational facilities (48.3%), and parking facilities (47.8%). However, the toilet facilities (47.5%) and medical assistance center were evaluated as mediocre, and the camping areas did not meet users’ requirements (rated very bad by 35.3% of those interviewed). The facilities with most positive evaluations were the botanical garden (48.7% very good and 25.5% good), the plant and animal museum (47%), information signs (40.2%), and the environmental information center (38.7% very good).
Reliability analysis was applied to the above variables after com-pleting all the necessary checks. The value of the reliability coefficient alpha was 0.867. This is a strong indication that each variable of the multivariable question evaluated from the respondents the same way. Thisfinding was also supported by the fact that the partial reliability alpha coefficients were significantly higher after the deletion of any variable, and no increase of the reliability coefficient was observed.
Before proceeding with the factor analysis, we conducted all the necessary checks. The value of the Keiser-Meyer-Olkin indicator was 0.865. Furthermore, Bartlett's test of sphericity rejects the null hypothesis that the correction table is unitary and that the partial correlation coefficients are low. The fact that the measures of sampling
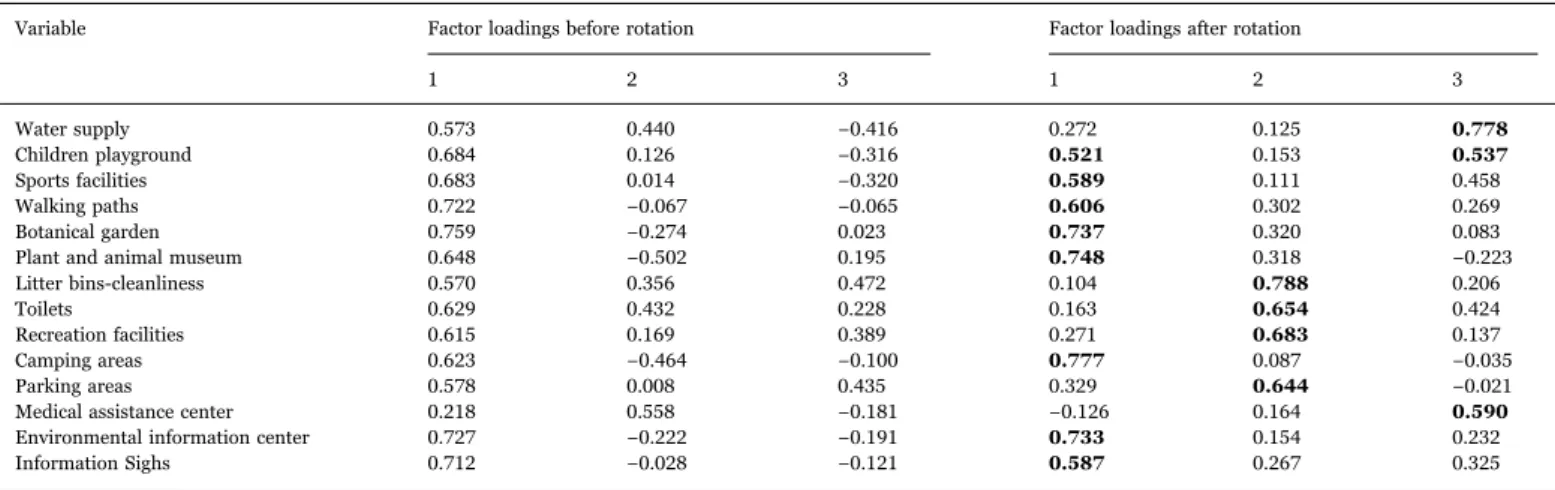
adequacy have high to very high values also supports the view that the factor analysis model was acceptable. There were three extracted factors.Table 4lists the load of the partial correlation factors of the fourteen variables with each of the three factors extracted from the analysis. The higher the load of a variable in a factor, the more this factor is responsible for the total degree of variance of the considered variable.
The first factor includes the variables “children's playground”, “sports facilities”, “walking paths”, “botanical garden”, “plant and animal museum”, “camping areas”, “environmental information cen-ter”, and “information signs”. We referred to this factor as “forest park infrastructure”, because the included variables help visitors come into contact with nature. Thefirst two variables were included in this factor because children can obtain knowledge about the natural environment through games.
The second factor includes the variables“litter bins and cleanli-ness”, “toilets”, “recreational facilities”, and “parking areas”. We referred to this factor as “basic recreation infrastructures”, because the included variables are necessary to all types of parks (urban, forest, or national).
The variables“water supply”, “children's playground”, and “medical assistance center” were included in the third factor, which we called
Table 3
Satisfaction with the existing infrastructure of the National Park (sp: standard error of proportion).
Infrastructure Very bad Bad Mediocre Good Very good
P sp P sp P sp p sp p sp Water supply 0.7 0.0020 1.2 0.0033 35.3 0.0302 41.7 0.0197 21.2 0.0241 Children playground 0.3 0.0015 2.2 0.0053 27.5 0.0300 40.3 0.0258 29.7 0.0219 Sports facilities 0.2 0.0011 3.0 0.0067 30.2 0.0317 43.3 0.0242 23.3 0.0224 Walking paths 0.2 0.0011 1.3 0.0041 18.3 0.0217 42.8 0.0178 37.3 0.0348 Botanical garden 0.8 0.0046 2.0 0.0057 23.0 0.0309 25.5 0.0248 48.7 0.0548
Plant and animal museum 17.2 0.0283 2.2 0.0061 18.2 0.0262 15.5 0.0151 47.0 0.0567
Litter bins- cleanliness 1.2 0.0044 2.0 0.0079 37.8 0.0189 44.5 0.0229 14.5 0.0162
Toilets 1.5 0.0060 8.8 0.0158 47.5 0.0192 35.8 0.0230 6.3 0.0121
Recreation facilities 1.5 0.0060 3.7 0.0085 33.8 0.0194 48.3 0.0202 12.7 0.0128
Camping areas 35.3 0.0606 2.5 0.0061 18.8 0.0193 31.2 0.0410 12.2 0.0192
Parking areas 1.3 0.0033 2.8 0.0071 31.7 0.0302 47.8 0.0274 16.3 0.0190
Medical assistance center 23.2 0.0377 7.0 0.0161 41.8 0.0273 23.8 0.0254 4.2 0.0080
Environmental information center 5.8 0.0111 3.5 0.0072 26.2 0.0344 25.8 0.0128 38.7 0.0495
Information signs 1.0 0.0036 1.8 0.0046 22.0 0.0270 35.0 0.0192 40.2 0.0360
Fig. 4. Representation of the visitor satisfaction with the existing infrastructure, with mediocre set as the mean of the X-axis.
“children's safety”. The variable “children playground” is included in both the first and the third factor and constitutes a bridge between them (Table 4). The variable“sports facilities”, with value 0.458 (very close to 0.5), is also a bridge between these two factors. The variable “toilets”, with value 0.424, is a bridge between the second and third factor.
After applying the two-step cluster analysis, observations were grouped into two clusters as the optimum solution. More specifically, of the 600 visitors, 39.3% were placed in thefirst cluster and 60.7% in the second cluster.Fig. 5presents the statistical significance tests of the relative significance of the variables (continuous and categorical) in the clusters’ formation. The continuous variable “basic recreation infra-structure” played a significant role in the formation of the first cluster,
while“forest park infrastructure” significantly influenced the formation of the second cluster (Fig. 5a and c). The value of the statistical chi-square for the four categorical variables in both clusters exceeded the limits of the critical value, indicating that all categorical variables included in the analysis are significant for the formation of both clusters (Fig. 5b and d).
The characteristics of the two clusters are presented inTable 5. The lower part of the table, with the help of Pearson's chi-square test for a statistical significance α < 0.02, presents the relationship of the two clusters with other variables that relate to the visitor characteristics. In thefirst cluster, visitors perceive the park as an excellent recreational area and with high standards for child security. It mostly includes local visitors who travel less than 10 km, and visit the park often. The
Table 4
Factor burdens, before and after rotation.
Variable Factor loadings before rotation Factor loadings after rotation
1 2 3 1 2 3 Water supply 0.573 0.440 −0.416 0.272 0.125 0.778 Children playground 0.684 0.126 −0.316 0.521 0.153 0.537 Sports facilities 0.683 0.014 −0.320 0.589 0.111 0.458 Walking paths 0.722 −0.067 −0.065 0.606 0.302 0.269 Botanical garden 0.759 −0.274 0.023 0.737 0.320 0.083
Plant and animal museum 0.648 −0.502 0.195 0.748 0.318 −0.223
Litter bins-cleanliness 0.570 0.356 0.472 0.104 0.788 0.206
Toilets 0.629 0.432 0.228 0.163 0.654 0.424
Recreation facilities 0.615 0.169 0.389 0.271 0.683 0.137
Camping areas 0.623 −0.464 −0.100 0.777 0.087 −0.035
Parking areas 0.578 0.008 0.435 0.329 0.644 −0.021
Medical assistance center 0.218 0.558 −0.181 −0.126 0.164 0.590
Environmental information center 0.727 −0.222 −0.191 0.733 0.154 0.232
Information Sighs 0.712 −0.028 −0.121 0.587 0.267 0.325
duration of their visit was either less than 30 min or more than 2 h. Overall satisfaction had the highest grading by some visitors in this cluster. Their opinion regarding the basic recreational infrastructure, maintenance, and guarding and policing of the park was either very high or very low. Their perceived sense of crowding in the park varied from entertaining to disturbing. They state that they visited the park through their own initiative or due to urging by their friends, and they stated they were“very much” to “satisfied” with the park as a site for isolation and meditation, and“very much” to “partly satisfied” with the park as a place for encounters and making new acquaintances. As a site for recreation with friends and family, some ranked it very high, while others ranked it at the lowest level. Finally, this group consists of visitors with both the lowest and highest income levels, and with both a positive and negative views on an entrance fee.
In the second cluster, visitors perceive the park as a forest with high quality infrastructure that offers an opportunity to become acquainted with nature. The visitors in this cluster were mostly tourists that travel further than 10 km to visit the park, the duration of their visit varies between 30.1 min–2 h, and they were less frequent visitors than the first cluster. In this cluster, the level of visitor satisfaction was intermediate to positive. Compared to thefirst cluster, similar results were observed concerning visitor satisfaction about safety and infra-structure maintenance. The respondents stated that they visited the park after being encouraged by their spouse and children and that they were indifferent to crowds. In this cluster, the park is not viewed as a site for isolation and mediation, or as a site for meeting people and making new acquaintances. Instead, it is considered a suitable place for recreation with friends and family. Finally, this group comprises visitors with a medium income level, who say they have no view on whether an entrance fee should be introduced.
4. Discussion
The satisfaction of park visitors can be measured indirectly through the stimuli and other experiences they have when they come to contact with the natural characteristics that create the identity and character of a national park (Atauri, Bravo, & Ruiz, 2000). In similar studies about visitor satisfaction in U.S.A. national parks was considered a quality indicator and values over 80% express adequate satisfaction (Vaske, 2008;Vaske & Roemer, 2013). In the present study, this threshold was overpassed for the overall satisfaction with the outdoor recreation experience and for satisfaction with the existing park facilities, services and infrastructure maintenance. The 80% threshold was also surpassed by visitor satisfaction with child safety and the overall security of the park. The results of a comparable research conducted by Andrea, Tampakis, Tsantopoulos & Skanavis (2013)in two national parks in Greece, a country with similar culture to Cyprus, revealed lower levels of visitors' satisfaction.
About one half of the visitors covered distance less than 10 km to reach the park so we can say that more of the visitors were residents to the near city of Nicosia or from the close villages of the area. The other half constituted by visitors from other areas of the island and according to the duration of their visit they have different activities in the park mostly walking, sport activities and cycling, leisure time with their children at the playground, environmental education, or relaxation at the kiosks and the environmental information center. This illustrates the dual purpose of Athalassa as both a National Park and an urban park.
In this study, most park visitors feel amused by the presence of others or were indifferent to crowding. Only 6.7% stated that they were disturbed from the presence of other people and complained about the lack of opportunities to escape crowds. Few people visit the park for isolation and meditation, and even less for socialization. Athalassa Park is a place where people come to enjoy leisure time with friends and family.
Although the level of satisfaction was high, the majority of visitors were negative about paying an entrance fee to the park, and about half of them were disagreeing with any fee. Meanwhile, the value of the park's protected areas should be assessed, and used for future plan-ning, improvement of the park (Jones, Panagiotidou, Spilanis, Evangelinos, & Dimitrakopoulos, 2011) and the implementation of environmental policies (Romagosa, Eagles, & Lemieux, 2015). According to Jones, Iosifides, Evangelinos, Florokarpi, and Dimitrakopoulos (2012), low willingness to pay in southern European countries informs that accommodation tax policy, may be a more effective approach than entrance fees, given visitors’ perceptions and current level of trust.
Visitors had clear seasonal preferences; considering autumn and winter as the least preferable for the visit, even that in Cyprus the climate is warm during all year. At this point the proposals to the park planners and managers have to become more innovative and create appropriate infrastructures and activities to extend the visiting period in seasons that the visitors do not feel attractive for park visit.
According to the Census of 2011 the population of Cyprus over 50 years old were 31.02% of the total population, meanwhile, only 11.5% of the Athalassa visitors were over 50 years old, which is an indicator that there are deficiencies in park management that lead to exclusion of large part of the older population. Also, only 5.7% of the visitors were pensioner, which is in contradiction with lack of available time for recreation in winter for this group of citizens.
In 2013 the risk of poverty and social exclusion affected 27% of the Cyprus population with this limitfixed at €9.524 (Statistical Service, 2014). Meanwhile according toTable 1only 13% of the visitors had income lower than€10.000, which also shows that the income deprived section of society do not have equal opportunity to visit the urban park and benefit the offered ecosystem services that more affluent sections of society enjoy.
Table 5
Interpreting the observations from the clusters.
Variables Cluster 1 Cluster 2
Satisfaction for infrastructure
Better basic recreation facilities, and higher safety for children
Better infrastructure referred to the forest park
Overall satisfaction Absolutely, partly or not at all
Very satisfied or satisfied Distance cover for the
visit
Less than 10 km More than 10 km Frequency of visit Once or more times a
week
Once or more times a month or rarely Duration of visit Less the 30 min or
more than 2 h
30.1–2 h
By checking Person chi-square
Wish of whom Mine or friends Mate or children
Crowding in the Park Disturb or amuse Paid no attention The Park as a place for
isolation and meditation
Very much or average Partly or not at all
The Park as a place for socialization
Very much or partly Not at all The Park as a place for
leisure with friends and family
Very much or mediocre or not at all
Very much or average
Satisfaction with children safety and total security
Absolutely, partly, or not at all satisfied
Very much satisfied or satisfied Satisfaction with maintenance of infrastructure Absolutely or partly satisfied
Very much satisfied or satisfied or not at all satisfied
Acceptance of entrance fee
Yes or no No answer
Income Very high and very low
income or no answer
Average income (5001– 30000€)
Distance and accessibility are also important factors to consider for inclusive urban forest park management. A study byJankovska, Donis, Straupe, Panagopoulos, and Kupfere (2013)shows that the number of visits to forest recreational areas decreases as the distance between the visitors’ residence and the forest increases, especially when there are insufficient public transport facilities. Various studies have shown that the number of repeat visits to a tourist destination is related to higher levels of visitor satisfaction (Tian-Cole, Crompton, & Willson, 2002). Also recreational facilities significantly influence the level of visitation (Colson, Garcia, Rondeux, & Pejeune, 2010). Satisfied visitors are more likely to visit the same park repeatedly are more likely to be satisfied from their visits compared to those that have only visited the park once (Rittichainuwat, Qu, & Mongknonvanit, 2002; Yuksel, 2001).
Two third of the visitors were residents from the nearest city covering less than 20 km to reach the park, and spend short time, usually less than an hour in cycling, walking, or other sport activities. To this group of visitors come to the park escaping from their work or study (the University of Nicosia is nearby), managers will help providing easy parking to all the entrances and organising activities that attract them to the park for more times in the same day when they finish their work or their study.
A large also proportion of visitors stay in the park for one to two hours, and make visits to enjoy leisure time with their children at the playground, for relaxation at the kiosks and the environmental information center, or for environmental education. Fewer visitors stayed at the Park for more than two hours and visited for activities such as picnicking and camping, even fewer visitors stop at the park for less than thirty minutes of isolation, bird watching, and walking.
In the case of park visitation, a visitors’ experience of other users may impact their park experience and enjoyment, and could create conflict between visitors (Manfredo, Vaske, Bruyere, Field, & Brown, 2004) The activities of some visitors can potentially affect the psycho-logical and social equity derived by other visitors, with implications for health, wellbeing, environmental quality and social equity (Budruk et al., 2002; Rossi et al., 2015).
Because satisfaction with the existing infrastructure is related to management, assessing the extent of any problems was necessary to delineate priorities for action. Although most respondents were satisfied with their visit overall, this cannot be taken as the only indicator of experiences and condition quality. High levels of overall satisfaction are common for recreational areas, but do not accurately reflect reality and are quite useless for management purposes because they do not define major areas for action (Manning, Wang, Valliere, Lawson, & Newman, 2002).
The majority of respondents had positive opinion about most of the existing park infrastructure, and considered most characteristics and conditions important for their enjoyment and satisfactions, although camping areas and the medical assistance center were rated as less important. This may be explained by the fact that most users were at the park for short-term visit (Cavnar et al., 2004). Most respondents were satisfied by most of the park's facilities and conditions. However, the toilet facilities and medical assistance center were evaluated as mediocre, and the camping areas did not meet users’ requirements. The facilities with most positive evaluations were the botanical garden, the plant and animal museum, information signs and the environ-mental information center.
5. Conclusions
This study assessed visitor satisfaction and their perceptions of the service and adequacy of the recreational facilities at the Athalassa urban National Forest Park. The combination of factor and two-step analysis was a simple and easy way to interpret the results. The two-step analysis identified two clusters of visitors with different require-ments and satisfaction levels. This result was based on three
dimen-sions in the factor analysis: basic recreation infrastructure, forest park infrastructure and children’s safety, as well as the characteristics of the visit.
The visitors to the park were divided into a cluster of nearby urban residents that use it as a common urban park, and a second cluster of visitors that perceive the park as a national park and cover long distances to visit it as tourists. Urban residents visit the park for a short while or very long time. Tourists visit less frequently but are more satisfied with the forest park infrastructure because it gives them the opportunity to become acquainted with nature. In a time of economic crisis and lack of financing, the management of the urban national forest park has to be based on a combination of the two clusters’ satisfaction with the infrastructure of the park. The results of this study are a first attempt to find the golden medium between the visitor satisfaction in the two clusters. Park managers should place more importance on the satisfaction of urban residents with low income and limited opportunities for entertainment because these visitors con-stituted the larger cluster (60.9%). The results of the present study revealed that the benefits promoted from this important green infra-structure are not evenly distributed across different sections of society with older age groups and those of lower socio-economic status were not accessing the park to the same extent as other groups.
The results of this study demonstrate that visitors were satisfied overall with the park and the existing infrastructure, and managers should concentrate their improvement efforts on parking areas, picnic tables and other recreational facilities, water supply, the environmental information center, the plant and animal museum, and the toilets. The walking paths and botanical garden, children's playgrounds, sport facilities, and information signs meet or exceed service quality stan-dards. Thus, in these areas, managers should keep up with the good work. The medical center and camping areas had low satisfaction and importance for visitors, and should thus be considered a low priority. Both local and tourist visitors were satisfied and appreciative of the setting and support services, but only local visitors had an opinion about an entrance fee. Only higher income visitors were willing to pay a fee to visit the park. Because tourists avoided expressing their opinion about an entrance fee, the possibility of an accommodation tax should also be explored and compared to an entrance fee.
It has been shown that appropriately analyzed questionnaire data can effectively contribute to the management of national parks. The assessment of visitors' perceptions has produced useful information that could be incorporated into urban national park management. The results of this study could be used as a starting point to improve park services and serve as the basis for more effective governance of urban green infrastructure.
Acknowledgments
This work was supported by the Foundation for Science and Technology under grand UID/SOC/04020/2013 and COST Action FP1204: Green Infrastructure approach: linking environmental with social aspects in studying and managing urban forests. The authors thank Filippos Florou and Christos Menoikou for collecting the data.
References
Adams, C., Seroa da Motta, R., Ortiz, A., Reid, J., Aznar, E., & Sinisgalli, A. (2008). The use of contingent valuation for evaluating protected areas in the developing world: Economic valuation of Morro do Diabo State Park, Atlantic Rainforest, Sao Paolo State (Brazil). Ecological Economics, 66, 359–370.
Andkjaer, S., & Arvidsen, J. (2015). Places for active outdoor recreation - A scoping review. Journal of Outdoor Recreation and Tourism, 12, 25–46.
Andrea, V., Tampakis, S., Tsantopoulos, G., & Skanavis, C. (2013). Locals' and visitors' views on infrastructure and services in protected areas: Case study from Evros Greece. International Journal of Greening Economics, 7, 358–373. Arabatzis, G., & Grigoroudis, E. (2010). Visitors' satisfaction, perceptions and gap
analysis: The case of Dadia- Lefkimi- Souflion National Park. Forest Policy and Economics, 12, 163–172.
Arechavala, N. S., Zarzosa, P., & Trapero, P. B. (2015). The economic crisis and its effects on the quality of life in the European Union. Social Indicators Research, 120, 323–343.
Atauri, J., Bravo, M., & Ruiz, A. (2000). Visitors' landscape preferences as a tool for management of recreational use in natural areas: A case study in Sierra de Guadarrama (Madrid, Spain). Landscape Research, 25, 49–62.
Bigne, J. E., Andreu, L., & Gnoth, J. (2005). The theme park experience: An analysis of pleasure arousal and satisfaction. Tourism Management, 26, 833–844.
Brace, I. (2009). Questionnaire design: How to plan, structure and write survey material for effective market research Philadelphia. PA: Kogan Page. Budruk, M., Schneider, I. E., Andreck, K. L., & Virde, R. J. (2002). Crowding and
satisfaction among visitors to a built desert attraction. Journal of Park and Recreation Administration, 20, 1–17.
Byrne, J., Wolch, J., & Zhang, J. (2009). Planning for environmental justice in an urban national park. Journal of Environmental Planning and Management, 52, 365–392. Cavnar, M. M., Kirtland, K. A., Evans, M. H., Wilson, D. K., Williams, J. E., Mixon, G. M., & Henderson, K. A. (2004). Evaluating the quality of recreation facilities: Developing an assessment tool. Journal of Park and Recreation Administration, 22, 96–114. Colson, V., Garcia, S., Rondeux, J., & Pejeune, L. (2010). Map and determinants of
woodlands visiting in Wallonia. Urban Forestry and Urban Greening, 9, 83–91. Howitt, D., & Gramer, D. (2003). Statistics with SPSS 11 and Windows Athens:
Klidarithmos.
Dasdemir, I. (2005). Improving operational planning and management of National Parks in Turkey: A case study. Environmental Management, 35, 247–257.
Deng, J., Qiang, S., Walker, G. J., & Zhang, Y. (2003). Assessment on and perception of visitors' environmental impacts of nature tourism: A case study of Zhangjiajie National Forest Park, China. Journal of Sustainable Tourism, 11, 529–548. Department of Forests (2014). Republic of Cyprus, Ministry of Agriculture, Natural
Resources and Environment. [Internet]. [cited 2015 Jan 25].〈http://www.moa.gov. cy/moa/fd/fd.nsf/DMLparks_en/DMLparks_en?OpenDocument〉
Duzgunes, E., & Demirel, O. (2013). Determining the tourism potential of the Altindere Valley National Park (Trabzon/Turkey) with respect to its conservation value. International Journal of Sustainable Development and World Ecology, 20, 358–368.
Ehrenfeld, D. W. (1978). The conservation of non-resources. American Scientist, 64, 648–656.
Ewert, A. W., Chavez, D. J., & Magill, A. W. (1993). Culture, conflict and communication at the Wildlands-Urban interface Boulder: Westview Press.
Ferreira, S., & Harmse, A. (2014). Kruger National Park: Tourism development and issues around the management of large numbers of tourists. Journal of Ecotourism, 13, 16–34.
Gandiwa, E., Zisadsa- Gandiwa, P., Muboko, N., Libombo, E., Mashapa, C., & Gawazani, R. (2014). Local people's knowledge and perceptions of wildlife conservation in southeastern Zimbabwe. Journal of Environmental Protection, 5, 475–481. Gorner, T., & Cihar, M. (2011). Seasonal differences in visitor perceptions: A comparative
study of three mountainous National Parks in Central Europe. Journal of Environmental Protection, 2, 1046–1054.
Jankovska, I., Donis, J., Straupe, I., Panagopoulos, T., & Kupfere, L. (2013). Assessment of the forest recreational accessibility in Latvia. Fresenius Environmental Bulletin, 22, 2145–2151.
Jones, N., Iosifides, T., Evangelinos, K., Florokarpi, I., & Dimitrakopoulos, P. (2012). Investigating knowledge and perceptions of citizens of the National Park of Eastern Macedonia and Thrace, Greece. International Journal of Sustainable Development and World Ecology, 19, 25–33.
Jones, N., Panagiotidou, K., Spilanis, I., Evangelinos, K. I., & Dimitrakopoulos, P. G. (2011). Visitors' perceptions on the management of an important nesting site for logger head sea turtle (Caretta caretta L.): The case of Rethymno coastal area in Greece. Ocean and Coastal Management, 54, 577–584.
Kalamatianou, A. G. (2000). Social statistics, methods of one-dimensional analysis Athens: The Economic Publications.
Karlis, D. (2005). Multivariate statistical analysis Athens: Ath. Stamoulis Publications. Lawton, I. L., & Weaver, D. B. (2008). Factors associated with non-visitation by area
residents to Congaree National Park South Carolina. Journal of Park Recreation and Administration, 26, 66–82.
Loures, L., Loures, A., Nunes, J., & Panagopoulos, T. (2015). Landscape valuation of environmental amenities throughout the application of direct and indirect methods. Sustainability, 7, 794–810.
Manfredo, M., Vaske, J., Bruyere, B., Field, D., & Brown, P. (2004). Society and natural resources: A summary of knowledge. Modern Litho, Jefferson.
Manning, R. (2007). Parks and carrying capacity: Commons without tragedy Washington DC: Island Press.
Manning, R. (2011). Studies in outdoor recreation: Search and research for satisfaction Cornalis, Oregon State: University Press.
Manning, R., Wang, B., Valliere, W., Lawson, S., & Newman, P. (2002). Research to estimate and manage carrying capacity of a tourist attraction: A study of Alcatraz Island. Journal of Sustainable Tourism, 10, 388–403.
Mayer, M. (2014). Can nature-based tourism benefits compensate for the costs of national parks? A study of the Bavarian Forest National Park, Germany. Journal of Sustainable Tourism, 22, 561–583.
Panagopoulos, T. (2009). Linking forestry, sustainability and aesthetics. Ecological Economics, 68, 2485–2489.
Panagopoulos, T., Duque, J. A. G., & Dan, M. B. (2016). Urban planning with respect to environmental quality and human well-being. Environmental Pollution, 208, 137–144.http://dx.doi.org/10.1016/j.envpol.2015.07.038.
Papageorgiou, K., & Brotherton, I. (1999). A management planning framework based on ecological, perceptual and economic carrying capacity: The case study of Vikos-Aoos National Park, Greece. Journal of Environmental Management, 56, 271–284. Papageorgiou, K., & Kassioumis, K. (2005). The national park policy context in Greece:
Park users; perspectives of issues in park administration. Journal of Natural Conservation, 13, 231–246.
Pickering, C. M., & Hill, W. (2007). Impacts of recreation and tourism on plant biodiversity and vegetation in protected areas in Australia. Journal of Environmental Management, 85, 791–800.
Rittichainuwat, B. N., Qu, H. L., & Mongknonvanit, C. (2002). The study of the impact of travel satisfaction on the likelihood of travellers to revisit Thailand. Journal of Travel and Tourism Marketing, 12, 19–43.
Roemer, J., & Vaske, J. (2014). National park service visitor satisfaction: A comparative analysis. Journal of Park and Recreation, 32, 35–51.
Romagosa, F., Eagles, P., & Lemieux, C. (2015). From the inside out to the outside in: Exploring the roles of parks and protected areas as providers of human health and well-being. Journal of Outdoor Recreation and Tourism, 10, 70–77.
Rossi, R. D., Byrne, A. J., Pickering, M. C., & Reser, J. (2015).“Seeing red” in national parks: How visitors' values affect perceptions and park experiences. Geoforum, 66, 41–52.
Rupprecht, C. D., & Byrne, J. A. (2014). Informal urban green–space: Comparison of quantity and characteristics in Brisbane, Australia and Sapporo, Japan. PLoS One, 9(6), e99784.http://dx.doi.org/10.1371/journal.pone.0099784.
Santucci, D., Floyd, M., Bocarro, J., & Henderson, K. (2014). Visitor services staff perceptions of strategies to encourage diversity at two urban National Parks. Journal of Park and Recreation Administration, 32, 15–28.
Sharma, S. (1996). Applied multivariate techniques Canada: John Wiley Sons, Inc. Statistical Service (2014). Survey on Inc.,ome and Living Conditions of Households,
2010–2013. Ministry of Economics of Cyprus, available at〈http://www.mof.gov.cy/ mof/cystat/statistics.nsf〉Consulted 01.11.14.
Sterl, P., Brandenburg, C., & Arnberger, A. (2008). Visitors' awareness and assessment of recreational disturbance of wildlife in the Donau-Auen national Park. Journal for Nature Conservation, 16, 135–145.
Tampakis, S., Karanikola, P., Tsantopoulos, G., & Andrea, V. (2014). The role of forest protected areas: A gateway community resident approach, case evidence from Cyprus. Journal of Food, Agriculture and Environment, 12, 374–377. Tian-Cole, S., Crompton, J., & Willson, V. (2002). An empirical investigation of the
relationships between service quality, satisfaction and behavioral intentions among visitors to a wildlife refuge. Journal of Leisure Research, 34, 1–24.
Filias, V., Pappas, P., Antonopoulou, M., Zarnari, O., Magganara, I., Meimaris, M. Psychogios, I. (2000). Introduction of the methodology and techniques of social research Athens: Gutenberg Social Library.
Vaske, J. (2008). Survey research and analysis: Application in parks, recreation, and human dimensions Pennsylvania: Venture Publishing, Inc; State College. Vaske, J., & Roemer, M. (2013). Differences in reported satisfaction ratings by
consumptive and nonconsumptive recreationists: A comparative analysis of three decades of research. Human Dimensions of Wildlife, 18(3), 1–22.
Vistad, O. (2003). Experience and management of recreational impact on the ground a study among visitors and managers. Journal of Nature Conservation, 11(4), 363–369.
Vokou, D., Dimitrakopoulos, P. G., Jones, N., Damialis, A., Monokrousos, N., Pantis, J. D., & Mazaris, A. D. (2014). Ten years of co-management in Greek protected areas: An evaluation. Biodiversity and Conservation, 23, 2833–2855.
Worboys, G., Delacy, T., & Lockwood, M. (2005). Protected area management: Principals and practice (2nd ed.) Cambridge: Cambridge University Press. Yuksel, A. (2001). Managing customer satisfaction and retention: A case study of tourist
destinations, Turkey. Journal of Vocation Marketing, 7(2), 153–168.