Carbon and water footprints in Brazilian coffee
plantations - the spatial and temporal distribution
L.D. Martins
1*, F.C. Eugenio
1, W.N. Rodrigues
1, M.A. Tomaz
1, A.R. dos Santos
1, J.C. Ramalho
2,31Geotechnology Applied to Global Environment – CNPq Advanced Research Group (GAGEN). Dept. Produção Vegetal, Centro de Ciências
Agrárias (CCA), Univ. Federal do Espírito Santo (UFES), Alto Universitário, Caixa Postal 16, CEP 29500-000, Alegre, ES, Brazil, 2
Plant-Environment Interactions & Biodiversity Lab (PlantStress&Biodiversity), Linking Landscape, Plant-Environment, Agriculture and Food, (LEAF), Dept. Recursos Naturais, Ambiente e Território (DRAT), Instituto Superior de Agronomia (ISA), Universidade de Lisboa (ULisboa), Quinta do Marquês, Av. República, 2784-505 Oeiras, Portugal, 3GeoBioTec, Faculdade de Ciências Tecnologia (FCT), Universidade NOVA de Lisboa
(UNL), 2829-516 Caparica, Portugal
*Corresponding author:
L.D. Martins, Geotechnology Applied to Global Environment – CNPq Advanced Research Group (GAGEN). Dept. Produção Vegetal, Centro de Ciências Agrárias (CCA), Univ. Federal do Espírito Santo (UFES), Alto Universitário, Caixa Postal 16, CEP 29500-000, Alegre, ES, Brazil. E-mail: [email protected]
Received: 21 January 2018; Accepted: 30 May 2018
INTRODUCTION
Climate changes and global warming estimates for the
present century (IPCC, 2013; 2014), raise important
uncertainties related to future sustainability of the coffee
crop production, based on
Coffea arabica L. (Arabica coffee)
and
Coffea canephora Pierre ex A. Froehner (Robusta coffee)
that account together for approximately 99% of world
coffee production. Recent works have been shown that the
estimated increase in air [CO
2] could have a positive impact
on the coffee plants, since it strengthens photosynthetic
performance (Ramalho et al., 2013; DaMatta et al., 2016).
Furthermore, enhanced air [CO
2] can significantly mitigate
the predicted physiological heat impacts, as regards leaf
mineral balance (Martins et al., 2014), the triggering
of defence mechanisms and gene expression patterns
(Martins et al., 2016; Rodrigues et al., 2016), and, ultimately,
contributing to preserve coffee bean quality (Ramalho et al.,
2018). Nevertheless, several reports predicted important
reductions of suitable areas, and increases in pest incidence,
particularly as concerns
Coffea arabica L., largely related to the
increase of average air temperature, intra-seasonal variability
of temperature and water availability (Bunn et al., 2015;
Craparo et al., 2015; Magrach and Ghazoul, 2015; Martins
et al., 2017), with impact on the livelihoods of millions of
small householders. Although, elevated air [CO
2] has the
ability to soften the predicted impacts of supra-optimal
temperatures, it seems indisputable that impacts from
climate changes are already happening (Craparo et al., 2015;
van der Vossen et al., 2015), with growing socioeconomic
impacts caused by progressive and extreme climatic events,
mainly reported on Central and South America. Moreover,
the future scenarios of climate changes show a reduction
in areas with annual mean rainfall effective for coffee
The future of many coffee growing regions, such as Brazil, depends on strategies to allow the minimization of the negative impacts of climate change. Still the own contribution of coffee cultivation for global warming is largely unknown. Water and carbon footprints are concepts that indicate the potential negative impact of a specific product, underlining which part of the process is the major responsible for it. In this context, the objective of this study was to quantify and spatialize the water and carbon footprints from coffee crop in different regions of Brazil, and to find the proportional weight of coffee production in the total emission of CO2 and water consumption in the context of Brazilian agriculture. For this end, water and carbon footprints were estimated and spatialized for Brazilian regions along 10 productive seasons (from 2004/2005 to 2014/2015), based on data of plantation area (ha) and coffee production (tons of beans). It is concluded that the estimates of annual carbon and water footprints were 19.791 million t CO2-equivalent and 49,284 million m3 of
water, with higher values from the Southeast region. This corresponded to a moderate (ca. 5%) value for the emissions of greenhouse gases, but a relevant water footprint in the context of Brazilian agriculture.
Keywords: Carbon and water footprint; Climate changes; Coffee bean production
http://www.ejfa.me/
R E G U L A R A R T I C L E
production (Chapagain and Hoekstra, 2007; Eriyagama
et al., 2014). These findings reinforces the need for the
implementation of mitigation and adaptation strategies,
aiming at decrease the impact of climate changes and
global warming on the coffee production and quality
(Rikxoort et al., 2014; Rahn et al., 2014; Bunn et al., 2015;
Dubberstein et al., 2018). These strategies of mitigation
and adaptation to climatic vulnerability must include the
increase of C-sequestration, decreasing carbon footprint,
and of water footprint required to grow coffee trees and
to produce coffee beans (Läderach et al., 2010; Rikxoort
et al., 2014; Rahn et al., 2014).
There are few reports about strategies to produce coffee
under influence of climatic stresses, whereas considering
as well the need to decrease its carbon and water footprint.
Some results show that cropping coffee under shaded
conditions may reduce up to 56% of carbon footprint
(Hergoualc’h et al., 2012). Furthermore, this mitigation
strategy promoted increases in carbon stock up to 32 t CO
2-eq ha
-1(Soto-Pinto et al., 2010; Hergoualc’h et al., 2012).
Furthermore, the use of agroforestry systems for coffee
cultivation can turn a coffee area from a carbon emitter to
a carbon sequestration (Andrade et al. 2014). Carbon stock
in green biomass (coffee tree) has not been included in
carbon footprint of the product. However, spatial estimates
indicates that its quantification may reduce 92% of carbon
footprint, revealing the mitigation potential of the coffee
plantation itself (Martins et al., 2015).
Disturbing signs are also attributed to water footprint in
coffee production, since it is estimated that one single
coffee cup requires the use of near 140 litters of water,
being the most part attributed to growing the trees. This
fact unveils the impact of bean processing over the
water footprint, since only 0.4% of the footprint comes
from coffee processing (Chapagain and Hoekstra, 2007).
Currently, the initial estimates suggest that between 8.2
and 26.3 cubic meters of water are used in the production
of 1 kilogram of green coffee; varying between regions,
species and cultivation systems (Chapagain and Hoekstra,
2007; Eriyagama et al., 2014).
Overall, studies involving carbon and water footprints due
to coffee production showed that most efforts are being
developed in regions between 0°N and 30°N of latitude,
especially for countries of Central America, Africa and
part of Asia, with only a few reports for regions between
0°S and 30°S of latitude, where Brazil is located. Ironically,
Brazil stands for near 30% of world coffee production, with
annual exports yielding
ca. 5600 million USD (ICO, 2016).
This numbers indicate a dimensions of the socioeconomic
important of coffee in Brazil, therefore, any modification
in the climatic aptitude expected for the regions between
0°S and 30°S of latitude (Bunn et al., 2015; Magrach
and Ghazoul, 2015) would cause large impacts in coffee
production.
The objective of this study was (i) to accurately estimate
and spatialize the water and carbon footprints due to the
coffee crop from different regions of Brazil along ten
years; and (ii) to quantify the proportional responsibility of
coffee production in the total emission of CO
2and water
consumption of Brazilian agriculture.
MATERIAL AND METHODS
Case study and time-series.
This study was performed
considering Brazil (area: 8,515,767.049 km
2), located at
latitude and longitude of 10° S and 55° W. The geographic
stratification of the area planted with coffee trees (ha) was
carried out based on data of plantation area (ha) and coffee
production (tons of beans), from 10 productive cycles of
the species
Coffea arabica L. and Coffea canephora Pierre ex
A. Froehner, from 2004/2005 to 2014/2015, based on the
agricultural census (Table 1).
Calculation of carbon and water footprints.
The carbon
footprint (t CO
2-eq) was calculated using the Cool Farm Tool
(CFT) (Hillier et al., 2011), based on the coefficient determined
for coffee produced (beans) in commercial unshaded
monocultures (Rikxoort et al., 2014). This coefficient is
between 6.2 and 9.0 t CO
2-eq t
-1of produced coffee beans,
therefore, an average of 7.6 t CO
2-eq t
-1of coffee beans was
used for standardization. The water footprint (m
3) of green
coffee was calculated using the coefficient based in virtual
water content, representing the volume of water required
to produce green coffee. The most suitable coefficient for
Brazil is 18,925 m
3t
-1(water volume per green coffee beans
mass, processed through the wet method) (Chapagain and
Hoekstra, 2007). Data of 10 consecutive years of cultivation
were used to calculate carbon and water footprints for
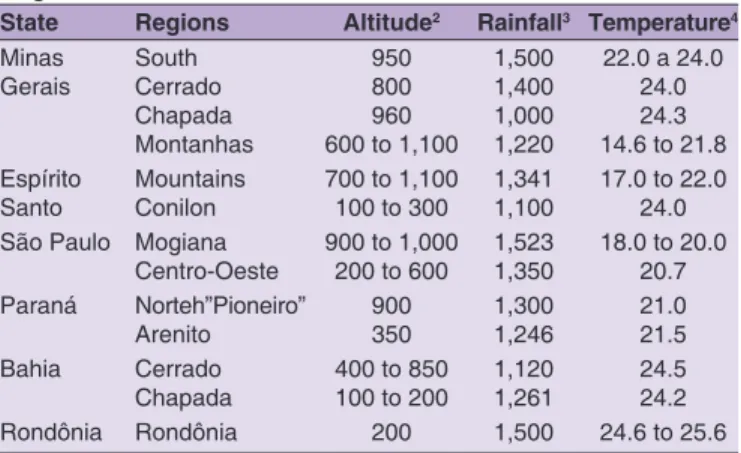
Table 1: Summary of the climatic means of coffee producing regions in Brazil1
State Regions Altitude2 Rainfall3 Temperature4
Minas
Gerais SouthCerrado Chapada Montanhas 950 800 960 600 to 1,100 1,500 1,400 1,000 1,220 22.0 a 24.0 24.0 24.3 14.6 to 21.8 Espírito
Santo MountainsConilon 700 to 1,100100 to 300 1,3411,100 17.0 to 22.024.0 São Paulo Mogiana
Centro-Oeste 900 to 1,000200 to 600 1,5231,350 18.0 to 20.020.7 Paraná Norteh”Pioneiro” Arenito 900350 1,3001,246 21.021.5 Bahia Cerrado Chapada 400 to 850100 to 200 1,1201,261 24.524.2 Rondônia Rondônia 200 1,500 24.6 to 25.6
coffee production systems, because previous studies have
reported this as representing the time of maximum carbon
accumulation in coffee plants (Rodrigues et al., 2000).
Spatialization and data analysis.
The data of carbon
water footprints were grouped for regions of the Brazil
(South, South East, Central West, Northeast and North)
and statistically analyzed for normality verification
(Kolmogorov-Smirnov, level of significance of 0.05)
through the Genes program (Cruz, 2013). All spatialization
representations were performed with the program
ArcGIS® (version 10.2, ESRITM).
RESULTS AND DISCUSSION
The higher estimates for carbon footprint (CFP) and water
footprint (WFP) in coffee monocultures (
C. arabica and
C. canephora) were found in Southeast region of Brazil and
the lower estimates of CFP and WFP were obtained in the
Center-West region (Fig 1, Fig 2; Table 2).
This differences in the distribution was somewhat expected,
since the Southeast region presents the largest plantation
areas and high level of production of coffee fruits (Table 2)
(Martins et al., 2015), while the Center-West region presents
agricultural suitability for others species, such as soybean
and corn, implicating smaller areas for coffee cultivation.
However, coffee production is gradually advancing for
central areas of Brazil supported by large scale irrigation
schemes, which would increase CFP and WFP of this
region in the near future (Fernandes et al., 2012).
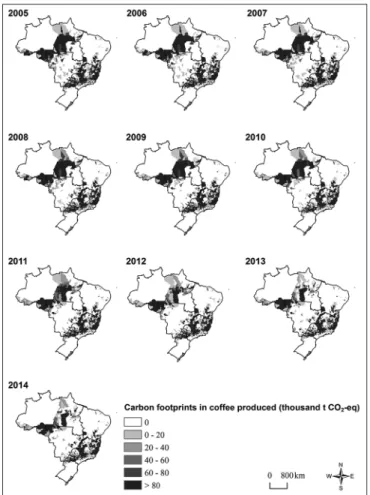
The spatial distribution reveals that carbon footprint in Brazil
varied between 16 million t CO
2-eq during the 2005/2006
season and 22 million t CO
2-eq during 2010/2011,
2012/2013 and 2013/2014 seasons (Fig 1). Water
footprint spatialization varied between 40,000 million m
3during 2005/2006 season up to 57,000 million m
3during
2012/2013 season (Fig 2). The lower CFP and WFP from
2005/2006 season may be explained by the implication
of climatic adversities occurred in coffee plantations,
especially in Southeast region and north of Paraná state
(South region), allied to the renovation of coffee plantation
in large areas of Southeast region, mainly in Espírito Santo
state (Southeast region) and south of Bahia state (Northeast
region). Higher estimates CFP and WFP during 2012/2013
season are related to the interaction of favorable climatic
events to the exploration of the potential from the areas
that were being renovated with new technologies from the
early 2000s (Martins et al., 2015).
The estimates indicate that during 10 consecutive years,
the coffee plantations in Brazil were responsible for a CFP
of near 198 million t CO
2-eq (Table 2), corresponding to
only 1.14% of the estimated total of Brazilian emissions
of CO
2-eq between 2005 and 2014 (
ca. 17,429 million Ton
CO
2-eq) (SEEG, 2015). Furthermore, coffee CFP had a
modest contribution of
ca. 5% of the total emissions from
agriculture activities in Brazil, estimated in 4,030 million
Fig 1. Spatial distribution of Carbon Footprint (million t CO2-eq) for
coffee monoculture (C. arabica and C. canephora) in Brazil, during 10
production years (from 2004/2005 to 2014/2015). (Universal transverse mercator projection; ellipsoid SIRGAS 2000, zona 24 k).
Table 2: Production of coffee bean (million Ton) and estimate Carbon Footprint (million t CO2‑equivalent) and Water
Footprint (x 1000 million m3) for coffee monoculture
(C. arabica and C. canephora) in regions of Brazil, during 10 production years (from 2004/2005 to 2014/2015)
Region Coffee beans
(million t) Carbon Footprint(million t CO2‑equivalent) Water Footprint (x1000 million m3) North 1.111 8.443 21.024 Northeast 1.556 11.827 29.450 Central-West 0.313 2.380 5.927 Southeast 21.894 166.394 414.342 South 1.168 8.874 22.097 Total 26.042 197.917 492.840 Standard deviation 0.003 0.020 51 Annual average 2.604 19.792 49.284
Ton CO
2-eq from 2005 to 2015 (SEEG, 2015). Even
considering that this coffee CFP values were expressive,
the present results do not consider the amount of carbon
stocked in the vegetation from the varied cultivation
systems of
Coffea spp., which can mitigate up to 92% of the
in-farm carbon footprint from Brazilian coffee (Soto-Pinto
et al., 2010; Hergoualc’h et al., 2012; Martins et al., 2015).
Considering the total volume of water used for world crop
production regarding the main crops, coffee is responsible
to
ca. 2% WFP (Hoekstra and Chapagain, 2006). However,
due to the importance of coffee crop to the tropical are,
a larger weight of this crop can expected as concerns
the tropical agriculture in general and the Brazilian one
in particular. Based on the virtual water consumption
coefficient (Chapagain and Hoekstra, 2007), the WFP from
Brazilian coffee will reach values close to 49,300 million m
3per year (Table 2), which is an important WFP as compared
to the water consumption by irrigated agriculture in Brazil,
which is estimated to represent 23,500 million m
3per year
(ANA, 2017). Nevertheless, although giving a broad idea,
are not directly comparable, since the estimate for water
consumption by irrigated agriculture in Brazil only includes
a small part of the coffee crop. Indeed, recent estimates
pointed that irrigated coffee represented only 5.9% of the
total area for this crop, with an impact of 6.3% regarding
the water spent for the main crops (rice, sugar-cane, corn,
bean, soya, wheat) (FGV-EESP, 2016).
Overall, the results for coffee plantations in Brazil indicate
higher carbon and water footprints from the Southeast
region. C-footprint estimates correspond to only 5% of
the emissions of greenhouse gasses. Moreover, 92% of
the carbon footprint may be further mitigated if we take
into account the carbon sequestration on the biomass of
coffee trees. In contrast a large coffee water foodprint
can be expected considering its water use in the context
of the tropical and Brazilian agriculture (under irrigated
and, particularly, non-irrigated cropping systems). Further
studies are needed to confirm and actualize these first
estimates, considering the growing importance of global
irrigated agriculture (including coffee), the predicted
scarcity of water resources under a context of climate
changes, and the required sustainable management of
water resources.
ACKNOWLEDGMENTS
This work was supported by UFES, CNPq (LDM –
post-doc scholarship; MAT and ARS - scholarship of research
productivity), CAPES (FCE – doctor scholarship), FAPES
(LDM – post-doc scholarship and project financial
support- EDITAL FAPES/CNPq Nº 012/2014 - DCR;
WNR – post-doc scholarship), all from Brazil. The
work was further supported by Portuguese funds from
Fundação para a Ciência e a Tecnologia through the
projects PTDC/AGRPRO/3386/2012, and the research
units UID/AGR/04129/2013 (LEAF) and UID/
GEO/04035/2013(GeoBioTec).
REFERENCES
Andrade, H. J., M. A. Segure, D. S. Canal, M. Feria, J. J. Alvarado, L. M. Marin, D. Pachón and M. J. Gómez. 2014. The carbon footprint of coffee production chains in Tolima, Colombia. In: M. Oelbermann (Ed), Sustainable Agroecosystems in Climate Change Mitigation, Ch. 3. Academic Publishers, Wageningen, pp. 53-66. DOI: 10.3920/978-90-8686-788-2_3
ANA - Agência Nacional de Águas. 2017. Atlas Irrigação - Uso da Água na Agricultura Irrigada. Superintendência de Planejamento de Recursos Hídricos (SPR), Brasilia, Brazil. p. 86.
Bunn, C., P. Läderach, O. O. Rivera and D. Kirschke. 2015. A bitter cup: Climate change profile of global production of Arabica and Robusta coffee. Clim. Change, 129: 89-101.
Chapagain, A. and A. Hoekstra. 2007. The water footprint of coffee and tea consumption in the Netherlands. Ecol. Econ., 64: 109-118. Craparo, A. C. W., P. J. A. van Asten, P. Läderach, L. T. P. Jassogne
and S. W. Grab. 2015. Coffea arabica yields decline in Tanzania
Fig 2. Spatial distribution of Water Footprint (million m3) for coffee
monoculture (C. arabica and C. canephora) in Brazil, during 10
production years (from 2004/2005 to 2014/2015). (Universal transverse mercator projection; ellipsoid SIRGAS 2000, zona 24 k).
due to climate change: Global implications. Agric. Forest Meteo., 207: 1-10.
Cruz, C. D. 2013. GENES - Software for analysis in experimental statistics and quantitative genetics. Acta Sci. Agron., 35: 271-276. DaMatta, F. M., A. G. Godoy, P. E. Menezes-Silva, S. C. V. Martins,
L. M. V. P. Sanglard, L. E. Morais, A. Torre-Neto and R. Ghini. 2016. Sustained enhancement of photosynthesis in coffee trees grown under free-air CO2 enrichment conditions: Disentangling
the contributions of stomatal, mesophyll, and biochemical limitations. J. Exp. Bot., 67: 341-352.
Dubberstein, D., W. P. Rodrigues, J. N. Semedo, A. P. Rodrigues, I. P. Pais, A. E. Leitão, F. L. Partelli, E. Campostrini, F. Reboredo, P. Scotti-Campos, F. C. Lidon, A. I. Ribeiro-Barros, F. M. DaMatta and J. C. Ramalho. 2018. Mitigation of the negative impact of warming on the coffee crop - The role of increased air [CO2] and
management strategies. In: Srinivasarao, C. H., A. K. Shanker and C. Shanker (Eds.), Climate Resilient Agriculture - Strategies and Perspectives, InTech.
Eriyagama, N., Y. Chemin and R. Alankara. 2014. A methodology for quantifying global consumptive water use of coffee for sustainable production under conditions of climate change. J. Water Clim. Change, 5: 1-23.
FGV-EESP. 2016. Estudo sobre eficiência do uso da água no Brasil: Análise do impacto da irrigação na agricultura brasileira e potencial de produção de alimentos face ao aquecimento global. FGV EESP. GV Agro, Centro de Estudos do Agronegócio, Brazil. Available from: http://www.bibliotecadigital.fgv.br/dspace/ handle/10438/17625.
Fernandes, A. L. T., F. L. Partelli, R. Bonomo and A. Golynski. 2012. The modern coffee planting in the Brazilian savannah. Pesq. Agropec. Trop., 42: 231-240.
Hergoualc'h, K., E. Blanchart, U. Skiba, C. Hénault and J. M. Harmand. 2012. Changes in carbon stock and greenhouse gas balance in Coffea arabica monoculture versus an agroforestry system with Inga densiflora, in Costa Rica. Agric. Ecosyst. Environ., 148: 102-110.
Hillier, J., C. Walter, D. Malin, T. Garcia-Suarez, L. Mila-i-Canals and P. Smith. 2011. A farm-focused calculator for emissions from crop and livestock production. Environ. Model. Softw., 26: 1070-1078. Hoekstra, A. Y. and A. K. Chapagain. 2007. Water footprints of
nations: Water use by people as a function of their consumption pattern. Water Resour. Manage., 21: 35-48.
IBGE - Instituto Brasileiro de Geografia e Estatística. 2015. Perfil dos Municípios Brasileiros - 2015. Available from: http://www. ibge.gov.br/home/estatistica/economia/perfilmunic/2015. [Last accessed on 2016 May].
ICO (International Coffee Organization). 2016. Trade Statistics. Available from: http://www.ico.org/trade_statistics.asp. [Last accessed on 2016 Jun].
IPCC (Intergovernmental Panel on Climate Change). 2013. Climate Change 2013: The Physical Science Basis. Summary for Policymakers, Technical Summary and Frequent Asked Questions. Part of the Working Group I Contribution to the Fifth Assessment Report of the Intergovernmental Panel on Climate Change. F. Stocker, D. Qin, G.-K. Plattner, M.M.B. Tignor, S.K. Allen, J. Boschung, A. Nauels, Y. Xia, V. Bex and P.M. Midgley. (Eds.), Intergovernmental Panel on Climate Change, p. 203. ISBN 978-92-9169-138-8.
IPCC (Intergovernmental Panel on Climate Change). 2014. Climate change 2014: Mitigation of climate change. In: Edenhofer, O., R. Pichs-Madruga, Y. Sokona, E. Farahani, S. Kadner, K. Seyboth, A. Adler, I. Baum, S. Brunner, P. Eickemeier, B. Kriemann, J. Savolainen, S. Schlömer, C. von Stechow, T. Zwickel and J. C. Minx (Eds.), Contribution of Working Group III
to the Fifth Assessment Report of the Intergovernmental Panel on Climate Change, UK and New York, USA, Cambridge, Cambridge University Press, p. 1435.
Läderach, P., J. Haggar, C. Lau, A. Eitzinger, O. Ovalle, M. Baca, A. Jarvis and M. Lundy. 2010. Mesoamerican Coffee: Building a Climate Change Adaptation Strategy, Cali, Colombia, CIAT Policy Brief n. 2, Centro Internacional de Agricultura Tropical (CIAT), p. 4.
Magrach, A. and J. Ghazoul. 2015. Climate and pest-driven geographic shifts in global coffee production: Implications for forest cover, biodiversity and carbon storage. PLoS One, 10: e0133071.
Martins, L. D., M. A. Tomaz, F. C. Lidon, F. M. DaMatta and J. C. Ramalho. 2014. Combined effects of elevated [CO2] and high
temperature on leaf mineral balance in Coffea spp. plants. Clim. Change, 126: 365-379.
Martins, L. D., F. C. Eugenio, W. N. Rodrigues, S. V. B. Brinate, T. V. Colodetti, J. F. T. Amaral, W. C. Jr. Jesus, J. C. Ramalho, A. R. Santos and M. A. Tomaz. 2015. A bitter cup: The estimation of spatial distribution of carbon balance in Coffea spp. plantations reveals increased carbon footprint in tropical regions. Plant Soil Environ., 61: 544-552.
Martins, L. D., F. C. Eugenio, W. N. Rodrigues, W. C. Jr. Jesus, M. A. Tomaz, J. D. C. Ramalho and A. R. Santos. 2017. Climatic Vulnerability in Robusta Coffee - Mitigation and Adaptation. 1st ed. Alegre-ES: CAUFES, Brazil. p. 52.
Martins, M. Q., W. P. Rodrigues, A. S. Fortunato, A. E. Leitão, A. P. Rodrigues, I. P. Pais, L. D. Martins, M. J. Silva, F. H. Reboredo, F. L. Partelli, E. Campostrini, M. A. Tomaz, P. Scotti-Campos, A. I. Ribeiro-Barros, F. C. Lidon, F. M. DaMatta and J. C. Ramalho. 2016. Protective response mechanisms to heat stress in interaction with high [CO2] conditions in Coffea spp. Front. Plant Sci., 7: 947.
Rahn, E., P. Läderach, M. Baca, C. Cressy, G. Schroth, D. Malin and J. Shriver. 2014. Climate change adaptation, mitigation and livelihood benefits in coffee production: Where are the synergies? Mitig. Adapt. Strat. Global Change, 19: 1119-1137. Ramalho, J. C., I. P. Pais, A. E. Leitão, M. Guerra, F. H. Reboredo,
C. Máguas, M. L. Carvalho, P. Scotti-Campos, A. I. Ribeiro-Barros, F. C. Lidon and F. M. DaMatta. 2018. Can elevated air [CO2]
conditions mitigate the predicted warming impact on the quality of coffee bean? Front. Plant Sci., DOI: 10.3389/fpls.2018.00287 Ramalho, J. C., A. P. Rodrigues, J. N. Semedo, I. P. Pais, L.
D. Martins, M. C. Simões-Costa, A. E. Leitão, A. S. Fortunato, P. Batista-Santos, I. M. Palos, M. A. Tomaz, P. Scotti-Campos, F. C. Lidon and F. M. DaMatta. 2013. Sustained photosynthetic performance of Coffea spp. under long-term enhanced [CO2].
PLoS One, 8: e82712.
Rikxoort, H. V., G. Schroth, P. Läderach and B. Rodríguez-Sánchez. 2014. Carbon footprints and carbon stocks reveal climate-friendly coffee production. Agron. Sust. Dev., 34: 887-897. Rodrigues, V. G. S., C. Castilla, R. C. Costa and C. Palm. 2000. Carbon
stocks in agroforestry systems with coffee in Rondônia - Brazil. In: Simpósio de Pesquisa dos Cafés do Brasil, 1, 2000, Poços de Caldas. Resumos Expandidos.
Rodrigues, W. P., M. Q. Martins, A. S. Fortunato, A. P. Rodrigues, J. N. Semedo, M. C. Simões-Costa, I. P. Pais, A. E. Leitão, F. Colwell, L. Goulao, C. Máguas, F. L. Partelli, E. Campostrini, P. Scotti-Campos, A. I. Ribeiro-Barros, F. C. Lidon, F. M. DaMatta and J. C. Ramalho. 2016. Long-term elevated air [CO2] strengthens
photosynthetic functioning and mitigates the impact of supra-optimal temperatures in tropical Coffea arabica and C.
canephora species. Global Change Biol. 22: 415-431.
SEEG - Sistema de Estimativas de Emissões de Gases de Efeito Estuda. 2015. Emissões no Brasil de 1970 a 2014. Available:
http://www.plataforma.seeg.eco.br/total_emission. [Last accessed 2016 May ???].
Soto-Pinto, L., M. Anzueto, J. Mendoza, G. J. Ferrer and B. Jong. 2010. Carbon sequestration through agroforestry in indigenous communities of Chiapas, Mexico. Agrofor. Syst., 78: 39-51. Van der Vossen, H., B. Bertrand and A. Charrier. 2015. Next
generation variety development for sustainable production of arabica coffee (Coffea arabica L.): A review. Euphytica, 204: 243-256.L. Goulao, C. Máguas, F.L. Partelli, E. Campostrini, P. Scotti-Campos, A.I. Ribeiro-Barros, F.C. Lidon, F.M. DaMatta and J.C. Ramalho. 2016. Long-term elevated air [CO2] strengthens photosynthetic functioning and mitigates the
impact of supra-optimal temperatures in tropical Coffea arabica and C. canephora species. Global Change Biol. 22: 415-431. SEEG - Sistema de Estimativas de Emissões de Gases de Efeito
Estuda. 2015. Emissões no Brasil de 1970 a 2014. Available: http://plataforma.seeg.eco.br/total_emission. Accessed in May 2016. [in Portuguese].
Soto-Pinto, L., M. Anzueto, J. Mendoza, G.J. Ferrer and B. Jong. 2010. Carbon sequestration through agroforestry in indigenous communities of Chiapas, Mexico. Agrofor. Syst., 78: 39-51. Van der Vossen, H., B. Bertrand and A. Charrier. 2015. Next generation
variety development for sustainable production of arabica coffee (Coffea arabica L.): A review. Euphytica, 204: 243-256.