THIS REPORT WAS PREPARED BY EUGEN FRIESEN, A MASTERS IN FINANCE STUDENT OF THE NOVA SCHOOL OF BUSINESS AND ECONOMICS, EXCLUSIVELY FOR ACADEMIC PURPOSES.THIS REPORT WAS SUPERVISED BY ROSÁRIO ANDRÉ WHO REVIEWED THE
VALUATION METHODOLOGY AND THE FINANCIAL MODEL. (SEE DISCLOSURES AND DISCLAIMERS AT END OF DOCUMENT)
See more information at WWW.NOVASBE.PT Page 1/31
M
ASTERS IN
F
INANCE
E
QUITY
R
ESEARCH
Source: Bloomberg, Analyst estimates We value ArcelorMittal at 15.49€. That corresponds to a
price premium of 12.8% compared to its closing price on January 4th, 2013 on the Amsterdam Exchange.
Challenging situation at the turn of the year. The
industry enters 2013 with modest hopes. Main issues remain global overcapacities and absent steel appetite.
Downgrades and deleveraging. In 2012 ArcelorMittal
was downgraded to junk status. Investment grade is of strategic importance for the company, according to the management board. Therefore dividends were cut by 73% to 20 cents per share and further assets sold.
Significant asset sale activity on-going. ArcelorMittal
entered 2013 by selling 15% of its mining operations in Canada for a reported $1.1bn. Further non-core asset sales are expected for 2013.
Dispute with French Government. Due to lagging
demand in Europe, plants need to be closed, which could cause social unrest. Socialist government reacted hostile to company’s plans to partly close Florange plant.
Company description
ArcelorMittal is the biggest steel producer and the fourth biggest iron ore mining company in the world. It has operations worldwide in more than 20 countries and is divided into six operating segments, employing around 260.000 people worldwide.
A
RCELOR
M
ITTAL
C
OMPANY
R
EPORT
M
ETALS
&
M
INING
J
ANUARY7
TH2012
E
UGEN
F
RIESEN
–
M
ST
16000445
[email protected]
Pioneering the steel business
Focus on core assets and vertical integration
Recommendation: BUY
Vs Previous Recommendation BUY
Price Target FY13: 15.49 €
Vs Previous Price Target 18.06 €
Price (as of 7-Jan-13) 13.51 €
Reuters: MT.N, Bloomberg: MT 52-week range (€) 10.60-17.96 Market Cap (€m) 21.080 Outstanding Shares (m) 1.561 Source: Bloomberg 0 50 100 150 Ja n 1 2 F e b 1 2 M a r 1 2 A p r 1 2 M a y 1 2 Ju n 1 2 Ju l 1 2 A u g 1 2 Se p 1 2 O ct 1 2 N o v 1 2 D e c 1 2 Ja n 1 3 MT Stoxx 50 Source: Bloomberg
(Values in $ millions) 2011 2012E 2013F
Revenues 93.973 85.107 85.721 EBITDA 9.898 6.355 11.375 Net Profit 1.798 -856 2.660 EPS 0,96 -0,04 0,71 P/E 15,75 N/A 18,79 ROIC 4,9% 1,5% 6,5% Dividend yield 2,2% 3,4% 4,1%
ARCELORMITTAL COMPANY REPORT PAGE 2/31
Table of Contents
VALUATION ... 3
COMPANY OVERVIEW ... 5
HISTORY ... 6 ACQUISITIONS/DIVESTMENTS ... 7 COMPANY STRUCTURE ... 7 SHAREHOLDER STRUCTURE ... 8STEEL INDUSTRY ... 9
PRODUCTION PROCESSES ... 9 PROTECTIONISM ... 12HIGH FRAGMENTATION OF INDUSTRY ... 13
CUSTOMERS ... 14
SUBSTITUTE PRODUCTS ... 14
OPERATIONS ANALYSIS ... 15
Flat Carbon Americas (FCA) ... 15
Flat Carbon Europe (FCE) ... 16
Long Carbon Americas & Europe ... 17
AACIS ... 17 Distribution Solutions ... 18 COMPETITIVE ADVANTAGE ... 19
MINING INDUSTRY ...20
INDUSTRY CONSOLIDATION ... 20 PRICING MECHANISM ... 21 TREND ... 22 OPERATIONS ANALYSIS ... 22COMPARABLES ...23
STEEL SECTOR ... 23 MINING SECTOR ... 25FINANCIALS ...26
CREDIT RATINGS ... 26 DEBT SITUATION ... 27 CAPITAL STRUCTURE ... 28OUTLOOK ...29
FINANCIAL STATEMENTS ...30
DISCLOSURES AND DISCLAIMER ...31
ARCELORMITTAL COMPANY REPORT
PAGE 3/31
Valuation
We valued ArcelorMittal by using a Discounted Cash Flow analysis with an explicit projected forecast period until 2016. We computed sales assumptions for each of the six operating segments. Free Cash flows were calculated separately for the company’s steel operations and its mining operations in order to account for ArcelorMittal’s increasing vertical integration with iron ore and carbon mining activities. Accordingly we applied different discount rates for the free cash flows of the two segments and different growth rates for the terminal value calculation. The price target is based on a blend of three different scenarios we computed, with the base scenario accounting for 80% of our price target, the best scenario weighting 5% and the worst scenario contributing with a weight of 15% to the price target. The larger weight of the worst case scenario compared to the best case scenario can be explained by the likelihood of either event occurring. Scenario Analysis
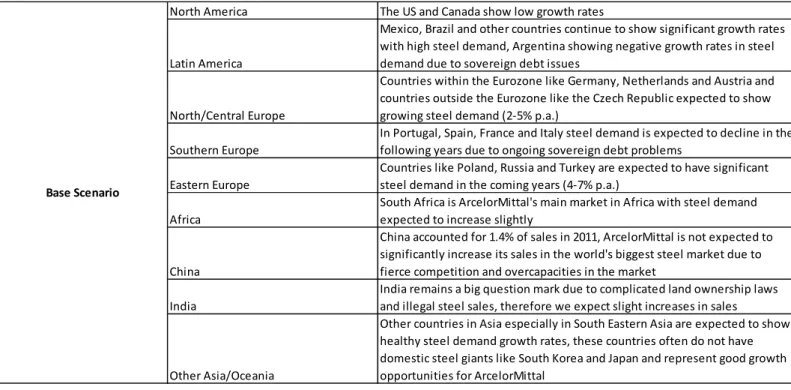
The scenarios correspond to the base, best and worst case scenario for the company in the future. The scenarios are based on assumptions for the development of every single economy, in which ArcelorMittal generated significant sales in the past. This proves to be useful in our case, since ArcelorMittal is closely linked to the condition of the overall economy. Table 1 illustrates the assumptions made for each economic area in the base scenario.
DCF Analysis
Explicit forecast period for 2012-2016 3 Scenarios Weights: 80% Base Case 15% Worst Case 5% Best Case
Table 1 – Assumptions for future steel demand per region
Increasing vertical integration considered by separately valuing iron ore activities
North America The US and Canada show low growth rates
Latin America
Mexico, Brazil and other countries continue to show significant growth rates with high steel demand, Argentina showing negative growth rates in steel demand due to sovereign debt issues
North/Central Europe
Countries within the Eurozone like Germany, Netherlands and Austria and countries outside the Eurozone like the Czech Republic expected to show growing steel demand (2-5% p.a.)
Southern Europe
In Portugal, Spain, France and Italy steel demand is expected to decline in the following years due to ongoing sovereign debt problems
Eastern Europe
Countries like Poland, Russia and Turkey are expected to have significant steel demand in the coming years (4-7% p.a.)
Africa
South Africa is ArcelorMittal's main market in Africa with steel demand expected to increase slightly
China
China accounted for 1.4% of sales in 2011, ArcelorMittal is not expected to significantly increase its sales in the world's biggest steel market due to fierce competition and overcapacities in the market
India
India remains a big question mark due to complicated land ownership laws and illegal steel sales, therefore we expect slight increases in sales
Other Asia/Oceania
Other countries in Asia especially in South Eastern Asia are expected to show healthy steel demand growth rates, these countries often do not have domestic steel giants like South Korea and Japan and represent good growth opportunities for ArcelorMittal
Base Scenario
ARCELORMITTAL COMPANY REPORT
PAGE 4/31 Sales Projection
By computing growth rates for every single market in which ArcelorMittal operates, we could then allocate these future sales projections to each of the company’s six segments. FCA, FCE, LC and AACIS are segments which are organized according to product groups (flat/long) and locations (Americas/Europe/AACIS). Sales forecasts for these segments were predicted based on growth assumptions for the respective target markets and the respective product groups. The segment Distribution Solutions manages distribution offices in Europe, North Africa and Middle East. Therefore sales projections for Distribution Solutions were computed via the projections for these regions.
Profit margins for each segment were computed via historical margins for each scenario. Consolidating all segments into a group P&L, we made assumptions for deductions of intra-group sales. The group P&L was finalized by projecting depreciation and finance costs by using relevant ratios linked to balance sheet positions.
Free Cash Flow Projection
ArcelorMittal generates free cash flows in the steel and the mining business. In order to adjust for the risks in the two sectors we split the company-wide free cash flows by using the EBITDA shares of both businesses. The free cash flows of the two businesses were discounted by using a Weighted Average Cost of Capital (WACC) for the two of them. The lower WACC for the steel part can be explained by the lower relevered beta for the companies in the steel business. Terminal Value
We assessed the Terminal Value with the following formula:
FCF
2016 *(1+g)
WACC - g
First, the overall growth rate for ArcelorMittal was computed by taking into account the company’s growth rate in recent years and the growth rate of the steel sector compared to overall GDP growth in the last decade. The final growth rate of 1,4% for the overall company was rebalanced, giving the mining sector a stronger weight due to the allocation of capital expenditures in favour of mining projects in last years.
Sales projections for 6 business segments
WACC of 7.41% for steel segment and 8.27% for mining segment
Growth rate
Steel segment
1,05%
ARCELORMITTAL COMPANY REPORT
PAGE 5/31 Implied Share Price
In the last step the projected cash flows needed to be discounted by the discount periods and the WACC rates and added up with the projected terminal value. From the resulting enterprise value we needed to deduct the net debt forecast for 2013 and the forecasted non-controlling interests. We then came up with the implied equity value for the group. Dividing the implied equity value by the fully diluted shares outstanding provided us with the implied share price in USD for each of the three scenarios. In the final step we converted this value via a forecasted exchange rate into Euros.
Sensitivity Analysis
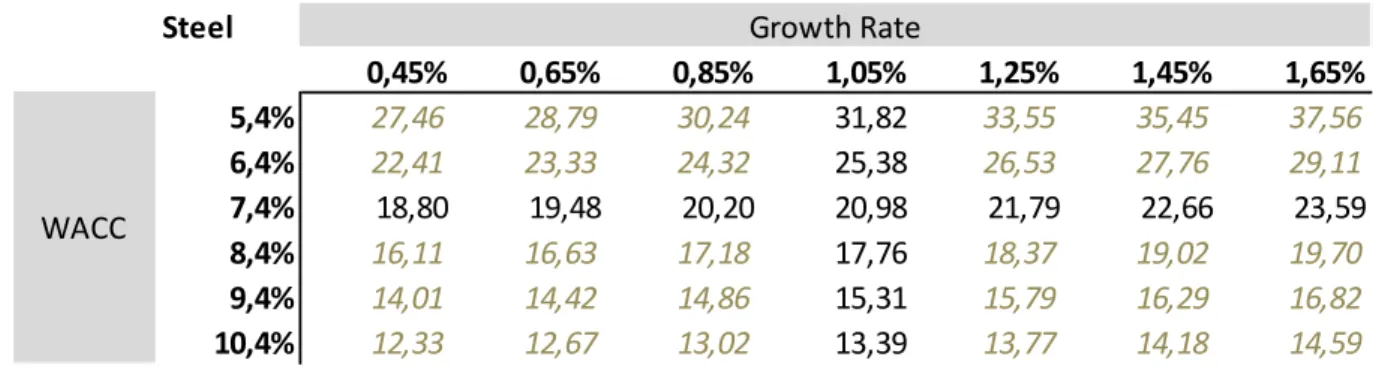
A sensitivity analysis describes, to which degree the implied share price would change in case one of its sources changes. We applied a sensitivity analysis with the WACC and the terminal growth rates for both sectors being the uncertain input numbers. Table 2 and 3 show, that the overall share price is more sensitive to changes in the WACC or the growth rate of the company’s steel operations due to ArcelorMittal’s steel operations having a bigger proportion of projected free cash flows. The two tables are shown in USD for the base scenario.
Table 2 – Sensitivity Analysis Steel Operations
Table 3 – Sensitivity Analysis Mining Operations
Steel
0,45%
0,65%
0,85%
1,05%
1,25%
1,45%
1,65%
5,4%
27,46
28,79
30,24
31,82
33,55
35,45
37,56
6,4%
22,41
23,33
24,32
25,38
26,53
27,76
29,11
7,4%
18,80
19,48
20,20
20,98
21,79
22,66
23,59
8,4%
16,11
16,63
17,18
17,76
18,37
19,02
19,70
9,4%
14,01
14,42
14,86
15,31
15,79
16,29
16,82
10,4%
12,33
12,67
13,02
13,39
13,77
14,18
14,59
Growth Rate
WACC
Mining
1,70%
1,90%
2,10%
2,30%
2,50%
2,70%
2,90%
7,27%
21,55
21,90
22,28
22,70
23,15
23,63
24,17
7,77%
20,80
21,10
21,42
21,77
22,14
22,54
22,97
8,27%
20,17
20,42
20,70
20,98
21,30
21,63
21,99
8,77%
19,62
19,85
20,08
20,33
20,60
20,88
21,18
9,27%
19,15
19,35
19,55
19,77
20,00
20,24
20,50
9,77%
18,74
18,91
19,09
19,28
19,48
19,69
19,92
Growth Rate
WACC
ARCELORMITTAL COMPANY REPORT
PAGE 6/31
Graph 1 – Employees per region in 2011
Company overview
ArcelorMittal represents the world’s largest steel producer, serving all major steel consuming industries like automotive, construction, appliances, transportation and packaging. The company employs 260,000 people with operations spanning across the globe and is also a leader in R&D and in providing distribution solutions. Its core philosophy is safety in producing steel with the ultimate target being to have zero incidents in a year.
ArcelorMittal is listed on the stock exchanges in New York, Amsterdam, Paris, Luxembourg, Madrid, Barcelona, Bilbao and Valencia. Its headquarters are based in Luxembourg.
Lakshmi N Mittal is the chairman and CEO of ArcelorMittal. He founded Mittal Steel and guided its merger with Arcelor in 2006. The board of directors consists of ten directors, of which Mr Lakshmi N Mittal is the only executive director.
History
The history of ArcelorMittal dates back to 1976. At that time Mr Lakshmi N Mittal founded the company “LNM Group” at the age of 26 years. He realized very early that to become a major player in the steel sector, he had to go international and set up his first steel mill abroad in Indonesia. Soon he started acquiring other steel makers and one of his early major acquisitions was the purchase of Karmet Steel in Kazakhstan, which considerably raised his production capacity. Mittal Steel was finally set up in 2004 when Ispat International acquired LNM Group. At the time both companies were controlled by Lakshmi Mittal and its successor Mittal Steel was based in Rotterdam and was managed from London. Mittal’s company grew significantly in the 1990’s through a combination of rapid organic growth and a number of significant acquisitions.
Arcelor was created in 2002 through a merger of the three European steel producers Arbed (Luxembourg), Aceralia (Spain) and Usinor (France). In 2006, the year of the merger of Arcelor and Mittal Steel, the two companies were the biggest steel producers in the world. The merger was strongly opposed by stakeholders of both parts, in June 2006 however the deal went through with Mittal Steel paying a substantial premium to Arcelor stockholders. The latest offer, which was eventually accepted, represented an 82% premium over the last closing price of Arcelor. Following the deal, ArcelorMittal achieved to substantially increase its net income from $3.36bn to $6.1bn in 2006. Since then, the newly created company has followed its acquisition strategy and continues to being the biggest steel producer worldwide.
0 20 40 60 80 100 120 2004 2005 2006 2007 Mittal Arcelor Sum ArcelorMittal
Mittal Steel paid 82% premium over last closing price
Source: Annual report 2011
ARCELORMITTAL COMPANY REPORT
PAGE 7/31
Acquisitions/Divestments
Table 4 presents ArcelorMittal acquisition and divestment activities in recent years. Apart from the big merger of Mittal Steel and Arcelor there are other notable transactions in recent years. In 2005 Mittal Steel acquired Kryvorizhstal, the largest steel producer in the Ukraine, which produced 7mn tonnes of crude steel and 17mn tonnes of iron ore in 2004. In 2007 newly created ArcelorMittal continued to expand with the acquisition of the leading long products maker Sicartsa from Mexico. Both these acquisitions were welcomed by stock owners with slight increases following the acquisitions. However due to overcapacities in the sector, ArcelorMittal concentrated on expanding its iron ore and coke facilities in the following years. Due to tight economic conditions in recent years ArcelorMittal had to improve its liquidity. As a result the company got rid of equity holdings in Turkey and Luxembourg.
Company Structure
ArcelorMittal is divided into six operating segments. The segments are Flat Carbon Americas, Flat Carbon Europe, Long Carbon Americas and Europe, AACIS (Asia, Africa Commonwealth of Independent States), Mining and Distribution Solutions. This structure was established in 2011 after the spin-off of its stainless steel operations and the rising significance of the mining operations. The operating segments are supported by shared services which include amongst others purchasing, energy, shipping, IT, legal and real estate.
Flat Carbon Americas (FCA) produces flat products like hot-rolled coil,
cold-rolled coil, slabs, coated sheet products and plate. The segment primarily serves customers in automotive, construction, distribution and processing, packaging, appliances and pipes and tubes. Production is divided among eight integrated and mini-mill sites, which are located in Canada, Brazil, Mexico and the US. The Flat Carbon Americas business has proven to be a strong business for ArcelorMittal, mainly due to mature markets like the US and Canada and steel demanding emerging markets like Brazil and Mexico. The unit reported sales of $21bn in 2011 and crude steel production of 24.2mn tonnes.
Flat Carbon Europe (FCE) produces mainly the same products like FCA. Its
main customers include automotive, general industry and packaging industries. FCE operates 15 production facilities. These facilities are located in 8 European countries. In the wake of the European sovereign debt crisis the business
Table 4 – Acquisitions & divestments in recent years
Graph 3 – Company structure since 2011
2004 LNM Holdings & ISPAT merge to Mittal Steel
2005 Takeover of International Steel Group, USA (by Mittal Steel) 2005 Acquisition of Kryvorizhstal, Ukraine (by Mittal Steel)
2005 Iron ore mining agreement with Liberian government
2006 Creation of ArcelorMittal
2007 Acquisition of Sicartsa, Mexico
2008 Increase of stake in Macarthur Coal, Australia
2008 Purchase of coal mining assets in Russia
2009 Divestment of Wabush Mines, Canada
2010 Spin-off of stainless steel business
2011 Acquisition of Baffinland Iron Ore Mines, Canada
2012 Divestments of Erdemir, Turkey and Paul Wurth, Luxembourg
2013 Sale of 15% of ArcelorMittal Mines Canada
Major acquisitions/divestments
ARCELORMITTAL COMPANY REPORT
PAGE 8/31 40,83%
56,67%
2,50%
Mittal family trusts Public shareholders Luxembourg Government
segment has struggled with declining steel demand. Furthermore FCA accumulated extraordinary expenditures in the last years, which were necessary to modernize plants and shut down production facilities due to sluggish demand.
Long Carbon Americas and Europe (LC) is responsible for the production of
long products. These include sections, wire rod, rebars, billets, blooms, wire drawing, pipes and tubes, sheet piles, rails, ingots, specialty bars and slopes. The customers of long products are typically construction, industrial, automotive, appliances, transportation and engineering industries. The division produces its goods at 17 production plants in nine countries in the Americas and Europe. The business segment Asia, Africa and Commonwealth of Independent
States (AACIS) operates in Kazakhstan, Ukraine and South Africa. The segment
produces flat products as well as long products and serves all kinds of steel consuming industries, especially in emerging markets. Revenues amounted to $10.8bn in 2011 with EBITDA of $1.2bn.
Distribution Solutions is the in-house trading and distribution arm of the
company. It operates a wide network of regional offices, which support customers in product development and optimize the supply chain. Most of the offices are located in Europe.
ArcelorMittal’s mining business supports the companies steel production facilities with high-quality and low-cost iron ore and coal resources. Since 2011 the companies’ mining operations have been classified as an own segment, which underlines its increasing focus by the company.
Shareholder structure
On October 31st 2012 the number of issued shares amounted to 1.56mn shares of which 0.637mn (40.83%) were held by two funds of which Mr Lakshmi N Mittal and his family are the beneficiaries. 58.41% of shares are owned by other public shareholders. According to ArcelorMittal’s articles of association, every shareholder owning more than 2.5% of shares must notify ArcelorMittal. Currently the only registered shareholder owning more than 2.5% but less than 5% is the Luxembourg State representing 2.5% of shares.
In light of the present credit downgrades by rating agencies it would seem reasonable to raise capital by issuing new shares. However given the high concentration of control of shares by Mr Lakshmi N Mittal and the value of his shareholding position, it seems very unlikely for the company to realize this strategy. The last time ArcelorMittal issued equity was in 2009 when aggressive capital expenditures and lack of steel demand due to the crisis urged the company to raise capital at depressed prices.
Graph 5 – Shareholder Structure
2008 – Total EBITDA $23.4bn
2011 – Total EBITDA $10.1bn
Graph 4 – EBITDA distribution in 2008 & 2011
ARCELORMITTAL COMPANY REPORT
PAGE 9/31
Steel Industry
The steel industry is a highly competitive sector. ArcelorMittal as the biggest steel producer worldwide accounted for a market share of around 6.5% of world crude steel production in 2011. The 10 biggest steel producers accounted for a share of 28%, which indicates the high fragmentation of the industry.
Production Processes
Steel is created through an alloy made by combining iron ore with other elements, most commonly carbon. The weight of the alloying elements determines the products’ hardness, ductility and tensible strength. There are three main steel production processes currently used worldwide, of which the open hearth process is the one least used. This process is very slow compared to other processes and has therefore been replaced by other processes since the early 1990’s. The production in open hearth furnaces accounted for 1.2% of total steel production in 2010 and is still used in little percentages in CIS countries and in India. The two main production processes are applied in electric arc furnaces and in blast oxygen furnaces. Electric arc furnaces are especially used for producing specialty carbon steel and alloys from steel scrap whereas blast oxygen furnaces can be used for producing large amounts of standard carbon steel. Blast oxygen furnaces produce steel from liquid pig iron. The advantage of electric arc furnaces is its flexibility in rapidly stopping and restarting operations. Oxygen furnaces cannot vary their production and are often run continuously for several years. Small countries with low steel consumption often solely rely on electrical arc furnaces, because these countries do not have the necessary scope for economically running an oxygen blast furnace. In 2010 electric arc furnaces accounted for 29% of total crude steel production and blast oxygen furnaces for 69.8% of production. However during the height of the financial crisis electric arc furnaces were only used for 28.5% of production due to their flexibility in halting operations.
There are small differences in production costs for one metric tonne of crude steel between the two production processes, however these costs tend to equal out in the long term. The main raw materials in both cases represent the highest input costs in steel production. In the examples shown in Table 5 and 6 the main raw materials account for 72.2% of total costs in Electric Arc Furnace production and 78.4% in Blast Oxygen Furnace production (including transportation costs). Labour costs, capital charges and parts of electricity costs are the only fixed costs in steel production, making steel production costs very dependent on input material costs. 97,2 44,4 43,3 39,1 37,7 33,4 31,9 30 29,9 29,8 0 20 40 60 80 100 ArcelorMittal Hebei Baosteel POSCO Wuhan Nippon Steel Shagang Shougang JFE Ansteel Tonnage (Mn Tonnes)
Graph 6 – Top 10 steel producers in 2011 Steel scrap $331,0 71,0% Scrap delivery $5,4 1,2% Oxygen $1,7 0,4% Ferroalloys $13,8 2,9% Fluxes $1,6 0,3% Electrodes $21,6 4,6% Refractories $4,6 1,0% Other costs $8,6 1,8% Thermal energy $6,2 1,3% Electricity $29,4 6,3% Labour $24,8 5,3% Capital charges $17,7 3,8% Total $466,3 100,0% Iron ore $192,7 39,4% Iron ore transport $14,1 2,9% Coking coal $164,9 33,7% Coking coal transport $11,9 2,4%
Steel scrap $43,0 8,8% Scrap delivery $0,7 0,1% Oxygen $22,5 4,6% Ferroalloys $17,5 3,6% Fluxes $29,0 5,9% Refractories $5,9 1,2% Other costs $18,0 3,7% By-product credits -$34,1 -7,0%
Thermal energy, net -$108,5 -22,2%
Electricity $12,8 2,6%
Labour $28,9 5,9%
Capital charges $69,9 14,3%
Total $489,1 100,0%
Source: Worldsteel Association
Table 5 – Electric Arc Furnace cost model
Source: steelonthenet.com Table 6 – Blast Oxygen Furnace cost model
ARCELORMITTAL COMPANY REPORT
PAGE 10/31 Labour costs represent a small portion of costs per unit produced. However since material input prices do not vary much on the worldwide market, labour costs can be an important factor in cost competitiveness for a region or a company. Hourly compensation costs in manufacturing show huge differences between major steel producing countries. Labour costs in emerging economies like Brazil, India and
China have rapidly increased in the last years. Labour costs in developed countries will increase much more slowly than the ones in emerging countries, but since they are increasing from a much higher level, the gap in labour costs is likely to remain for many more decades. High hourly labour costs does however not necessarily mean that steel companies in developed markets are less cost competitive than its counterparts in developing markets. Steel mills in developing countries often lack high labour productivity, because there is little incentive to increase productivity, since labour is cheaply accessible. Therefore steel producers in developed markets do somewhat offset their compensation cost disadvantage by attaining an ever increasing labour productivity.
Apart from labour costs, energy and transportation costs are important in defining the cost competitiveness of steel producers. Energy costs for steel producers are mainly composed of costs for electricity and natural gas. Russia and South Africa are among the countries with the lowest electricity and natural gas costs due to high own gas reserves and in the case of South Africa, also rising extraction in neighbouring countries Namibia and Mozambique. Japan, Turkey, China and the EU region are on the upper end of energy costs. Large differences in natural gas costs between the regions can be explained by high transportation costs which are limited to pipelines, thus requiring heavy investments.
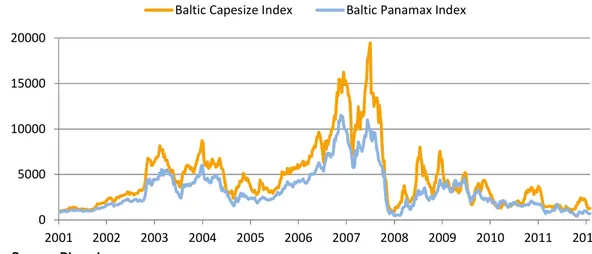
Transportation costs are another important cost factor especially for Western European, North American, Japanese and Chinese steel producers, which heavily rely on iron ore imports from overseas. Trademarks in the trading and settlement of maritime contracts are the indices listed on the Baltic Exchange, which is a futures exchange based in London. The exchange offers daily prices on freight and shipping costs. The Baltic Exchange Dry Index (BDI) is the most relevant index for shipping iron ore on international seas. The BDI operates
Graph 7 – Hourly Compensation Costs in Manufacturing in USD in 2007
0 10 20 30 40 50 93,3 74,3 69,7 63,9 57,7 12,4 8,3 0 20 40 60 80 100 US Australia EU15 Japan South Korea China India
Electricity Natural Gas
USD/kwH USD/1000m^3 China 0,10 321 EU 0,11 308 Japan 0,12 321 India 0,10 141 Russia 0,05 78 USA 0,07 139 Korea 0,06 321 Ukraine 0,08 222 Brazil 0,16 321 Turkey 0,12 386 South Africa 0,05 90
Source: APO Productivity Databook 2012 Graph 8 – Labour productivity per worker in 2010 in thousand USD
Source: OECD Steel Committee
Source: U.S. Department of Labor
Table 7 – Electricity & Natural Gas costs
ARCELORMITTAL COMPANY REPORT
PAGE 11/31 different ship classifications, of which the Baltic Capesize Index and the Baltic Panamax Index are the ones with the highest percentage of dry bulk traffic.
The index basically indicates demand and supply of dry bulk carriers. The BDI showed a high volatility in the last 6-8 years, reaching its all-time high in the middle of 2008. The volatility in the index was due to rocketing demand for commodities and manufactured products, especially in China. Ship producers however require several years to considerably expand their ship fleet and therefore demand for dry bulk carriers surmounted supply in 2008 until ship producers could catch up and demand decreased due to the financial crisis. The BDI index is also influenced by the crude oil price, because fuel represents a major part of voyage dependent costs and therefore the BDI closely moves with the crude oil price. Since the BDI indicates costs for shipping bulk dry material like iron ore, it is of special importance for iron-ore dependent countries like China. In 2011 90% of China’s crude steel was produced by the Blast Oxygen Furnace method, for which iron ore is the main cost component.
Steel scrap, necessary for steel production by the Electric Arc Furnace method, is mainly produced in North America and the European Union, because these are the most developed regions of the world with major steel consumption in the last decades for automotive, construction and transportation. These regions are at the same time the biggest steel scrap exporters (Table 8). The biggest importers of these steel scrap shipments were Turkey, China and South Korea. Graph 10 illustrates the importance of steel scrap for total crude steel production of major steel producing countries. As mentioned above the European Union and the US dispose of large amounts of scrap and therefore these regions make use of electric arc furnaces in large amounts. Turkey produces almost 100% of its steel with steel scrap. Since the country’s economic liberalization in the 1980s, Turkey heavily invested in electric arc furnaces and steadily raised its imports of steel scrap over the years to become the largest importer by far.
0 5000 10000 15000 20000 2001 2002 2003 2004 2005 2006 2007 2008 2009 2010 2011 2012
Baltic Capesize Index Baltic Panamax Index
2010
2011
USA
20.556
24.373
EU-27
19.033
18.770
Japan
6.472
5.442
Canada
5.154
4.832
Russia
2.390
4.042
Australia
1.636
1.745
South Africa
1.224
1.436
2010
2011
Turkey
19.192
21.460
South Korea
8.091
8.628
China
5.848
6.767
Taiwan
5.364
5.328
India
4.643
2.929*
USA
3.775
4.003
EU-27
3.646
3.676
* Period Jan-July 2011Graph 9 – Baltic Capesize Index & Baltic Panamax Index
Source: Bloomberg
Table 8 – Major steel scrap exporting countries
Source: Bureau of International Recycling Table 9 – Major steel scrap importing countries
ARCELORMITTAL COMPANY REPORT
PAGE 12/31 The worldwide production via the Electric Arc Furnace has slightly increased in the last years, because it offers higher flexibility in producing steel. Another main reason for the increasing production with Electric Arc Furnaces can be contributed to the differences in capital outlay between the two methods. A typical blast oxygen furnace steel mill costs around $1.100 per tonne of installed capacity, whereas costs for a medium-sized electric arc furnace mini-mill are expected to be at around $300 per tonne of installed capacity. As a result, steel makers will increasingly try to get more exposure to EAF mini-mill production, because it offers higher flexibility in production in times of overcapacity and it requires less capital investment. The main issue towards increasing use of electric arc furnaces however remains the limited supply of scrap steel and therefore the blast oxygen production process remains the widest used process worldwide.
The steel sector directly employs around two million people worldwide. However given its importance to steel consuming industries like automotive and construction, the sector directly affects the employment of more than 50 million people worldwide. Given these employment figures and the importance of steel for infrastructure and transportation, it does not come surprisingly that governments try to protect their domestic steel industries.
Protectionism
One example of these protective measures is the 2002 United States steel tariff introduced by President George W. Bush. The tariffs of 8-30% were imposed on steel imports with some exceptions like imports from NAFTA countries. However the tariff was withdrawn earlier than scheduled due to international pressure and a ruling by the WTO.
0 100 200 300 400 500 600 700
China EU-27 Japan USA Russia Turkey
Crude steel production Steel scrap use
Graph 10 – Steel scrap use for steelmaking in 2011
Source: Bureau of International Recycling
0 100 200 300 400 500 600 700 2003 2005 2007 2009 2011 Source - Bloomberg
Graph 11 – Steel Scrap Shredded US FOB East Coast ($ per tonne)
ARCELORMITTAL COMPANY REPORT
PAGE 13/31 The European Union approved in 2009 penalties on imports of steel pipe from China due to alleged dumping prices in order to gain market share in Europe. Protectionism is however not exclusively an instrument of developed countries. China for example, which has large ownership positions in several steel producers, had imposed import duties on special kinds of US steel products with the argument, that the US government was subsidising these products. A WTO decision concluded these tariffs to be illegal, since China couldn’t prove the existence of the alleged subsidies.
Given the amount of machinery, plants and commodities a steel company needs in order to operate successfully, one can see that the steel sector is a very capital intense industry. Additionally steel mill operations are always associated with high legacy costs like pensions and retiree health care tabs. It is essential for steel producers to gain a critical size of operations so that plants can be used to their fullest capacity and fix costs related to administrative and supply chain functions can be split. Why is it then that the global steel industry happens to be highly fragmented?
High fragmentation of industry
This question can partly be answered by looking at the significance of steel to an economy’s development. Steel has historically been the backbone of an economy with its usage in construction, automotive and transportation production and therefore proves to be a main instrument of government measures like described above. This is especially the case in China. During the boom years steel provided a very attractive business opportunity and steelmaking was supported by local government with favourable employment and tax revenues. This environment sparked the creation of many local steel producers. Nowadays local governments are often opposed to high acquisition activity. The largest Chinese producer accounts for roughly 10% of the market.
Other ways governments are regulating the industry is via resource nationalism. Examples include royalties or mining taxes, export levies on iron ore or ownership caps on iron ore mines for foreign companies. Another part of the equation is explained by the current lack of capital for major acquisitions and refusing takeover positions by shareholders. Mergers & Acquisitions have historically been one of the main drivers of growth in the sector. M&A activity prevents the creation of additional expensive steel capacity and the steel industry is an industry which has historically shown low annual growth rates and therefore expansion can best be achieved by capturing market shares of competitive companies. 85% 81% 76% 65% 0% 50% 100% Baosteel Shougang Wuhan Anben Graph 12 – Estimated government ownership of Chinese steel companies
Source: Wiley Rein & Fielding LLP
Steel is the backbone of an economy
Industry regulation via resource nationalism
ARCELORMITTAL COMPANY REPORT
PAGE 14/31 Between 2000 and 2008, annual growth in global steel production averaged 7.1% annually, which was mainly achieved by rapid growth in emerging markets. The movement of steel production growth away from developed markets to emerging markets can be seen by the global production shares of the US and China for the years 2000 and 2011. In 2000 the US had a market share of 12% and China a share of roughly 15%. However this picture has significantly changed in the following years with the US share being more than halved to around 5.7% in 2011 and China tripling its share to around 45% of global steel production.
Customers
Major steel consuming industries are automotive, construction, transportation, appliances, machinery, shipbuilding and packaging. According to an OECD study, construction accounts for about 50% of global consumption followed by transportation (cars, trucks, shipbuilding, aviation, rail) with 16%, machinery with 14% and metal products with 14%.1 During the downturn of the global economy automotive production plummeted and construction projects were put on hold, which had major implications on steel makers’ operations. Other steel consuming industries like aviation and rail are also heavily linked to the performance of an economy. Therefore the steel industry is a captive of the overall business cycle however lagging behind due to the time a steel plant needs to rerun operations, heavy investment needs and a rather long gestation period for setting up new plants.
Substitute Products
Steel as a product sees itself exposed to competition from substitute products like aluminium, plastics, ceramics, glass, wood or concrete. Especially stainless steel products have recently been threatened by substitutes due to strong price increases for nickel, which is an input material of stainless steel. However the mentioned substitute products have also seen price increases. For the steel industry the challenge therefore remains to continuously increase product quality and communicate superior attributes of steel compared to other industrials, like for example high sustainability of steel. ArcelorMittal is certainly committed to improving its product quality, which can be seen by its focus on R&D with 1,300 researchers in 11 R&D centres.
1 OECD – Perspectives on steel by steel-using industries, Paris, May 6-7th 2010 -10,0% -5,0% 0,0% 5,0% 10,0% 15,0% 20,0% 2001 2003 2005 2007 2009
Steel Production Growth Rate Global industrial value added
Source – Worldbank / Worldsteel Association 50% 16% 14% 14% 3%3% Construction Transport Machinery Metal Products Appliances Electrical equipment
Graph 13 – Steel Production Growth vs. Industrial Production Growth
Graph 14 – Steel Consumption by industry in 2010
ARCELORMITTAL COMPANY REPORT
PAGE 15/31
Operations Analysis
ArcelorMittal serves customers with all kinds of flat and long products in all important steel consuming markets. It produces steel on five continents and has a high exposure to developing markets. Thanks to its diversified innovative product portfolio, the company is an important partner to the global automotive market with a market share of around 20% in the automotive sector and presence in many design centres of automotive manufacturers. The company is running its operations primarily with blast oxygen furnaces representing around 72% of production with the remainder being produced with electric arc furnaces (25%) and open hearth furnaces (3%).
Flat Carbon Americas (FCA)
The Flat Carbon Americas business is well positioned with production plants in Brazil, Canada, Mexico and the US. Some of its fully integrated US plants are located strategically at the Lake Erie which provides good access to car manufacturers in Detroit. Other plants are located in Pennsylvania, Ohio and West Virginia which serve a diversified customer base with good access to transportation. In Brazil the company operates one integrated and one finishing steel plant and serves primarily the Brazilian automotive industry but also other South American markets. Operating plants are located close to coastal regions – its flat carbon operating plant in Tubarao is optimally located close to one of the main shipping ports of Vale, the biggest iron ore producer in the world. The subsidiary ArcelorMittal Lázaro Cárdenas is the biggest steel producer in Mexico. It serves primarily customers which demand higher quality and advanced steel products.
Overall the segment FCA serves all kinds of steel consuming markets, however strategically located to its most important customers in the automotive industry.
Graph 16 – FCA Production and Shipments (in millions of metric tonnes)
0%
10%
20%
30%
40%
50%
60%
70%
80%
90%
100%
Others
Argentina
China
Russia
Belgium
Czech Rep.
UK
Mexico
Turkey
Italy
Canada
South Africa
Poland
Spain
France
Brazil
Germany
USA
Graph 15 – Group sales per country in 2011 0% 5% 10% 15% 20% 25% 0 5 10 15 20 25 30 2008 2009 2010 2011 2012E Production Shipments EBITDA % Source: ArcelorMittal
ARCELORMITTAL COMPANY REPORT
PAGE 16/31 The supply chain between upstream, downstream and integrated steel plants is well established with good access to railways and ports. In 2011 shipments amounted to 22 million tonnes. The segment is set to deliver consistent results in the future. North American car producers are recovering from the global financial crisis and developing markets in Central and South America provide robust growth forecasts especially Mexico and Brazil with an increasing middle class and big sports events coming up in Brazil in the next four years.
Flat Carbon Europe (FCE)
The segment Flat Carbon Europe manages operations in Germany, Belgium, France, Romania, Spain, Poland, Italy, Luxembourg, Czech Republic, Macedonia and Estonia. 3Q2012 sales have decreased 12% year-on-year in the segment and EBITDA slumped by 19% in the same period. This development can mainly be attributed to the unsolved sovereign debt crisis in Europe. Many construction projects are on hold and consumption of steel-containing products is low. The company had to attach significant amounts of capital expenditure to the segment in the last years. Capex amounted to $792mn in 2010 and increased to $1bn last year. These expenditures were mainly allocated to health and safety measures, maintenance and renewals, and religning and revamping of blast furnaces in France and Romania. The segment recently came under scrutiny by the French government, which blamed ArcelorMittal for not complying with its promises regarding the operations of its Florange site, parts of which ArcelorMittal is planning to idle permanently. Demand for flat products is set to remain flat throughout Europe in 2013. Many of the sites are not running close to full capacity and it remains questionable if further temporary closures are to follow as part of the Asset Optimization Program in order to decrease costs and return to positive profit margins.
Graph 17 – FCE Production and Shipments (in millions of metric tonnes)
0% 2% 4% 6% 8% 10% 12% 14% 16% 18% 0 5 10 15 20 25 30 35 40 2008 2009 2010 2011 2012E Production Shipments EBITDA %
Demand set to remain flat in Europe in 2013 Capex of $1bn for FCE in 2011
Main projects:
Relining and revamping of blast furnaces in France and Romania
ARCELORMITTAL COMPANY REPORT
PAGE 17/31
Long Carbon Americas & Europe
The company’s long carbon operations in Americas and Europe are concentrated in one operational segment with 35 mills in 17 countries. Long Carbon Americas & Europe (LC) was also affected by the downturn of the European economy which can be seen by a decrease in sales of 13% year-on-year after three quarters in 2012. Many of the long carbon production sites are also part of either the FCA or FCE segment, which has positive effects on supply chain. However the high dependence on the European and American construction sectors limits the segment’s growth prospects with the South American and Eastern European construction sectors being among the major opportunities.
Contrary to overall steel production and steel demand, the steel demand in the global construction sector is rather balanced. In 2009 the US as the largest contributor to global construction output amounted to just 17% of overall output followed by China with 14%. In order to decrease its dependency on developed construction markets, the segment could focus on less developed and smaller economies with growing construction projects in the future as indicated by the high percentage of other countries in Graph 19.
AACIS
The segment Asia, Africa, CIS manages steel producing facilities in Kazakhstan, South Africa and Ukraine. Production includes flat and long carbon products. In 3Q2012 sales decreased by 2% year-on-year and sales shipments increased by 4%. ArcelorMittal has been investing in safety and productivity programs in the regions. These production plants primarily serve emerging markets and are therefore of high importance to the company in accessing new markets.
Graph 18 – LC Production and Shipments (in thousands of metric tonnes)
Graph 19 – Global Construction Output in 2009 (Total $7.5trillion) Source: OECD 0% 5% 10% 15% 20% 25% 0 5000 10000 15000 20000 25000 30000 2008 2009 2010 2011 2012E Production Shipments EBITDA % LC operates in 17 countries
ARCELORMITTAL COMPANY REPORT
PAGE 18/31 ArcelorMittal South Africa is comprised of four major facilities. Its two flat carbon operations are located in Vanderbijlpark close to Johannesburg and Saldanha at the Southwest coast close to Cape Town. These two steel facilities are able to produce up to 5.6mn tonnes of steel per year and could cover almost 80% of South Africa’s flat steel needs. Its two long carbon facilities are located in Newcastle and Vereeniging and cover about 50% of the local need of long steel products. The proximity to major cities and ports provide the steel plants with good access to transportation and supply channels. The South African steel operations were acquired by LNM Holdings in 2003 and continued being part of Mittal Steel and later on ArcelorMittal.
The Ukrainian operations in Kryviy Rih were added to the steel conglomerate in 2005. The plant is specialized in producing reinforcing bars and wire rods but is also producing several other steel products, pig iron and sinter. It is connected by railway to Europe and other CIS countries and is close to Black Sea ports. Furthermore the plant disposes of captive iron ore supplies and is situated close to power resources like coal and gas.
ArcelorMittal Temirtau is the largest steel producer in Kazakhstan. The plant operates blast oxygen furnaces with a capacity of 5.5mn tonnes per annum and has its own captive coal, iron ore and power facilities. About 96% of production is exported to around 65 countries.
Distribution Solutions
The Distribution Solutions segment of ArcelorMittal has operation offices organized in the following regions: Benelux, Central and Eastern Europe, France, Germany/Switzerland, Iberia, Italy, the Maghreb, Turkey, Poland, South Eastern Europe, UK/Scandinavia and South America. The segment manages an extensive network of agencies and sales offices and provides value-added
Graph 20 – AACIS Production and Shipments (in thousands of metric tonnes)
0% 5% 10% 15% 20% 25% 30% 35% 0 2000 4000 6000 8000 10000 12000 14000 16000 2008 2009 2010 2011 2012E Production Shipments EBITDA %
AACIS plants dispose of captive iron ore facilities
ARCELORMITTAL COMPANY REPORT
PAGE 19/31 services for flat and long carbon steel and ensures immediate availability of the entire range of its products. Below are listed some sub-segments of DS:
ArcelorMittal Construction Solutions serves customers with cladding, roofing,
flooring and structure activities in 26 countries. ArcelorMittal International provides products from steel mills outside of their home markets. ArcelorMittal
Projects helps its customers by assisting with its experience in managing
projects and strategically located stock yards. ArcelorMittal Total Offer
Processing has a strong presence in emerging markets with services ranging
from design to production, logistics of steel components and steel solutions. ArcelorMittal Wire Solutions provides high quality wire products serving industries like agriculture, automotive, construction and energy.
Competitive Advantage
Even though ArcelorMittal is continuously decreasing its dependency on iron ore prices and iron ore suppliers by expanding its iron ore operations, the company still has to acquire large amounts of iron ore on international markets. Its company size therefore provides the company with bargaining power in negotiating new supply deals, which not many steel makers in the world dispose of. The company’s raw material self-sufficiency with 46% iron-ore self-sufficiency is another competitive advantage. Most steel producers simply do not have sufficient scope to build a profitable mining business. ArcelorMittal is able to improve its supply-chain and its cost structure and gains access to mining infrastructure.
Graph 21 – Distribution Solutions Shipments (in thousands of metric tonnes)
-1,0% 0,0% 1,0% 2,0% 3,0% 4,0% 5,0% 6,0% 15500 16000 16500 17000 17500 18000 18500 19000 19500 2008 2009 2010 2011 2012E Steel shipments EBITDA % Distribution Solutions provides value-added services
ARCELORMITTAL COMPANY REPORT
PAGE 20/31 Graph 22 indicates ArcelorMittal’s cost position for hot-rolled coil in 2009. Costs for the production of HRC are below average in every region in which the company produces HRC and in the global picture ArcelorMittal is also highly competitive. A further reason for the company’s competitive cost position is its diversified production with three different production processes in place. The company is thus able to shift production to low-cost sides and to sides which are specialized in producing special kinds of steel products.
Its wide product portfolio and the outstanding focus on R&D make ArcelorMittal furthermore a valued partner for the automotive sector, which demands innovative steel solutions for safety and fuel consumption optimization. With 11 R&D centres worldwide and its global R&D centre in Chicago, the company is well positioned to improve its position with innovation-seeking customers.
Mining Industry
Iron ore consists of rocks and minerals and is one of the most abundant materials worldwide. It is typically a high volume, low margin business and a very capital intensive sector like the steel producing industry. Steelmaking is the main usage for iron ore, consuming 98% of worldwide extracted iron ore. The sector has experienced rapid growth and high volatility in the last years which can mainly be attributed to high annual growth rates in China and rocketing steel demand.
Industry Consolidation
The iron ore mining industry is contrary to the steel industry a highly concentrated industry with the biggest three producers BHP Billiton, Rio Tinto and Vale accounting for 54% of total iron ore extraction in 2011. BHP Billiton and Rio Tinto
Source: Protecting and developing our competitive advantage – Investor Day 2010
0 10 20 30 40 50
AACIS FCA FCE LC
BF EAF
Graph 22 – Global and regional average HRC cost in 2009
Graph 23 – Number of used Blast Furnaces and Electric Arc Furnaces
ARCELORMITTAL COMPANY REPORT
PAGE 21/31 are both Anglo-Australian companies with listings in London and Sydney and Vale is based in Rio de Janeiro, Brazil. The rise of these three companies as biggest iron ore producers can partly be explained by Australia and Brazil being among the iron ore richest countries in the world. The two countries accounted for 70% of global export in 2011. However when looking at total production, China takes the leading position like in steel producing with an estimated iron ore production of 1,200 million metric tonnes extracted in 2011. This is however far from enough to cover its domestic demand for iron ore – China is furthermore the biggest iron ore importing country with around 60% of all imports due to low quality of Chinese iron, which contains only 20% iron on average, whereas iron ore imports from Australia display an average iron content of more than 55%.
Pricing Mechanism
Historically iron ore prices were negotiated between a “lead buyer” for the steel producers and a “lead seller” for the iron ore producers on a yearly basis. Due to increasing demand from China, spot prices for spot cargos were developed in recent years. In 2010 the industry switched from an annual pricing mechanism to a quarterly basis due to big swings in output prices and consolidation in the iron ore business, which resulted in the big three players having more negotiation power against its customers. However in the last years iron ore has taken a similar path to other commodities. Iron ore is now traded on financial exchanges and clearing houses via swaps, options and futures and new indices are being created. The MBIO62DA index, for example, is an index which was created by the Metal Bulletin. The index is a calculation of actual physical transactions for sinter fines delivered to Qingdao in China on a 62% Fe basis.
0 50 100 150 200 05.06.2009 05.06.2010 05.06.2011 05.06.2012 60 80 100 120 140 160 180 Q1 13 Q2 13 Q3 13 Q4 13 Q1 14 Intesa Sanpaolo SpA
Capital Economics Ltd Credit Suisse Group Westpac Banking Corp
Australia & New Zealand Banking Group Graph 24 – Analysts’ iron ore price forecasts
Source: Bloomberg
Source: Bloomberg Graph 25 – MBIO62DA Index
ARCELORMITTAL COMPANY REPORT
PAGE 22/31
Trend
A notable trend in the iron ore mining industry is the hunt for high-quality iron ore assets. On January 2nd 2013 China Steel Corp. and POSCO bought a 15% stake in ArcelorMittal Mines Canada. Far East steel producers will still produce high steel demand in the future and they seek to decrease their dependency on iron ore imports from Brazil and Australia. Canadian iron ore mines provide a good opportunity to do so. The mines in the Labrador trough help China Steel and POSCO diversify their sources for high-quality iron ore supplies, since iron ore from Far East mines is usually of lower quality.
Operations Analysis
ArcelorMittal has advanced to one of the five largest mining companies in the world in the last years. Production in 2011 accounted to 54.1m tonnes of iron ore and 8.3m tonnes of coking coal. Since 2011 the mining operations are reported as a separate segment – a decision that shows the company’s future focus on vertical integration and diversification. Currently there are 29 mining projects under operation. Iron ore operations are based in Canada, the US, Brazil, Ukraine, Kazakhstan and Liberia. Coal reserves are located in Kazakhstan, Russia and the US. ArcelorMittal achieved to establish a wide network of mining operations throughout several continents. Many iron ore and coal mines are located in countries, in which ArcelorMittal already manages steel producing facilities, which enables the company to optimize its supply chain.
Capital expenditure amounted to $1.3bn in 2011, about double the amount of 2010. The company has several key mining projects under way, which are supporting the 2015 target of iron ore production of 100mn tonnes per year and 11mn tonnes of coal per year. In Liberia the first shipments left the port of Buchanan in September 2011. It took 4 years to develop the necessary infrastructure, including 260km of railway and upgrades to the port and handling facilities. In Canada, ArcelorMittal has two essential projects under way with the expansion of the Mont-Wright mine and the acquisition of a 70% stake in Baffinland Iron Mines Corporation, possibly one of the iron ore richest mines in the world. In Brazil, the company invested in Andrade Mines, which has a potential production capacity of 1.7mn to 3.5mn tonnes per year.
The company’s expansion in the mining sector decreases its dependency on iron ore prices by the iron ore oligopoly. In 2012 most of the company’s capital expenditures of around $4.5bn are devoted to the mining business, since there is currently no necessity for increasing its steel producing capacity.
High-quality iron ore mines targeted by investors 0 500 1000 1500 China Australia Brazil India Russia Ukraine South Africa USA
Graph 26 – Major iron ore producing countries in 2011
Source: US Geological Survey
ARCELORMITTAL COMPANY REPORT
PAGE 23/31 In light of ArcelorMittal’s target of reducing its net debt in order to regain investment grade status by credit rating agencies, a partial sale of its mining activities in Canada was recently announced.
Comparables
As already mentioned, the global steel industry happens to be a highly fragmented industry. In its main markets in Europe and the Americas, ArcelorMittal has several steel producing competitors, of which many have a rather local focus.
The iron ore mining sector is dominated by the Big 3 (BHP Billiton, Vale, Rio Tinto). However due to iron ore being among the most common commodities worldwide, ArcelorMittal could enter this market several years ago in aiming to reduce its dependency on iron ore prices. Other integrated steel producers include Severstal and Wuhan.
Steel Sector
ArcelorMittal’s flat and long carbon businesses in North and South America prove to be the company’s cash cows at the moment. FCA achieved EBITDA of $2.1bn in 2011 and LC earned $1.9bn the same year. Companies which have a big footprint in the North American market are Nucor and US Steel. Nucor and US Steel manage steel mills throughout the US and several steel mills in other countries in the Americas. However both companies are also represented in Europe with either sales and trading offices or steel mills of subsidiaries. Both companies have recently been affected by Hurricane Sandy – Nucor temporarily shut down a steel mill in Connecticut – but will probably benefit the next years
Graph 27 – Mining Production (in million tonnes)
0,0% 10,0% 20,0% 30,0% 40,0% 50,0% 60,0% 0 10 20 30 40 50 60 70 80 2008 2009 2010 2011 2012E
Iron Ore Production Coal Production EBITDA %
ARCELORMITTAL COMPANY REPORT
PAGE 24/31 with rebuilding activities coming up across the East Coast. Nucor and US Steel are both trading at a price-earnings-ratio above 20. This can be explained by weak steel demand and high steel imports to the US, which resulted in oversupply in the US steel market and operating margins being squeezed for local players. As a result these companies reported lower earnings for its shareholders.
Brazil is about to show strong steel demand in the coming years. The Brazilian steel maker Gerdau has a strong presence in South America and is the largest producer of long steel products in the Americas. It produced 20.5m tonnes of crude steel in 2011, ranking 14th worldwide. Gerdau has the highest EV/EBITDA value in the industry, which highlights investors’ high expectations for the company and for the development of Brazilian steel demand.
The Asian steel industry is a highly competitive environment, in which China accounts for roughly 70% of steel production. According to the World Steel Association, 6 of the 10 world’s biggest steel producers are from China with ArcelorMittal being the only non-Asian based company among the Top 10. Other major Asian steel producers include POSCO from South Korea and Nippon Steel and JFE from Japan. According to Moody’s, a major issue for the Chinese steel sector is to bridge the gap between the huge supplies from domestic steel mills and slowing demand, which could lead to increasing exports from China in 2013. Tata Steel is an Indian-based multinational company with manufacturing operations in 26 countries. It is a dominant player in South East Asia (operations in Malaysia, Vietnam, Thailand) and Africa (Ivory Coast, Mozambique, South Africa), but has also operations in North America and Europe. Tata Steel is one of few globally diversified companies in the steel sector. The company intends to rapidly increase its production capacity in the next years and could therefore become a major competitor to ArcelorMittal, also due to ArcelorMittal’s efforts to establish a significant presence in the Indian market.
In the European markets, ArcelorMittal holds an outstanding position. Flat Carbon Europe has been the strongest segment in the last years in terms of sales. Europe is the continent with the highest steel use per capita and has historically shown strong demand. However due to the financial crisis in recent years demand has sharply decreased in the last years, which affected all steel producers with operations in Europe. Other producers based in Europe include ThyssenKrupp and Salzgitter from Germany, Gruppo Riva from Italy, Severstal from Russia and Metinvest from the Ukraine.
310 284,1 212,3 263 98,6 34,8 233,9 238,8 261,6 0 200 400 EU-27 Other Europe CIS NAFTA Central & South America Africa Middle East Asia Oceania
Graph 28 – Apparent steel use per capita
ARCELORMITTAL COMPANY REPORT
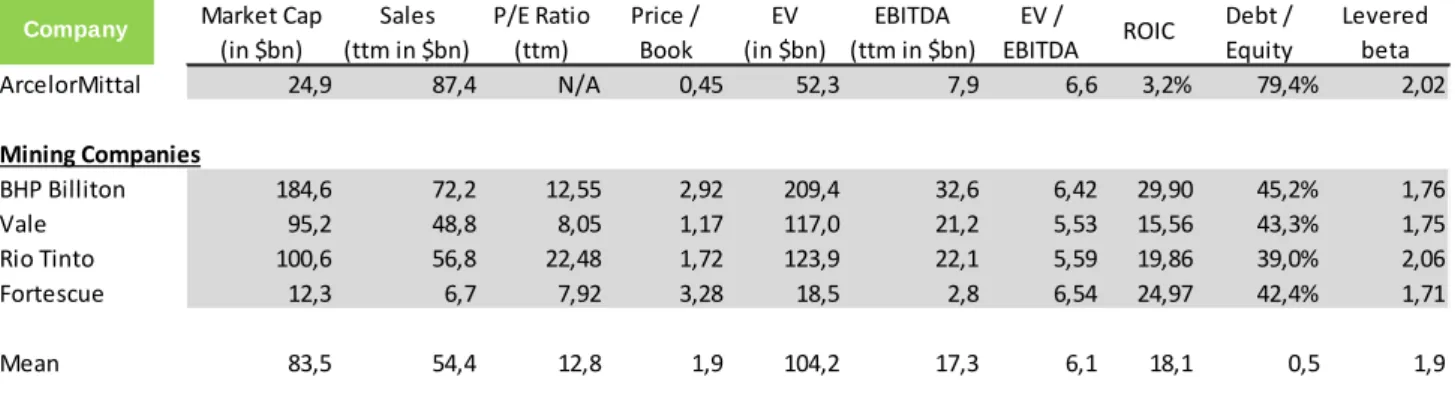
PAGE 25/31 When analysing Table 10, we can see that the steel industry is going through a difficult business cycle, as many companies feature negative P/E ratios for the trailing twelve months. Furthermore we can see that the steel industry is a highly leveraged industry with a mean debt-to-equity ratio of 75.8% for the displayed companies. ArcelorMittal shows below average EV/EBITDA and ROIC ratios, which could be explained by declining profit margins and high exposure to European economies. A levered beta of 1.58 (unlevered beta of 1.14) acknowledges the industry’s disproportional high correlation to the overall economy.
Mining Sector
As mentioned earlier, the iron ore mining sector is dominated by the three biggest iron ore producers, namely Vale, BHP Billiton and Rio Tinto.
Vale is the biggest producer of iron ore. The company maintains operations in all regions worldwide. Apart from iron ore, the company produces nickel, manganese ore, aluminium, copper and coal among others. Through a series of successful acquisitions and divestments the company managed to decrease its dependency on iron ore prices by also producing many non-ferrous metals. Vale’s competitors are all located in Australia. The Anglo-Australian company BHP Billiton is the largest mining company in the world, measured by sales in 2011. The company competes with Vale not only in iron ore, but also in aluminium or manganese production and has a presence in specialty products and in petroleum. Rio Tinto has also a diversified product base in the mining business and has its largest operations in Australia and Canada.
EV EBITDA (in $bn) (ttm in $bn) ArcelorMittal 24,9 87,4 N/A 0,45 52,3 7,9 6,6 3,2% 79,4% 2,02 Steel Companies Nucor 12,9 19,8 26,8 1,68 15,3 1,7 9,3 8,7% 16,7% 1,28 US Steel 3,2 19,7 N/A 0,82 6,6 0,9 7,5 2,9% 113,1% 1,90 Gerdau 14,1 20,2 17,4 1,11 42,6 2,3 18,6 6,2% 40,3% 2,00 POSCO 27,2 33,0 2,4 0,69 34,8 4,4 7,9 9,0% 29,7% 1,47
Nippon Steel 21,5 50,5 N/A 0,72 44,6 3,6 12,5 3,4% 60,1% 0,97
Tata Steel 7,0 25,5 7,03 0,89 15,7 2,0 7,8 7,5% 120,2% 1,87 ThyssenKrupp 10,8 51,0 N/A 1,08 19,2 3,0 6,4 -6,7% 52,8% 1,39 Integrated Companies Severstal 9,6 13,9 10,32 1,34 13,2 2,2 6,1 11,3% 71,4% 1,56 Wuhan 4,4 14,4 N/A 0,77 10,8 1,3 8,4 1,6% 174,3% 1,35 Mean 13,6 33,5 12,8 1,0 25,5 2,9 9,1 5% 75,8% 1,58 Levered beta Company EV / EBITDA ROIC Debt / Equity P/E Ratio (ttm) Price / Book Market Cap (in $bn) Sales (ttm in $bn) Table 10 – Comparable Steel Companies
Source: Bloomberg, Analyst estimates
Iron ore mining
companies operate with less gearing than steel producers