A
NALYSIS OF
M
ETHODOLOGIES FOR
V
ULNERABILITY AND
R
ISK
A
SSESSMENT ON
C
OASTAL
A
REAS
RUI PEDRO ARAÚJO MOURA
Dissertação submetida para satisfação parcial dos requisitos do grau de MESTRE EM ENGENHARIA CIVIL —ESPECIALIZAÇÃO EM HIDRÁULICA
Orientador: Professor Doutor Francisco de Almeida Taveira Pinto
Tel. +351-22-508 1901 Fax +351-22-5081446
Editado por
FACULDADE DE ENGENHARIA DA UNIVERSIDADE DO PORTO
Rua Dr. Roberto Frias 4200-465 PORTO Portugal Tel. +351-22-508 1400 Fax +351-22-508 1440 [email protected] http://www.fe.up.pt
Reproduções parciais deste documento serão autorizadas na condição que seja mencionado o Autor e feita referência a Mestrado Integrado em Engenharia Civil - 2015/2016 - Departamento de Engenharia Civil, Faculdade de Engenharia da Universidade do Porto, Porto, Portugal, 2015.
As opiniões e informações incluídas neste documento representam unicamente o ponto de vista do respetivo Autor, não podendo o Editor aceitar qualquer responsabilidade legal ou outra em relação a erros ou omissões que possam existir.
Este documento foi produzido a partir de versão eletrónica fornecida pelo respetivo Autor.
To my Parents and Rui
A liberdade só existe quando todos os nossos actos concordam com o nosso pensamento.
ACKNOWLEDGEMENTS
It would have not been possible to write this master thesis without the help and support of the kind people around me, to only some of whom it is possible to give particular mention here.
First of all, I would like to acknowledge to my dissertation supervisor Professor Doctor Taveira Pinto, for the exceptional support while developing this master thesis. My most profound thanks for being a personal reference to me and for the efforts to provide all the assistance needed for a successful thesis. The good advice, support and friendship of Taveira Pinto, has been invaluable on both on academic and personal level, for which I am extremely grateful.
An acknowledgment should also be made to Professor Doctor Carlos Coelho of University of Aveiro, for his advices and explanations regarding the concepts related with an vulnerability and risk analysis of coastal zone.
A special acknowledgment to D. Esmeralda Miguel, employee of IHRH, for all the kindness, affection and comfort words during the elaboration of this thesis.
To all of my family for being a constant source of motivation, strength and friendship during my academic career. I would like to make a particular mention to my parents for all the affect and support shown, especially during this semester.
To all of my friends, that supported me at the most difficult times during this work, contributing with kind words of support, helping to overcome the different issues. A particular acknowledgement to Rui for all the strength and advices, and Rita.
RESUMO
Este trabalho, realizado no âmbito da defesa da dissertação para a obtenção do grau de mestre em Engenharia Civil da Faculdade de Engenharia da Universidade do Porto, incidiu sobre as diversas metodologias que existem para avaliar a vulnerabilidade e risco costeiro presentes nas zonas costeiras. Nas últimas décadas e de forma generalizada mundialmente, a crescente presença de populações ao longo da orla costeira bem como os sucessivos eventos tempestuosos, tem alertado junto das entidades responsáveis pela gestão e planeamento costeiros para uma cada vez mais eficiente avaliação de vulnerabilidade e risco, como forma de auxilio com base em critérios científicos válidos.
A vulnerabilidade é entendida como as características e as circunstâncias da comunidade, sistema ou bem que o fazem susceptível aos efeitos prejudiciais de um hazard. Neste contexto, hazard remete para um fenómeno perigoso que pode causar perda de vida, impactos na saúde, danos em propriedades, perdas em meios de subsistência e serviços, interrupção socioeconómica e dano ambiental. Estes fenómenos perigosos são a erosão costeira, inundações e galgamentos.
No âmbito desta dissertação será estudada a vulnerabilidade das zonas costeiras face às acções do mar, nomeadamente, ao efeito das ondas, marés e correntes, bem como à subida do nível médio das águas do mar. Este último tem sido responsável pela criação e desenvolvimento da maior parte das metodologias de avaliação de vulnerabilidade e risco costeiro.
Desde o lançamento da "Common Methodology (CM)" pelo IPCC em 1991, um crescente número de abordagens em relação à vulnerabilidade costeira tem surgido e contribuído para o conhecimento avançado neste assunto. Eles variam desde guias básicos, técnicas e métodos de avaliação de vulnerabilidade e risco, métodos baseados em índices, métodos baseados em modelos dinâmicos e sistemas de apoio à decisão baseados em Sistemas de Informação Geográfica. Enquanto os primeiros três grupos de metodologias eram principalmente qualitativos e baseados no parecer do perito, os métodos baseados em modelos dinâmicos e sistemas de apoio à decisão foram desenvolvidos com recurso a modelos ambientais, bases de dados e ferramentas de avaliação que fornecem informação endereçando os campos físico, espacial, ecológico e económico.
Algumas características do Sistema de Apoio à Decisão desenvolvido no âmbito do Projecto THESEUS serão brevemente descritas.
PALAVRAS-CHAVE:Metodologias de análise, avaliação de vulnerabilidade costeira, classificação de risco, Sistemas de Apoio à Decisão.
ABSTRACT
This work, performed on the scope of the dissertation defence to achieve the Masters' degree on Civil Engineering from the Faculty of Engineering of University of Porto, focused on the several available methodologies for vulnerability and risk assessment on coastal areas.
In the last decades and generally worldwide, the growing presence of populations along the coast as well as the successive stormy events, has alerted authorities responsible for the management and coastal planning for an increasingly effective vulnerability and risk assessment, as a form of support based on valid scientific criteria.
The vulnerability is understood as the characteristics and circumstances of the community, or that are susceptible to the damaging effects of a hazard. In this context, hazard refers to a dangerous phenomenon which can cause loss of life, health impacts, damage to property, loss of livelihoods and services, socio-economic disruption and environmental damage. These dangerous phenomena are the coastal erosion, flooding and overtopping.
This dissertation will be focused on the vulnerability of coastal areas with regard to the actions of the sea, in particular, the effect of waves, tides and currents, as well as to rising sea level. The latter has been responsible for the creation and development of several methodologies for vulnerability and risk assessment on coastal areas.
Since the release of the Common Methodology, by the IPCC in 1991, a raising number of different approaches addressing coastal vulnerability has arisen and contributed to the advanced knowledge in this subject. They range from basic guidelines, techniques and methods for assessing vulnerability and risk, index-based methods, methods based on dynamic computer models and GIS-based Decision Support Systems. While the first three groups of methodologies were mainly qualitative and based on expert judgment, methods based on dynamic computer models and GIS- based DSS have been built with environmental models, databases and assessment tools, which provide information across physics, ecology, spatial sciences and economy field.
THESEUS Project, namely some features of the latest Decision Support System developed will be briefly described.
KEYWORDS: Methodologies of assessment, coastal vulnerability assessment, risk classification, Decision Support Systems.
GENERAL INDEX
ACKNOWLEDGEMENTS ... i
RESUMO ... iii
ABSTRACT ... v
GENERAL INDEX ... vii
FIGURES INDEX ... xi
TABLES INDEX... xiii
1. INTRODUCTION
... 11.1. MOTIVATION ... 1
1.2. FRAMEWORK ... 1
1.3.OBJECTIVES ... 2
1.4.THESIS STRUCTURE AND CHAPTERS DESCRIPTION ... 2
2. COASTAL ZONES: VULNERABILITY, RISK AND
OTHER CONCEPTS ... 5
2.1.INTRODUCTION ... 5
2.2.COASTAL ZONES AND POPULATION:PRESENT AND FUTURE ... 6
2.3.COASTAL HAZARDS:EROSION,FLOODING AND OVERTOPPING ... 7
2.4.VULNERABILITY ... 14
2.4.1.DEFINITION OF TERMS AND RELATED CONCEPTS ... 14
2.4.2.VULNERABILITY ON COASTAL ZONES ... 17
2.4.3. VULNERABILITY PARAMETERS AND INDICATORS ... 18
2.4.3.1. Topography ... 19
2.4.3.2. Distance to the shoreline ... 20
2.4.3.3. Geology ... 20
2.4.3.4. Geomorphology ... 20
2.4.3.5. Soil Covering ... 21
2.4.3.6. Tidal Range ... 22
2.4.3.7. Significant Wave Height ... 22
2.4.3.9. Anthropogenic Actions ... 23
2.4.4. REPRESENTATION OF VULNERABILITY CHARTS ... 24
2.5.RISK IN COASTAL AREAS ... 25
2.5.1. RISK ASSESSMENT ... 25 2.5.2. RISK ANALYSIS ... 26 2.5.3. HUMAN IMPACTS ... 26 2.5.4. ECONOMIC IMPACTS ... 27 2.5.5. ENVIRONMENTAL IMPACTS ... 27 2.5.6. HERITAGE IMPACTS ... 28 2.6.FINAL REMARKS ... 28
3.
VULNERABILITY
AND
RISK
ASSESSMENT
METHODOLOGIES ... 27
3.1.INTRODUCTION ... 27
3.2.SIMPLE APPROACHES OF COASTAL VULNERABILITY ANALYSIS ... 27
3.2.1. INTRODUCTION ... 27
3.2.2. IPCCCOMMON METHODOLOGY (CM) ... 27
3.2.3. UNEPMETHODOLOGY ... 29
3.3.TECHNIQUES AND METHODS FOR VULNERABILITY AND RISK ASSESSMENT ... 30
3.3.1. INTRODUCTION ... 30
3.3.2. AERIAL VIDEOTAPE-ASSISTED VULNERABILITY ANALYSIS (AVVA)... 30
3.3.3. SIMPLE MULTI ATTRIBUTE RATING TECHNIQUE (SMART) ... 32
3.3.3. COASTAL ZONE SIMULATION MODEL (COSMO) ... 36
3.4.INDEX-BASED METHODS ... 38
3.4.1. COASTAL VULNERABILITY INDEX (CVI) ... 41
3.4.2. COASTAL VULNERABILITY INDEX FOR SEA-LEVEL RISE (CVI-SLR) ... 44
3.5.METHODS BASED ON DYNAMIC COMPUTER MODELS ... 45
3.5.1. INTRODUCTION ... 45
3.5.2. RISK ASSESSMENT OF COASTAL EROSION ... 46
3.5.2.1. Introduction ... 46
3.5.2.2. General Approach ... 47
3.5.2.3. Source Data Analysis ... 49
3.5.2.5. Risk Assessment ... 52
3.5.3. SIMCLIM AND COASTCLIM ... 54
3.5.4. DYNAMIC INTERACTIVE VULNERABILITY ASSESSMENT (DIVA) ... 57
3.5.4.1. Introduction ... 57
3.5.4.2. The DIVA Method ... 58
3.5.4.3. The DIVA Tool ... 59
3.5.4.4. Application of DIVA Tool ... 61
3.6.GIS-BASED DECISION SUPPORT SYSTEMS ... 63
3.6.1. DESYCODSS ... 63
3.6.1.1. Introduction ... 63
3.6.1.2. Approach ... 63
4. THESEUS - A NEW DECISION SUPPORT SYSTEM
... 694.1.INTRODUCTION ... 69
4.2.MODELLING FRAMEWORK ... 70
4.2.1.CONCEPTUAL FRAMEWORK ... 70
4.2.2.MODELLING PHYSICAL PROCESSES ... 71
4.2.3.MODELLING COASTAL ECOSYSTEMS ... 73
4.2.4.REPRESENTATION OF SOCIETY ... 77
4.2.5.ECONOMIC MODELLING ... 79
4.2.6.MULTI-CRITERIA DECISION MAKING ... 80
4.3.END USER INVOLVEMENT IN THESEUS ... 80
4.3.1.FUNDAMENTALS OF THESEUSDSS ... 80
4.3.2.TOOL DESIGN ... 81
4.3.3.TYPE OF OUTPUTS ... 82
4.4.TECHNICAL STRUCTURE ... 86
4.4.1.STRUCTURE ... 86
4.5.CHALLENGES AND LIMITATIONS OF THE THESEUSDSS ... 92
4.6.CONCLUSIONS... 93
5. CONCLUSIONS ... 95
5.1.AN OVERVIEW OF THE CONTENT ... 95
BIBLIOGRAPHY ... 99 FIGURES WEB SOURCES ... 105
FIGURES INDEX
Figure 2.1 – Miami Downtown and Miami Beach, Florida, United States of America ... 6
Figure 2.2 – Storm waves breaking over the breakwater of Porthcawl, Wales, United Kingdom ... 7
Figure 2.3 – Dune erosion in Long Beach Island, New Jersey, United States of America ... 9
Figure 2.4 – Coastal bluff retreat, Solana Beach, California, United States of America (Ewing, 2014) 10 Figure 2.5 – Various 2100 Global and Regional Sea-Level Projections (California Coastal Commission, Draft Sea-Level Rise Guidance) ... 11
Figure 2.6 – Trends between Water Levels and Coastal Consequences Source: California Coastal Commission, Draft Sea-Level Rise Policy Guidance as modified by R. Flick and L. Ewing (Ewing, 2014) ... 12
Figure 2.7 – Hazard Map portraying lines of equal probability of loss due to erosion (Halcrow Group, 2007) ... 14
Figure 2.8 – Risk Map of coastal erosion (Pereira and Coelho, 2010) ... 15
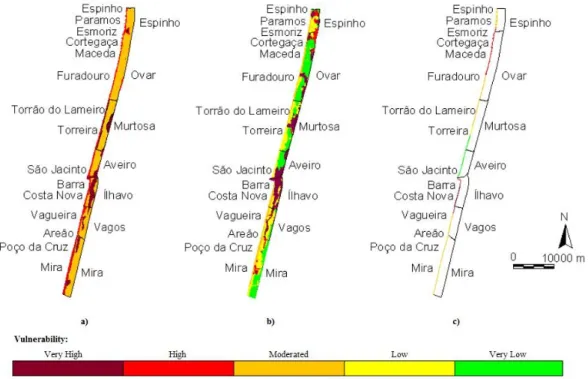
Figure 2.9 – Vulnerability charts regarding a) Geomorphology, b) Soil Covering and c) Accretion and Erosion Rate (Pereira and Coelho, 2010) ... 22
Figure 3.1 – Distribution of land at risk in different stretches of the Portuguese coast and summary data for all the country (Andrade e Freitas, 1995) ... 39
Figure 3.2 – Opening screen of COSMO tool (COSMO Manual, 1994) ... 40
Figure 3.3 – Coastal Vulnerability Map for Andalusia (Ojeda-Zújar et al., 2009) ... 46
Figure 3.4 – Coastal Vulnerability Map for beaches of Illawarra coast in Australia (Abuodha and Woodroffe, 2006)) ... 47
Figure 3.5 – Asset Risk Influences (Halcrow Group, 2007) ... 50
Figure 3.6 – Assessment Framework (Halcrow Group, 2007) ... 50
Figure 3.7 – Pathway Analysis (Halcrow Group, 2007) ... 51
Figure 3.8 – Timelines for (a) defence failure, and (b) natural erosion processes for an indicative stretch of coastline (Halcrow Group, 2007) ... 52
Figure 3.9 – Erosion Scenarios with Defence Influence (Halcrow Group, 2007) ... 54
Figure 3.10 – Probability of erosion for a given distance (Halcrow Group, 2007) ... 55
Figure 3.11 – Probability of erosion for a given time and distance (Halcrow Group, 2007)... 55
Figure 3.12 – Example of a risk map portraying the risk loss of an asset (Halcrow Group, 2007) ... 56
Figure 3.13 – Mapping Output - Zones of equal probability of loss (Halcrow Group, 2007) ... 56
Figure 3.14 – Mapping Output - Future shoreline position (Halcrow Group, 2007) ... 57
Figure 3.15 – Example of spatial and site-time projections produced by SimCLIM scenario generator (Warrick, 2009) ... 58
Figure 3.16 – Output for demo site 2, in Western Australia generated for CoastCLIM version 0.1
(Abuodha and Woodroffe, 2006) ... 60
Figure 3.17 – The development process of DIVA method (Hinkel and Klein, 2009) ... 61
Figure 3.18 – Expected number of people subject to annual flooding (3 different scenarios) (Hinkel and Klein, 2009) ... 65
Figure 3.19 – Global application of DIVA, results for expected number of people subject to annual flooding in 2100 under SRES A1F1 scenario and no adaptation measures being taken (Hinkel and Klein, 2009) ... 65
Figure 3.20 – Integration of factors and metrics to produce the cascade of maps from the DESYCO-RRA system (ETC-CCA, 2011) ... 68
Figure 3.21 – Example of GIS-based maps produced by the DESYCO in the North Adriatic Region: exposure map for a (a) flooding scenario of 174 cm in 2100, (b) susceptibility map, (c) risk map and (d) damage map for the receptor protected areas (Torresan et al, 2013) ... 70
Figure 4.1 – Synthetic overview of the structure of the integrated model (Zanuttigh et al., 2014) ... 85
Figure 4.2 – The start view (Zanuttigh et al., 2014) ... 86
Figure 4.3 – Scenarios screen (Zanuttigh et al., 2014) ... 87
Figure 4.4 – Mitigations screen (Zanuttigh et al., 2014) ... 88
Figure 4.5 – Editing an engineering option in front of Cesenatico, Italy (Zanuttigh et al., 2014) ... 88
Figure 4.6 – Editing an engineering option in front of Cesenatico, Italy (Zanuttigh et al., 2014) ... 89
Figure 4.7 – Execution screen (Zanuttigh et al., 2014) ... 90
Figure 4.8 – THESEUS DSS structure and flow of information (Zanuttigh et al., 2014) ... 91
Figure 4.9 – GIS based map and information about land use (Zanuttigh et al., 2014) ... 92
Figure 4.10 – GIS based map and information about population density and age (Zanuttigh et al., 2014) ... 92
Figure 4.11 – Map of flooding velocities for the long term scenario with return period of 100 years (Zanuttigh et al., 2014) ... 94
Figure 4.12 – Impact on critical facilities expressed in percentage (Zanuttigh et al., 2014) ... 95
TABLES INDEX
Table 2.1 – Characteristics of Erosion Events (Ewing, 2014) ... 8
Table 2.2 – Vulnerability classification regarding topographic elevation (Coelho, 2005) ... 19
Table 2.3 – Correspondence between the degree of vulnerability and the likely phenomenon (Coelho, 2005) ... 19
Table 2.2 – Vulnerability classification regarding topographic elevation (Coelho, 2005) ... 19
Table 2.4 – Vulnerability classification regarding distance to the shoreline (Coelho, 2005) ... 20
Table 2.5 – Vulnerability classification regarding shore geology (Coelho, 2005) ... 21
Table 2.6 – Vulnerability classification regarding geomorphology (Coelho, 2005) ... 21
Table 2.7 – Vulnerability classification regarding soil covering (Coelho, 2005) ... 21
Table 2.8 – Vulnerability classification regarding tidal range (Gornitz et al., 1997) ... 22
Table 2.9 – Vulnerability classification regarding significant wave height (Gornitz et al., 1997) ... 22
Table 2.10 – Vulnerability classification regarding accretion/erosion rate (Coelho, 2005) ... 23
Table 2.11 – Vulnerability classification regarding anthropogenic actions (Coelho, 2005)... 24
Table 2.12 – Risk classification of human impacts (Coelho, 2005) ... 27
Table 2.13 – Risk classification of economic impacts (Coelho, 2005) ... 27
Table 2.14 – Risk classification of environmental impacts (Coelho, 2005) ... 28
Table 2.15 – Risk classification of heritage impacts (Coelho, 2005) ... 28
Table 3.1 – Comparison of the IPCC Common Methodology for vulnerability assessment procedures and its refinement in Australian context (adapted from Abuodha and Woodroffe, 2006) ... 31
Table 3.2 – Validity, ease of use and computer requirements of the IPCC Common Methodology ... 32
Table 3.3 – Natural attributes regarding geomorphology (Andrade e Freitas, 2002) ... 34
Table 3.4 – Socio-economic classification system (Andrade and Freitas, 2002) ... 35
Table 3.5 – Attributes used to describe vulnerability of the coast to land loss (Andrade and Freitas, 2002) ... 37
Table 3.6 – Socio-economic attribute and rank used in SMART approach (Andrade and Freitas, 2002)37 Table 3.7 – Classification of Risk (Andrade and Freitas, 2002) ... 38
Table 3.8 – Summary of Coastal vulnerability indices, their geographical application and the variables needed to implement them (Abuodha and Woodroffe, 2006) ... 42
Table 3.9 – Formulas tested by Gornitz and White (1992) and Gornitz et al. (1997) to derive the final CVI index (ETC-CCA, 2011) ... 45
Table 3.10 – Ranking scores of key variables for the Australian beach case (Abuodha and Woodroffe, 2006; ETC-CCA, 2011) ... 47
Table 4.1 – Definitions of the Environmental Vulnerability Index (EVI) (Zanuttigh et al., 2014) ... 78
Table 4.2 – Example of EVI table for Sabellaria reefs (Zanuttigh et al., 2014) ... 79
Table 4.3 – Approximated Social Value (Zanuttigh et al., 2014) ... 81
Table 4.4 – Factor flood depth (De) (Schwarz and Maiwald; Zanuttigh et al., 2014) ... 82
Table 4.5 – Factor flood duration (D) (Zanuttigh et al., 2014) ... 82
Table 4.6 – Factor seasonality (Zanuttigh et al., 2014) ... 82
NOMENCLATURE
ai - constants for each land use j
bj - constants that express the expected period to restore economic activities c - Wave celerity
D - Factor flood duration D50 - Median beach grain size De - Factor flood depth
h - Water depth corresponding to breaking conditions for Hs Hs - Significant have height
f2.5 - Friction factor dependent on the grain size Fd - Flood duration
Fy - Flood depth
k - Constant governing the rate at which the shoreline approaches the equilibrium L0 - Wave length
P - Sediment pick-up rate r - Marine water density
Ru2% - Wave run-up corresponding to the characteristic value of 2% exceeding probability s - Relative density of sediments
S - Seasonality
Sed_y - Sediment deposition depth
Sed_yd - Sediment deposition and duration Uw - Near bed velocity
tb - Bottom shear stress due to waves te - Critical bottom shear stress for erosion Tr - Return Period
vij - Values of land uses in euro/m 2
/year Ws - Constant settling velocity of sediments y(t) - Shoreline position at time t
yeq(t) - Equilibrium shoreline position determined by forcing at time t Z - Wave action
Zm - Storm surge level
- Wave set-up β - Beach slope
1
INTRODUCTION
1.1.MOTIVATION
Nowadays, coastal zones are largely considered worldwide as one of the best environments to live. By the other hand, the unplanned occupation of populations in these zones has exposed them to various types of extreme events. Therefore an analysis of the coastline environment is required, regarding both local sea characteristics and changes that the coast has been through since the human presence. In the late decades, the number of studies concerning risk and vulnerability on coastal zones start to increase due mainly to the raising of awareness given by the media relating these destructive events. Despite the great recent developments and different methodologies developed, much is still to be discussed and clarified.
This master thesis intends to give some information concerning the content of methodologies for vulnerability and risk assessment in the coastal zones.
1.2.FRAMEWORK
Since remote times that populations have chosen coastal environment to settle and develop its life support activities. The number of people increased in the last decades and it is likely that such number will continue to grow while the environment quality is declining and local sea characteristics are reaching new values within smaller periods of time.
Many coastal areas and human activities are subject to increasing risks from natural and man-induced hazards such as flooding, coastal erosion and overtopping. This is particularly worrying in large coastal communities, where the presence of large amounts of people can lead to an emergency situation where the main disasters possible to happen are loss of lives, damaged infra-structures and disrupt transports and communications for days or weeks.
Since recent times that the study of this subject started. In the beginning, analysis were mainly qualitative due to the difficulty in obtaining data to incorporate in models and simulations. With the necessity for better information, namely quantitative, the different ways of classifying risk and vulnerability (Methodologies, Tools, Models, Decision Support Systems) started to extent the detail of the analysis including more advanced outputs.
By improving the understanding and awareness of the risks a coastal zone faces, decision makers, stakeholders and interested parties are in better position to agree on preventative measures to take and to prepare in ways to avoid the most severe consequences of natural and man-made hazards. The process of producing a risk assessment will also enable both public authorities and businesses, NGO's, and the general public to reach a common understanding of the risks face as a community.
The development of risk assessment and vulnerability analysis reveal to be of great value, giving contributions to the support of decision making and planning of coastal areas. Also, they contribute to ensure that policy decisions are prioritised in ways to address the most severe risks with the most appropriate prevention and preparedness measures.
1.3.OBJECTIVES
Following what was exposed in the previous point, the current master thesis was developed based on the following objectives. To introduce the whole subject of risk assessment it should be purposed a definition and discussion of the related concepts as well as make reference to what are the main vulnerability parameters to characterize the sensitivity of coastal strip considered.
Another fundamental objective of this thesis is to make reference to the existing methodologies, models, tools and Decision Support Systems, responsible for the vulnerability analysis, risk evaluation and adaptation measures. They are divided in groups according to the scale of application, level of detail, type of outputs and qualitative/quantitative information.
As previously mentioned, the need for risk assessment arises from the presence of populations at an hazard zone, which has suffered from at least one resulting phenomena of ocean dynamics, sea waves, tides and currents or consequence of sea-level rise.
Flooding, coastal erosion and overtopping are the most frequent hazards that coastal zones have to deal with. A description and characterization of them are of utmost importance for the necessary understand of how their consequences should be reduced. It is important to characterize and to frame in the investigation and research process for plausible planning strategies and defence options.
Risk assessment of coastal areas due to extreme events has been developing since the 80's. The main reason is the fact that some knowledge is necessary to inform coastal communities and to take part of the scientific content in political and planning measures.
To be able to classify the risk that a given coastal area faces, there are some steps that should be done before. To evaluate the sensitivity of the coast, a vulnerability analysis turns to be the first step.
1.4.THESIS STRUCTURE AND CHAPTERS DESCRIPTION
This thesis is divided into 3 core chapters, described as follows. After this first introductory chapter, the second chapter is intended to introduce the main reasons behind the concept of risks and vulnerability assessments by making reference to the causes and what motivates this type of research. In this context, causes can be understood as the things that asks for risk and vulnerability assessments, like the presence of populations along the coast or the dangerous phenomena that make them vulnerable. These dangerous phenomena are the coastal hazards, namely coastal erosion, dune or bluff, flooding and overtopping.
The chapter presents the basic terminology when dealing with the risk and vulnerabilities assessment, lists some examples of vulnerability parameters and their classification, based on previously analysis of worldwide study cases.
Chapter 2 also introduces the whole concept of vulnerability of coastal zones, making a reference to the parameters or indicators most used to assess the sensitivity or exposure of that coastal zone. In Chapter 3 is gathered information based on the state of art and reviewed literature. It stars to making a brief introduction to the different types of approaches that the process of risk and vulnerability classification has.
The fourth chapter introduces the new GIS-based Decision Support System, recently developed by a EU-funded project that provides an integrated project within coastal risk assessment and mitigation. It was chosen due to its features, namely the integrated methodology for planning sustainable defence strategies for the management of coastal erosion and flooding, addressing technical, social, political and environmental aspects.
THESEUS will be described in this chapter, regarding the main assumptions and considerations made by its authors while developing the different components of the Decision Support System, namely the modelling tool.
The fifth chapter will include the conclusions of this present work, focusing on some particular features of some previously referred methodologies for vulnerability and risk assessment. Some future improvements that developers should address will also be pointed in the current chapter.
2
COASTAL ZONES: VULNERABILITY, RISK AND
OTHER CONCEPTS
2.1.INTRODUCTION
Coastal zones are part of nature fascination. Since remote times in human history that populations have chosen the coastal environment as one of the best places to live. For this reason, vulnerability and risk assessment pretends to give answers to policy-making authorities in order to protect populations by showing results of the analysis done.
Ocean dynamics and sea-level rise are subjects that interest to authorities and stakeholders in order to provide an efficient management of the coastal zone. For these reasons, a specific definition, or at least with a common understanding, should be establish in order to make clear to all the possible interventions.
Concerns about coastal hazards and disasters have become linked closely to risk and vulnerability. Hazards, risks, disasters, and vulnerabilities have each one slightly different concerns, but the terms are occasionally used interchangeably (Cutter, 2002). For this reason, developing a wide knowledge in this subject requires a fundamental understanding of these concepts and their relations.
This chapter introduces the general process of vulnerability and risk analysis by making a brief description of all the concepts and meanings that should be understood in order to create a bright image of what involves a risk assessment process.
Furthermore, a description of which parameters are considered when developing the assessment of vulnerabilities and risks will be made, based on the assumptions and considerations taken by (Coelho, 2005, Gornitz et al., 1997, Thieler and Hammar-Klose, 1999).
The analysis and classification of vulnerability is fundamental to characterize the sensitivity of a given stretch of a coastal zone, in particular to all the maritime actions which result in frequent overtopping, flooding and coastal erosion. Such actions undermine the socio-economic activities located on the coast, often leading to interruptions for maintenance and rehabilitation of defence structures (Gornitz et al., 1997).
2.2.COASTAL ZONES AND POPULATION:PRESENT AND FUTURE
Since remote times in history that populations has chosen the coastal environmental for settle, develop economic and commercial activities, establish a way of communication and for recreational and touristic purposes.
A significant and increasing part of the EU population lives in the coast. Some reports from studies carried out by international entities related with the quantification of coastal occupation, state the following data:
Approximately half the EU population lives 50 km or less from the coast (ESTAT, 2009); Approximately 19% of the EU population (86 million people) lives within a 10 km coastal
strip (EEA, 2006);
Collectively, this two aspects placing growing demands on coastal resources as well as increasing people‟s exposure to coastal hazards (Sterr et al., 2000).
As evidenced by these references, the coastal occupation has resulted in the current society many concerns, due mainly to the presence of a high number of people. Coastal zones are places under high habitation pressure, including a wide number of often conflicting human and socio-economic activities occurring there. Figure 2.1 shows an example of a highly pressurized coast.
Figure 2.1 - Miami Downtown and Miami Beach, Florida, United States of America
The widely group of resources that coastal zones offer to populations, and its increasable urbanisation, tourist facilities, recreational activities and others, has demanded a growing worry to policy-makers and other entities that deal with this multi-hazard scenario.
Further that, there are studies which predict that is likely that such numbers of population will increase in the future (Ramieri et al., 2011).
The human presence along the coast and its expansion evidenced worldwide, "asks" for the creation and development of risk assessment methodologies, ranging from tools and techniques of vulnerability
analysis to more complex decision support systems, to give solutions to coastal communities as well as formulate an agreed basis for politics in planning options.
2.3.COASTAL HAZARDS:EROSION,FLOODING AND OVERTOPPING
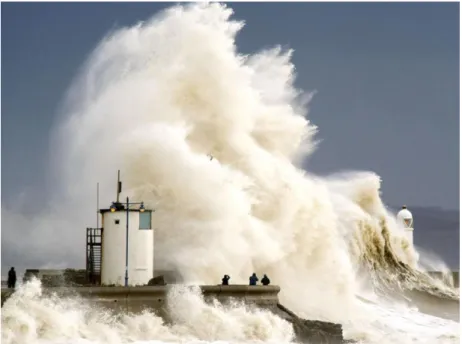
Coastal hazards are the physical phenomena that expose a coastal area to risk of loss of life, property damage and environmental degradation. The major coastal hazards that coastal communities face are flooding, wave impacts and subsequent overtopping, and erosion resulting from storms.
Figure 2.2 - Storm waves breaking over the breakwater of Porthcawl, Wales, United Kingdom
Events like storm waves, flooding and erosion share similar damage mechanisms. Damage can occur during these events including high water level, strong currents, impact forces, and erosion.
A list of the consequences of these actions are presented below (Cutter, 2002): loss of human lives;
property losses ranging from damage to complete destruction; environmental damage;
shoreline reconfiguration;
interruptions of routine community, and
short- and long-term disruptions of economic activity.
Table 2.1 provides some characteristics of the erosion event and the possible influences resulting from climate change (Cutter, 2002).
Table 2.1: Characteristics of Erosion Events (Ewing, 2014)
Event type Pre event Event Post-event Condition Influences from Climate change
Erosion
Beach, dune, and bluff erosion often driven by storm events and large waves.
Rapid drop in beach elevation as sand is carried offshore.
Initial beach recovery within days to weeks, often not to pre-event conditions. Longer term beach and dune recovery can be a season to several years.
Increased inland migration of beach face due to sea-level rise and greater inundation.
Bluff erosion can be preceded by cracks in upper bluff or landslide conditions. Retreat of bluff bringing its sediments to the beach or nearshore. Long-term erosion of beach and dune is possible. Bluff retreat irreversible within foreseeable time periods.
Increased inland retreat of dunes and bluffs due to adjustment in beach position and increased frequency and power of wave attack due to higher water levels from sea-level rise.
The characteristics of erosion events will influence options that communities consider for resilience. Here, resilience means the ability of a community or system to maintain functionality during events. The event characteristics represent the safety and protection options that could minimize consequences. The post-event characteristics indicate the options and timing for response and recovery, and influences due to climate change indicate suitability of using historic trends and prior disasters to future events (Ewing, 2014).
As previously mentioned, coastal erosion is a variable phenomenon, whether in time and space. It is important to understand the causes which may lead to different types of destruction, and to search for solutions whether the place is highly inhabited or it presents only ecological values. Sometimes it is possible to link some wave behaviour with erosion phenomenon.
Beach erosion can be the seasonal change or the long-term changes in the beach shoreline position. Seasonal changes are often strongly associated with the wave climate, where the higher energy storm waves and “winter” waves pull sand off the beach and the milder, “summer” waves bring sand back onto the beach. Sea-level rise will increase beach erosion and/or the landward retreat of the beach. Long-term beach erosion, resulting from wave action, storms, and changes in sediment supplies, can result in a chronic narrowing or landward migration of the shoreline. Sometimes, this may be accompanied by the inland relocation of the back shore, or, if the back shore position is fixed, it will result in an overall narrowing of the upper beach zone (Ewing, 2014)
The direct threats from both seasonal and long-term beach erosion are that inland structures may be undermined, a loss of foundation support can occur and the stability of the buildings, roadways, pipelines, or other developments supported by the beach will be at risk (Ewing, 2014).
The loss of beach width will also reduce buffering and dissipation of wave energy and flood waters in front of inland development. So, an indirect impact from beach erosion can be the increased damage to inland development from wave attack and flooding.
Dune erosion also results from wave energy dissipation. In a beach-dune system there is often an exchange of sand between the beach and dunes. When there is excess of beach sand, wind will carry it into the dunes resulting in dune growth. But, as waves erode the beach area, the back dune system can serve as a sand storage system, providing additional sand to the beach and nearshore areas during storm events. The cycle of sand exchange between the beach and the dune, like seasonal beach change is rapid in the dune erosion phase and slower in the dune recharge phase.
The transfer of sand from the dunes to the beach can occur in a few hours during a storm, but the rebuilding of the dune may take several years, if there is enough sediment in the littoral cell. If new supplies of sediment are not available in the area, the beach-system dune may become a one-way conveyance of sand, where the dunes rarely experience any accretion (Ewing, 2014).(Ewing, 2014)(Ewing 2014)(Ewing 2014)(Ewing 2014)(Ewing 2014)
Dune erosion, Figure 2.3, like beach erosion, can cause inland structures to be undermined or lose foundation support. The loss of dune width will also reduce the buffering and dissipation of wave energy, causing indirect impacts similar to those associated with beach erosion. And, a migrating dune system can move inland, sand blasting and covering inland development or overrunning roads, filling drainage areas.
Figure 2.3 - Dune erosion in Long Beach Island, New Jersey, United States of America
Coastal bluff erosion, as shown in Figure 2.4, can result from wave attack as well as geologic faulting, landslides, and groundwater soil saturation. Coastal bluff erosion is not considered to be reversible because can accrete from seismic activity over thousands of years, but bluffs will not rebuild within human-scale time periods.
Bluff erosion can occur as a gradual, chronic loss of bluff material, or it can be rapid and episodic. Most of bluffs experience both chronic and episodic erosion, although the episodic events are the ones most people notice and remember.
Figure 2.4 - Costal bluff retreat, Solana Beach, California, United States of America (Ewing, 2014)
Flick et al., (2012) have defined inundation "as the process of a dry area being permanently drowned or submerged" and it can result from long-term erosion, land subsidence and sea-level rise. In contrast, flooding occurs when "dry areas become wet temporarily - either periodically or episodically" (Flick et al., 2012).
Storm waves can cause flooding and inundation. The time and extent of the flooding will depend of the specific event, bathymetry, overland topography, flooding barriers, and inland structures. If erosion has also occurred, these conditions can exacerbate the flooding impacts, as well as sea-level rise can also exacerbate flooding.
The direct threats from inundation are the permanent wetting of dry land, losses of agricultural lands and conversion of intertidal lands to subtidal. Flooding can temporarily close down many infra-structures, especially if the water remains for more than a few hours.
Wave impacts come during storm events when wave energy is not fully dissipated in offshore breaking and run-up. Wave overtopping phenomenon is another problem that the coastal populations face. It occurs when waves meet a submerged reef of structure, but also when waves meet an emerged reef or structure lower than the approximate wave height.
The origin of wave overtopping is wide and it include: astronomic and meteorological tides; storms (sea ripple); sea-level rise; destruction of dune systems and dredging works. Coastal flooding is usually preceded by overtopping of the defences or barriers. During storms, waves exceed the height of the existing defences and the flow of water hit the infra-structures located on the coast.
It is necessary to analyse the consequences of the phenomenon, regarding the territory losses and its damage on assets, infra-structures and buildings.
Climate change and sea-level rise provide additional motivation for most coastal communities to understand their hazard exposure. Sea-level rise alone will, with certainty, worsen the consequences of storm flooding, wave impacts, and erosion simply by exposing coastal areas more frequently and more extensively to these hazards (Ewing, 2014).
Projections indicate that sea level will continue to rise, possibly rising by an addition of 1.5 to 2 m by 2100 (Figure 2.8).
The main drivers of changing sea level are thermal expansion of existing ocean water and increases in the amount of water in the ocean due to melting of land-based glaciers, ice sheets, and human-caused
changes in groundwater pumping and water storage (Chao et al., 2008, Konikow, 2011, Wada et al., 2010).
Except for the human-caused changes in surface water, the sea level drivers are connected with global temperature that is rising due to increased emissions of carbon dioxide and other greenhouse gases (Ewing, 2014).
The Intergovernmental Panel on Climate Change (IPCC) has become one of the main international forums for discussion of climate and sea-level rise. It has used scenarios to develop likely future climate conditions. Their initial assessments were based upon assumptions of population growth, technological growth and expansion, and resulting greenhouse gas emission scenarios.
The IPCC reports provide likely changes to sea level, along with many other climate aspects, based on three scenarios. Under the most optimistic scenarios for emissions and radiative forcing, sea level rise could slow and stabilize toward the end of the 21st century, but under most scenarios, sea level is expected to continue rising well into the 22nd century.
Figure 2.5 - Various 2100 Global and Regional Sea Level Projections, (California Coastal Commission, Draft Sea Level Rise Guidance)
Future sea-level is uncertain being some of it associated with the models and with ice dynamics, and some uncertainty is associated with future emissions. Research and better science can help reduce some of this uncertainty, but due to human actions, a large uncertainty will remain in future water level projections.
As shown in Figure 2.9, water level is on the basis for inundation, flooding, currents, and wave impacts. Being future water level based on projections, it leads to uncertainties about the future impacts of those hazards.
Figure 2.6 - Trends between Water Levels and Coastal Consequences. Modified by R. Flick and L. Ewing (Ewing, 2014)
Water level uncertainty combines with uncertainties concerning other climatic conditions, including changes in hurricane and tropical storm frequency and intensity, rainfall and flooding events, erosion, waves, El Niño frequency and intensity.
The result is uncertainty in almost everything used as input for long-term coastal engineering design. Engineered structures will continue to be part of the coastal protection, but the uncertainties in future conditions add to the need for resilient coastal protection that can adapt to unanticipated events and recover from events that exceed the design conditions.
2.4.VULNERABILITY
2.4.1.DEFINITION OF TERMS AND RELATED CONCEPTS
Achieving a common terminology of vulnerability and related concepts remains a challenge. It is vastly recognized that terms related with this subject are quite diverse, depending on the author, the study that apply them and context, often leading to multiple definitions, sometimes antagonistic. Many scientists, researchers and practitioners have developed specific terminology for vulnerability and risk assessments. This terminology differs significantly between the various disciplines.
It is not fully intention of this thesis to purpose a new, bright definition of these terms, clarify or to compare different definitions of the current issue. However it is necessary to show some points of view that could differ in specific concerns. One of the most important sources of this kind of subject is the International Organisation for Standardisation (ISO) which has developed some international standard definitions related with this subject.
The sources from ISO are:
ISO 31000: Risk management - Principles and Guidelines; was released in 2009 and provides principles and generic guidelines on risk management. It can be used by any public, private or community enterprise, association, group or individual. It is not specific to any industry or sector; ISO 31010: Risk management - Risk Assessment Techniques; is a supporting standard for ISO 31000 and provides guidance on selection and application of systematic techniques for risk assessment; ISO Guide 73: Risk management – Vocabulary; provides the definitions of generic terms related to risk management.
For a common understanding of the following chapters, risk assessment definition of terms will be used as EU guidelines, Risk Assessment and Mapping Guidelines for Disaster Management, which are listed below:
Hazard - is a dangerous phenomenon, substance, human activity or condition that may cause loss of life, injury or other health impacts, property damage, loss of livelihoods and services, social and economic disruption, or environmental damage.
Exposure - People, property, systems, or other elements present in hazard zones that are thereby subject to potential losses (ISDR, 2009).
Vulnerability - The characteristics and circumstances of a community, system or asset that make it susceptible to the damaging effects of a hazard (ISDR, 2009). In probabilistic/quantitative risk assessments the term vulnerability expresses the part or percentage of Exposure that is likely to be lost due to a certain hazard.
Resilience - The ability of a system, community or society exposed to hazards to resist, absorb, accommodate to and recover from the effects of a hazard in a timely and efficient manner, including through the preservation and restoration of its essential basic structures and functions (ISDR, 2009). Risk - is a combination of the consequences of an event (hazard) and the associated likelihood/probability of its occurrence (ISO, 2009).
Risk assessment - is the overall process of risk identification, risk analysis, and risk evaluation (ISO, 2009).
Risk identification - The process of finding, recognizing and describing risks (ISO, 2009).
Risk analysis - The process to comprehend the nature of risk and to determine the level of risk (ISO, 2009).
Risk evaluation - is the process of comparing the results of risk analysis with risk criteria to determine whether the risk and/or its magnitude is acceptable or tolerable (ISO, 2009).
Risk criteria - The terms of reference against which the significance of a risk is evaluated (ISO, 2009).
Consequences - The negative effects of a disaster expressed in terms of human impacts, economic and environmental impacts, and political/social impacts (ISO, 2009).
Human impacts - Defined as the quantitative measurement of the following factors: number of deaths, number of severely injured or ill people, and number of permanently displaced people.
Economic and environmental impacts - Sum of the costs of cure or healthcare, cost of immediate or longer-term emergency measures, costs of restoration of buildings, public transport systems and
infrastructure, property, cultural heritage, etc., costs of environmental restoration and other environmental costs (or environmental damage), costs of disruption of economic activity, value of insurance pay-outs, indirect costs on the economy, indirect social costs, and other direct and indirect costs, as relevant.
Political and social impacts - Usually rated on a semi-quantitative scale and may include categories such as public outrage and anxiety, encroachment of the territory, violation of the democratic system, and social psychological impact, impact on public order and safety, political implications, psychological implications, and damage to cultural assets, and other factors considered important which cannot be measured in single units, such as certain environmental damage.
Single-risk assessments - determine the singular risk (i.e. likelihood and consequences) of one particular hazard (e.g. flood) or one particular type of hazard (e.g. flooding) occurring in a particular geographic area during a given period of time.
Multi-risk assessments - determine the total risk from several hazards either occurring at the same time or shortly following each other, because they are dependent from one another or because they are caused by the same triggering event or hazard; or merely threatening the same elements at risk (vulnerable/ exposed elements) without chronological coincidence.
Hazard assessments - determine the probability of occurrence of a certain hazard with certain intensity.
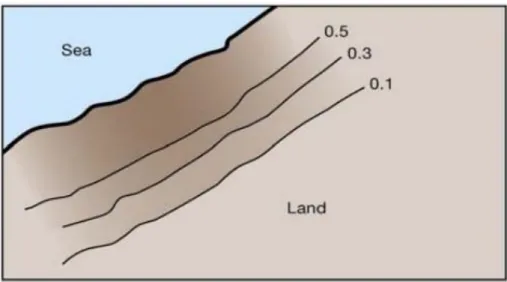
Hazard map - map that portrays levels of probability of a hazard occurring across a geographical area. Such maps can focus on one hazard only or include several types of hazards (multi-hazard map). A single type of hazard map is shown in Figure 2.10, where the lines of equal probability represent the likelihood of loss due to erosion event.
Figure 2.7 - Hazard Map portraying lines of equal probability of losses due to erosion (Halcrow Group, 2007)
Risk map- Map that portrays levels of risk across a geographical area. Such maps can focus on one risk only or include different types of risks.
An example of a risk map of coastal erosion is given on Figure 2.11.
Risk scenario- Representation of one single-risk or multi-risk situation leading to significant impacts, selected for the purpose of assessing in more detail a particular type of risk for which it is representative, or constitutes an informative example or illustration.
Figure 2.8 - Risk map of coastal erosion (Pereira and Coelho, 2013)
2.4.2.VULNERABILITY ON COASTAL ZONES
Vulnerability on coastal zones has also a variety of definitions. In the development of this research, vulnerability is an important feature for an efficient methodology in assessing the potential negative effects on the coastline, due to sea actions.
Vulnerability is defined according to the United Nations International Strategy for Disasters Reduction as the characteristics and circumstances of a community, system or asset that make it susceptible to the damaging effects of a hazard.
There are many aspects of vulnerability, arising from various physical, social, economic, and environmental factors. Examples may include poor design and construction of buildings, inadequate protection of assets, lack of public information and awareness, limited official recognition of risks and preparedness measures, and disregard for wise environmental management. Vulnerability varies significantly within a community and over time. This definition identifies vulnerability as a characteristic of the element of interest (community, system or asset) which is independent of its
exposure. However, the word vulnerability is often used more broadly to include the element‟s exposure.
With regard to coastal areas, analysis of target vulnerability is in relation to the action of sea wave sin particular phenomena resulting from storms that will have a variable impact on both spatial natures, whether temporal .Overtopping, flood and coastal erosion are the most evidence phenomena resulting from sea waves, tides and currents.
There are also several types of vulnerability that coastal areas shall be exposed (Coelho, 2005):
Vulnerability of coastal areas due to spills and discharges of pollutants, as it is a problem for other subjects, namely the chemical assessment of coastal and ocean engineering;
Vulnerability of the coastal zone associated with navigation as it is a problem related with coastal management and planning;
Vulnerability of the coastal areas due to seismic actions;
Vulnerability of the coastal zone due to the exploitation of water resources.
The defence costs in coastal regions around the world are increasing and we need to evaluate and understand the phenomena involved, in order to consider carrying out interventions on the coastline over longer time horizons.
The vulnerability analysis, to a certain range of the coastal zone is a time consuming process and involves the selection of innumerable parameters. It is based on the selection and weighting factors and their evaluation is effected based on the degree of vulnerability they present. It may be necessary to incorporate vulnerability parameters in a hydro-morphological modelling software that enables the coast projections for different time horizons considering different scenarios of natural and anthropogenic actions (Coelho, 2005).
The study of vulnerabilities requires a lot of information and a multi-disciplinary approach that should cover the engineering, environment, socio-economic and political fields (Nicholls, 1998). The first key step to try to reduce the potential for damage is to determine and map the risks.
Other authors, Blaikie et al. (2014) and Smith (2013) have also shown some other ways of describing these concepts. One overall meaning was adopted related with the vulnerability of the coastal zones:
It can be understood as a function of the system's ability to cope with stress and shock; The characteristics of a person or group in terms of their capacity to anticipate, cope with,
resist and recover from the impact of a natural hazard. Synonyms: weakness; susceptibility; defencelessness.
2.4.3.VULNERABILITY PARAMETERS AND INDICATORS
The erosion phenomenon along the coastline as already mentioned, happens mostly due to natural processes and human activities. Among the most important factors contributing to it, stands out the limited transport of sediments to the coast from rivers and frequent flooding. The existence of coastal structures, changes resulting from human intervention in rivers and sand extraction are part of the group of agents that more deplete the natural nourishment to the coastline causing the so much-discussed coastal erosion.
Storm waves, tsunamis and sea level rise may cause permanent flooding that will have a considerable impact on the natural environmental and socio-economic conditions in the coastal zone. Over time,
frequent coastal flooding may change the water quality, the characteristics of the aquifers, loss of life, loss of crops, and loss of tourist assets among others.
Several authors have proposed the assessment of coastal vulnerability, e.g. Gornitz et al. (1997) and Thieler and Hammar-Klose (1999). These authors compiled a set of vulnerability parameters and classified them, most of the cases in five classes. Then, they established according to the observed conditions on the study site, a qualitative degree of vulnerability usually ranked from 1 to 5.
In the following sub-chapters, a selection of the most common parameters used in the coastal vulnerability assessment process is made. They range from simple physiographic conditions of the coastal zones to more complex phenomenon, like local agitation, being necessary the collection of measured data measurement.
It is necessary to point of that some vulnerability parameters may present a given classification that will present effectively more vulnerability to erosion or more vulnerability to overtopping.
2.4.3.1. Topography
The topography is one of the leading and most noticeable features in the vulnerability assessment of coastal areas. Being a parameter whose setting is easy accessible, due to the simplicity of its content, it is added complexity when the desired level of detail is high. Sometimes the consideration of only this parameter may lead to antagonistic concerns when comparing different srudy zones.
Nicholls (1998) defines the practical topography term as the limit obtained by the maximum sea level in a return period of 100 years, added to the expected sea-level rise.
The proposal presented in Table 2.2 was based on the contribution made by Gornitz et al. (1997).
Table 2.2 - Vulnerability classification regarding topographic elevation (Coelho, 2005)
Topographic elevation referred
to the hydrographic zero (m) > 30
>20 > 10 > 5
≤ 5 ≤ 30 ≤ 20 ≤10
Vulnerability
Very low Low Moderated High Very high 1 2 3 4 5
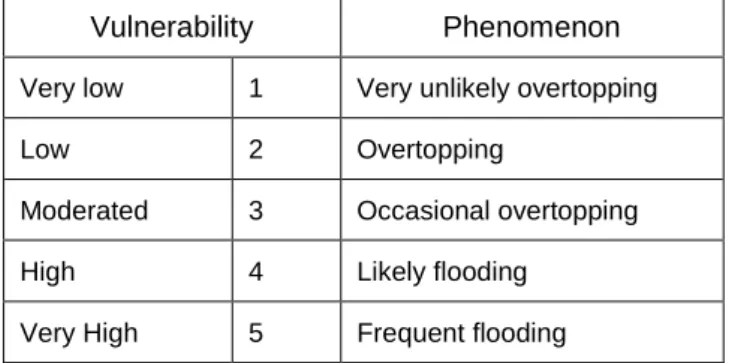
Each rating will give important indications of the possible occurrence of floods, including its periodic character, and adopted the correspondence presented in Table 2.3.
Table 2.3 - Correspondence between the degree of vulnerability and the likely phenomenon (Coelho, 2005)
Vulnerability Phenomenon
Very low 1 Very unlikely overtopping Low 2 Overtopping
Moderated 3 Occasional overtopping High 4 Likely flooding
Taking into account the information collected, topography is a very important aspect in a first approach to a coastal area.
2.4.3.2. Distance to the shoreline
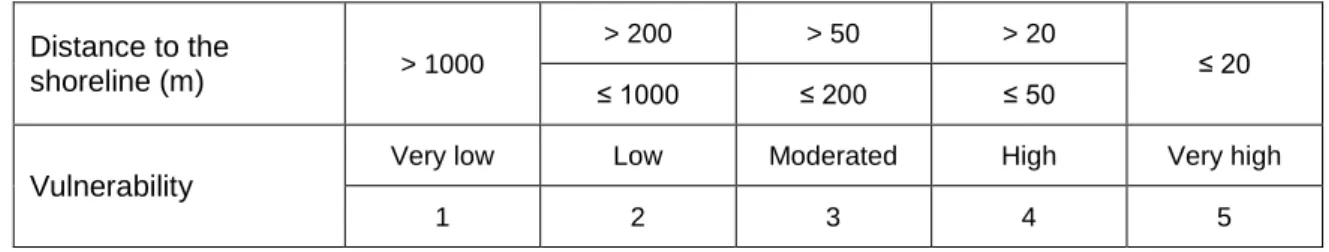
The location of a particular asset facing the coastline, will determine the degree of vulnerability that presents. In fact, the closer a particular asset or infrastructure is the coastline, more vulnerable will be. This parameter is not considered in most of the studies carried out, because the majority of these studies adopts a linear and simplistic approach in relation to the coastal area, assuming a single value of vulnerability index for the entire interior land that corresponds to a specific maritime front, disregarding any variation of topographic and geologic characteristics towards inland (Coelho, 2005). Is a parameter with a subjective character as it does not reflect the right vulnerability of a given infrastructure or asset. A far away building located in a low sandy coast and without protection present a given level of vulnerability, however a close one and in a high rocky coast could not be vulnerable. A vulnerability classification regarding the distance to the shoreline is then presented in Table 2.4. It is consider low vulnerability when distances of assets are higher than 1000 m.
Table 2.4 - Vulnerability classification regarding distance to the shoreline (Coelho, 2005)
Distance to the shoreline (m) > 1000 > 200 > 50 > 20 ≤ 20 ≤ 1000 ≤ 200 ≤ 50 Vulnerability
Very low Low Moderated High Very high
1 2 3 4 5
2.4.3.3. Geology
The geology classification is one of the relevant parameters when characterizing the coast. It is presented through geological maps, whose consultation makes the geological setting of a coastal stretch much more simplified. From these charts it is possible to evaluate the nature of rocks and sediments, enabling the creation of a rating based on the behaviour and scale of its hardness. Table 2.5 refers to a vulnerability classification of the geologic parameter.
Table 2.5 - Vulnerability classification regarding shore geology (Coelho, 2005)
Description Vulnerability
Magmatic rocks (granite, gabbro and basalt) 1 Metamorphic rocks (schist, gneiss and marble) 2 Sedimentary rocks (limestone, sandstone and mudstone) 3 Unconsolidated large sediments 4 Unconsolidated small sediments 5
2.4.3.4. Geomorphology
The geomorphology, particularly of the coastal zone is understood as the branch of geology that studies the shape of the coastal surface.
Geomorphology's assessment is done in an expeditious way, through basic tools such as the human vision or Google Earth tool. This is not a difficult task and doesn't require such advanced knowledge of sciences, namely coastal engineering.
Coelho (2005) suggests a classification (Table 2.6) based on the proposal of Gornitz et al. (1997) about this item as a function of the observed morphological characteristics.
Table 2.6 - Vulnerability classification regarding geomorphology (Coelho, 2005)
Description Vulnerability
Mountains 1
Rocky cliffs 2
Erodible cliffs, sheltered beaches 3 Exposed beaches, plains 4 Dunes, sandbanks and estuaries 5
2.4.3.5. Soil Covering
The vulnerability parameter related to soil covering, does not present a significant importance in relation to other types of parameters, however, highlights the different coastline behaviours depending on the type of soil covering.
The increased coastal waterproofing areas reduce the power of water nourishment from the surface by changing its interface with the seawater level and increasing and concentrating runoff. For example, this action may lead to erosion of the cliffs, to frequent flooding episodes among others.
The degree of vulnerability of a given soil increases according with its degree of change. Natural soil is less vulnerable as the vegetation creates, through their roots, stability and cohesion of the surrounding ground (Coelho, 2005).
Coelho (2005) presents a proposal for a soil covering classification parameter based on what was mentioned above, Table 2.7.
Table 2.7 - Vulnerability classification regarding soil covering (Coelho, 2005)
Description Vulnerability
Forest 1
Underbrush's, cultivated soil, and gardens 2 Uncoated soil 3 Urbanized rural 4 Urbanized and industrial 5
It is considered that this is a factor with less weight on coastal vulnerability, than other parameters referred to. For this reason, it is important to consider these factors carefully and to establish proper weight factors (Coelho, 2005).
2.4.3.6. Tidal Range
The tidal range varies according to the place of study.
The classification presented in Table 2.8, Gornitz et al. (1997) presents a vulnerability classification of this parameter, function of tidal range registered on the coast.
Table 2.8 - Vulnerability classification regarding tidal range (Gornitz et al., 1997)
Tidal range (m) < 1.0
≥ 1.0 ≥2.0 >4.0
> 6.0 <2.0 ≤ 4.0 ≤ 6.0
Vulnerability
Very low Low Moderated High Very high 1 2 3 4 5
2.4.3.7. Significant Wave Height
The significant wave height, commonly referred as Hs, is a concept that reflects the average of the
highest third of cumulative distribution of wave heights. The scheme of incident waves in a certain coastal zone is one of the main indicators of the potential sediment transport. In fact, there is a relationship between the wave height and the verified sediment transport (Coelho, 2005).
The classification of this parameter is highly variable in time and space and may differ considerably for the same area of study, in accordance with the sensitivity of the author. Gornitz et al. (1997) proposed a classification of this vulnerability parameter, likely to be applied on the Portuguese coast, Table 2.9.
Table 2.9 - Vulnerability classification of significant wave height (Gornitz et al., 1997)
Maximum significant wave
height (m) < 3.0
≥ 3.0 ≥ 5.0 ≥ 6.0
≥ 6.9 < 5.0 ≤ 6.0 < 6.9
Vulnerability
Very low Low Moderated High Very high
1 2 3 4 5
2.4.3.8. Accretion and Erosion Rates
The rate of coastal sediment transport is one of the measures most used by scientists and engineers, appearing in planning instruments to predict the future (Dolan et al., 1991).
Accretion/erosion rate represents indicative values of sedimentary dynamics over time. It has as its main objective to quantify a "balance" that aims the knowledge of the coastline evolution resulting from the phenomena that occurred there.
The accuracy of this parameter depends on the accuracy of measurements of the coastline, the temporal variation, the number of points with measurements used on the rate calculation, the temporal proximity between the measurements, the temporal variation of trends, the date of the start of data acquisition and the method used in the calculation of the rate.
The past trends in the evolution of the coastline, the accretion/erosion rates registered in the past, related with possible interventions, are a valuable aid to the attempts of projection of future behaviour.
It is essential to check whether there is any significant variation of these rates, as a result of some intervention performed (Coelho, 2005).
Following, a vulnerability classification related to the accretion/erosion rates proposed for the Portuguese coast (Coelho, 2005).
Table 2.10 - Vulnerability classification regarding accretion/erosion rate (Coelho, 2005)
Accretion/erosion rate (m/year)
> 0 ≥ -1 > -3 ≥ 6.0 ≤ - 5 accretion ≤ 0 ≤ -1 < -3 erosion
Vulnerability
Very low Low Moderated High Very high
1 2 3 4 5
2.4.3.9. Anthropogenic Actions
The importance of studying the consequences of human interventions in the configuration of the coastal zone, has gained more and more attention in the research done in this field of knowledge. It is then, that the engineering interventions should be put together, with others whose potential for mitigation of negative effects are also promising, in order to understand the whole situation of vulnerability.
The human interventions with impacts in the rates of sediment transport in the coastline, such as hydroelectric plants, dredging works, breakwaters and groins, dredging works, urbanization in dynamic areas and the destruction of dune systems, increase the values of coastal erosion, increasing also the level of vulnerability. It is necessary to mitigate these consequences (Veloso-Gomes and Taveira-Pinto, 1997).
The classification of this type of vulnerabilities should be a function of the probability of the potential sediment transport (function of sea waves characteristics) be higher than the volume of sediment available, effect of sediment sources reduction (due to dredging works, hydroelectric power plants, breakwaters and groins). The likelihood of erosion due to human interventions with influence in the behaviour of natural coastal dynamics must include both negative effects of the interventions, but also the defence action of these interventions.
A classification regarding anthropogenic actions is presented in Table 2.11 which considers five degrees of intervention in the area of study (Coelho, 2005).
Table 2.11 - Vulnerability classification regarding anthropogenic actions (Coelho, 2005)
Description Vulnerability
Interventions with shoreline maintenance position structures 1 Interventions with structures, with evidence of sedimentary sources reduction 2 Interventions without structures, but evidence of sedimentary sources reduction 3 Without interventions and without evidence of sedimentary sources reduction 4 Without interventions and evidence of sedimentary sources reduction 5