A Work Project, presented as part of the requirements for the Award of a Master Degree in Management from the NOVA- School of Business and Economics.
Forecasting the Portuguese Car Fleet and Automotive Aftermarket for the future
JOÃO EMANUEL HIPÓLITO DE BORBA MONTEIRO | 22388
A Project carried out on the Master in Management Program, under the supervision of: Professor Carlos Santos
2 Abstract
The automotive aftermarket business could face losses due to the rising trend around Electric transportation. Previous research as shown that the market share for these vehicles can go up to 7.6% in the Portuguese car fleet. In this study, the author uses time series models to forecast the Portuguese car fleet by 2030 and discusses the possible implications in the automotive aftermarket. Results show that under an optimistic scenario, market share for Electric Vehicles can reach 15.5%, however, its impact could be offset by trends in other car segments.
Keywords: Electric, Fleet, Tips4y, Aftermarket
This work used infrastructure and resources funded by Fundação para a Ciência e a Tecnologia (UID/ECO/00124/2013, UID/ECO/00124/2019 and Social Sciences DataLab, Project 22209), POR Lisboa (LISBOA-01-0145-FEDER-007722 and Social Sciences DataLab, Project 22209) and POR Norte (Social Sciences DataLab, Project 22209).
3 1. Introduction
How will the car fleet of the future look like? The answer to this question has gained popularity over the years but it is still filled with uncertainty. Developing on the growing trend towards electrification and the reduction of greenhouse gas emissions, researchers have focussed their attention on the electric vehicle (EV) has a potential solution. However, attempts to forecast the impact of the EV in the automotive market haven’t provided a definitive answer.
Prediction models for 2050 have found that the market share for these vehicles could reach 60% in the US and 23% in Europe (Gnann, et al., 2018). In the former, car fleet forecast for the German market have shown results ranging from 0.4% to 16.8% (Gnann, et al., 2018) whilst in Portugal EV diffusion could reach 7.6% (Silva & Moura, 2012). For now, investment and consumption of EV’s seem to support the most optimistic forecasts. On the production side, the biggest vehicle manufacturers have already set long-term plans on launching hybrid and electric models, even going fully electric. The Japanese vehicle brand Toyota as vowed to reduced carbon output by 2050 and the German owned Mercedes wants half of its vehicle sales to be EVs by 2030 (Hawkins, 2019). However, on the technical side, aftermarket service providers could be left to suffer severe losses caused by the rise of EV’s. Dombrowski & Engel (2019) refer that EV penetration could impact negatively the automotive aftermarket in its three variants, spare parts, accessories and customer service due to characteristics such as the reduced mechanical parts used in the manufacturing of an EV. With new businesses and technologies such as ridesharing and autonomous driving enlarging the group of risks to the automotive aftermarket, possibly reducing the number of cars in the fleet or the maintenance trips to the workshop, it becomes a top priority for players in automotive aftermarket to understand better the future car fleet.
4 Tips4y is one of the businesses that could face harsh changes. It is a solution provider to workshops throughout Portugal, using technology such as Big Data, Machine Learning and Cloud Storage to offer a complete digital transformation to its clients. Mainly, it as ownership of a database of over 8 million registered vehicles in the country and provides a platform where workshops can research license plates, retrieve information about technical data of the vehicle in real time and simulate maintenance costs based on the manufacturers revision plans. Currently, 81% of the companies in the Portuguese top 100 of the automotive aftermarket business are Tips4y clients, having over 10 000 users of its digital solutions (Tips4y, 2019). Thus, if the automotive aftermarket is negatively impacted through car fleet changes, Tips4y business will suffer. It becomes then crucial for their business to have a holistic view of the Portuguese car fleet in the future, allowing them to make decisions in the present that could moderate the possible changes in the automotive aftermarket business. Given that, this paper has the following objectives:
1) Forecast the Portuguese Car fleet until 2030.
2) Discuss the possible implications for the automotive aftermarket.
Hence, this paper will support managerial decisions made by Tips4y, offering an overview of the future car fleet in Portugal and contributing to existent theory on automotive aftermarket strategy and car fleet modelling.
The rest of this paper will have the following structure: firstly, a literature review on car fleet modelling will be presented. Secondly, a methodology section will introduce the modelling methods used to forecast the Portuguese car fleet. Thirdly, an analysis of results shall be performed. The paper will conclude with a discussion on the managerial implications of the forecast computed, followed by recommendations for future research.
5 2. Literature Review
Whether its manufacturers attempting to evaluate demand for their cars, oil companies interested if their products will remain popular, banks seeking to make better investment decisions or governments trying to forecast the impact of policies on tax returns, numerous studies have tried to model car fleets using distinguished approaches (Jong, Fox, Daly, Pieters, & Smit, 2004). Moura (2009) states three broad approaches that are present in current literature: economic approaches, using financial parameters; system dynamics, causality driven; and engineering approaches, focused on empirical analysis. Examples such as the Ingram & Liu (1997) aggregate time series model to forecast road traffic in the UK using a logistic saturation curve, which economic rationale is given by product life cycle and diffusion theories, or the FACTS model, an heuristic simulation model used to forecast energy use and emissions and the total number of vehicles in the Netherlands, emphasize the different viewpoints applied to vehicle modelling (Jong et. al, 2004).
Based on the literature review of existing car ownership models of Jong et al. (2002, 2004), Moura (2009) distinguishes nine different types of model present in literature: aggregate time series, aggregate cohort, aggregate car market models, heuristic simulation models, static disaggregate car ownership models, indirect utility car ownership and use models, static disaggregate car-type choice models, pseudo-panel methods and dynamic car transaction models with vehicle type conditional on transaction. The author then uses a combined approach of aggregate time series and a static disaggregate car-type choice model to forecast the Portuguese car fleet. A time series model is a model that studies past observations to understand the future (Adhikari & Agrawal, 2013). In this case, an aggregate time series model is used to predict the car fleet overtime, having the particularity of assuming an S-shape curve and a saturation point. On the other hand, static disaggregate car type choice models include discrete choice models that investigate household preferences in car ownership (Silva & Moura, 2012),
6 using tools such as stated choice surveys (see Mabit & Fosgreau, 2011; Beggs, Cardell, & Hausman, 1981). However, given its focus on Car Organ Transplant (COT), the partly renewal of cars to cleaner technologies instead of total car fleet change, the author does not use EV’s in its choice set, which nowadays have a higher relevance in the car fleet and need to be included in forecasting the Portuguese car fleet. Given this, a more relevant work is done by the same author in Silva & Moura (2012), with a paper which follows a similar model but includes EV’s in the choice set. Accessing a combination of transport policies, consumer choice and economic variables, the authors estimate that the diffusion of EVs in the Portuguese market will reach 7.6% in 2030. Their findings show that despite increasing environmental concerns, the solution to reduce greenhouse gas emissions will be hybrid cars, which will take a 60% market share. Internationally, predictions regarding the car fleet of the future vary significantly between models, which have a general focus on accessing the impact of EV’s. Gnann et. al (2018) reviews the literature on market diffusion papers for plug-in electric vehicles (PEV’s). Comparing the findings of 40 different model projections, the authors denotes a high variance in results. Propfe, Kreyenberg, Wind, & Schmid (2013) forecast a market share of 0.4% for the German car fleet by 2020, stating that in PEV’s success in the market is heavily dependent on external conditions, such as reduction of energy prices or purchase incentives. On the other hand, Eggers & Eggers (2011) find that a timely combination of crucial factors such as price, range and market entry could lead the EV to a market share of 16.8% in the same period. The same uncertainty is shared on a global scale, with predictions for 2050 going as high as 60% for the US market and 23% for the European market (Liu & Lin, 2017; Pasaoglu, et al., 2016). The differences between the models observed lie in the assumptions on external factors and variable factors such as energy prices and vehicle attributes, which vary significantly, especially when in presence of country specific factors. For example, Gnann et al. (2018) notes that in Kihm & Trommer (2014), predictions for the diffusion of PEV’s reach 60.8%, against only
7 0.56% of battery electric vehicles (BEV’s), which could derive from the fact that in Germany company cars are driven irregularly and, hence, are unfeasible for BEV’s diffusion. Given that, the authors see these models more as a bridge to understand the possible influences of PEV’s, rather than a clear prediction of a market share.
The model developed in this paper will follow an engineering approach, understanding the future based solely on empirical data and creating a time series model to predict the Portuguese car fleet. For this purpose, a combination of ARIMA (Auto Regressive Integrated Moving Average) and a Holt-Brown model was found suitable. Amini, Karabasoglu, Ilic, Boroojeni, & Iyengaral (2015) use an ARIMA model to forecast mid-term demand for EVs in a probabilistic model for demand of electric charging in parking lots. In this work, they present a new method to optimize forecasts based on minimizing the relative absolute error. Further research by the same authors, this time on power stations, leads to the use of a three-step framework ARIMA model to forecast EV demand, including day-ahead forecasting and minimizing mean-square errors. (Amini, Kargarian, & Karabasoglu, 2016). On the other hand, the Holt model has had scarce applications in car fleet modelling, however, Fleurke (2017) uses the Holt-Winters variant when comparing forecasting methologies for car demand in the Netherlands and the USA.
3. Methodology
To forecast the Portuguese car fleet in 2030, relevant data was gathered from the automotive industry and a time series model was developed using three main components: segmentation, market entry and market exit. Consequently, to understand the concepts of car fleet modelling, time series models and the automotive aftermarket, relevant literature (e.g. Jong et. al, 2004; Moura, 2009; Silva & Moura, 2012; Gnann et al., 2018, Adhikari, 2013; Dombrowski, 2019) was found through electronic searches using Google Scholar as the main online source and
8 searching for key words such as “Car fleet Modelling”, “Forecasting the Automotive Market”, “Time Series Models” and “Automotive Aftermarket”.
The first step of this research had the goal of segmenting the car fleet. Traditional projections often analyse the car fleet by age interval or fuel type, whilst some PEV diffusion models have used vehicle size or make as a differentiation factor (Gnann et al., 2018). As aforementioned, one of the biggest impacts for workshops in the future could be the reduction of parts and, hence, maintenance needs and costs (Dombrowski & Engel, 2014). Thus, to segment the Portuguese car fleet in an automotive aftermarket perspective, an analysis was made on maintenance costs. Tips4y as access to a database of all registered vehicles in Portugal in which vehicle data is aggregated. This data contains vehicle attributes such as make, model, build year or cubic capacity. On the other hand, maintenance data is present in Tips4y online platform Vehicle Running Costs (VRC), where clients can research their car plates and, given an input of kilometres, receive a simulation budget for their maintenance. This simulation is computed given the maintenance activities scheduled by car manufacturers. However, it is not retrievable through a database and only present in HTML form on the platforms website. Given this, a web content mining tool was programmed using Python to retrieve the information. Web content mining is the process of extracting information from the contents of a webpage using text mining techniques (Sharma & Kedia, 2019). The program was set up to log in the platform’s website, insert a license plate in the first page of the website, choose automatically the maintenance revision option, input the car kilometres and finally reach the budget page, where it retrieves from the underlying HTML text the maintenance cost.
Accordingly, a sample of 990 unique license plates was received from Tips4y containing the following vehicle attributes: category (e.g. Light duty), type (Passenger or Commercial), make, model, build year, cubic capacity, power, gross weight, number of doors, body style (e.g. Hatchback, SUV), gearbox (e.g. Manual, Automatic) and number of seats. The program was
9 then run for each of them but with a particularity, maintenance costs are dependent on the kilometres of a car and that information is not available in the company’s database, therefore, different costs had to be retrieved by changing the kilometres input. By researching the technical data for several brands, also available in the platform, it was observed that manufacturers often schedule maintenances every 30 000 kilometres, thus, to have a holistic view of the maintenance costs throughout the lifetime of a car, the program was run for every set of 30 000 kilometres until reaching the 210 000 kilometre mark.
After gathering information for every license plate and removing invalid observations, 626 were left. Subsequently, an analysis on what variables influence maintenance costs was completed using a decision tree, a method that is often used for decision making given its simplicity of interpretation (Aluja-Banet & Nafria, 1996). Hence, using the advanced statistical analysis software SPSS, a decision tree using the CHAID growth method was run with the dependent variable being the average cost, based on each kilometrage, and the independent variables being the vehicle attributes. CHAID allows for multi-way splits, with the algorithm splitting the data every time there is a statistically significant difference between groups, segmenting the data automatically. Several Trees were created and compared, changing growth limits, significance level for splits and validation methods. In every case, a balance as to be done between simplicity of interpretation and overall significance of the model. In order to favour interpretation and relevance for the aftermarket business, insights from Tips4y helped choosing the right Tree. The final Tree led to the construction of 7 segments to be used in both market entry and exit. Yet, as will be seen in the “Analysis of Results” section, an 8th segment had to be added for EVs. The segmenting process concluded with a data set built with Tips4y registry database, containing 7 365 570 observations aggregated by segment, including vehicle attributes, for each registry year, that is, the year a car enters the car fleet.
10 The second component of the time series model is market entry. To predict the number of new cars entering in circulation until 2030, the VAR (Vector Autoregression) model was initially chosen. This model can capture the possible causalities that might occur between segments, for example, an increasing number of EV’s leading to the decrease in market entry of other types of cars. Furthermore, these causalities are expected from the standpoint of market saturation, as it is expected that aggregate entries in the market stabilize with time, hence leading to a
trade-off between segments. In the VAR model, a vector of time series variables is regressed on the
lagged (past) vectors of those variables, meaning that all past observations are used as regressors (Stock & Watson, 2014). Hence, the model was applied based on each segment’s market entry, where entry would be computed with an equation including input from the lagged values of remaining segments. An example can be observed in equation 1.1 where segment 8, EV’s, is being calculated through VAR modelling.
(3.1) Segment8 = β1 * Segment1 + β2 * Segment2 (…) + β7 * Segment7 + Error
Subsequently, the model was computed using Stata 16. To apply the model properly, the series had to be tested for stationarity, as it is one of the VAR assumptions. In most cases, if a series is non-stationary, differencing must be applied depending or not if it will lead to over differencing, which affects the significance of the model. Differencing stabilizes the mean of a time series, removing tend and seasonality (Kwiatkowski, Philips, Schmidt, & Shin, 1992). A Dickey-Fuller test for stationarity was therefore ran and the proper differencing factors selected for each series. Moreover, a lag order preestimation analysis determined that the model would predict based on previous year values (lag(1)). Interestingly, as can be seen in the section “Analysis of Results”, albeit the VAR model seem fitting for predicting market entry in the car fleet, forecast results were not as expected.
11 Other versions of the VAR model were attempted, however, the relevancy of results did not improve. As the VAR model is an extension of univariate autoregression, a simpler approach was deployed to forecast the Portuguese car fleet in 2030 in the form of an ARIMA model. This model predicts future values based on a linear equation that comprises of the series own lags or lags of the forecast errors (Nau, 2019). Either one is chosen by changing the auto regression (past lags) and moving average (lags of the forecast errors) parameters of the model, commonly denoted by p and q, respectively. The same notion of stationarity as the VAR model applies, so differenced series were used when relevant. Furthermore, analysis of sequence, autocorrelation and partial autocorrelation charts provided conclusions on the ARIMA parameters to choose, concretely, the number input on the autoregression (p), differencing (d) and moving average (q) parameters. This time, the model proved valid for most segments, with statistically significant ARIMAs providing reasonable estimates. The results are further discussed in the section “Analysis of Results”. However, for the EV segment, the plotted forecasted estimates show an exponential trend until 2030 (Figure 2 – Analysis of Results). Whereas in recent years EVs have had a large increase in market entry, the result challenges the notion of product life cycle theory that states that a product will reach a peak in demand before eventually declining. Therefore, estimates leading to a steady state could increase forecasting quality. To test this premise an attempt was made to develop a Bass diffusion model which assumes that a product’s demand will follow an S-shaped curve, with the market reaching a saturation point. Zuhaimy & Abu (2013) apply the model to predict car sales in Malaysia, showing that based in the Bass model future sales values can be computed based on a linear equation, resulting from regressing sales values on the cumulative sales in the previous year (t-1) and the same value squared. Nevertheless, in the “Analysis of Results” section it is shown that the prediction made by the model was far from being realistic.
12
Therefore, a simpler approach was taken, this time in the form of a Holt-Brown linear exponential smoothing model. Also known as double exponential smoothing, it uses two parameters to smooth the data, one for overall smoothing and another for tend smoothing (Swamidass, 2000). The estimates produced, shown in “Analysis of results”, are more conservative then the ARIMA model, as the forecast follows a linear pattern, rather than exponential one. Yet, as to capture possible scenarios that might occur in the future, two scenarios were made, a “Bold” scenario, and a “Conservative” scenario, where both the ARIMA and the Holt-Brown model are considered for forecasting EVs in the 2030 car fleet.
Thirdly, a measure of market exit was necessary to obtain the full car fleet for the future. Since Tips4y’s database only provided market entry data, it was necessary to contact ACAP (Associação do Comércio Automóvel de Portugal) and request a data set with vehicle scratch offs per car age and per year. The data provided contained in total 749 753 scratch offs spread over the period of 2007 until 2018. Even though this data relates to ACAP’s partner ValorCar, which handles the scratch off program “End of life vehicles” (Veículos em Fim de vida), that is, vehicles that for reasons such as mal function or bad condition are no longer suited for driving, it was assumed that the data was relevant for market exit. In fact, the same source is used by Silva & Moura (2012) when modelling the Portuguese car fleet. Afterwards, a scratch off probability could be calculated for each car age every year from 2007 to 2018. Since the market entry data has values since 1990 and the objective of this paper is to forecast the car fleet until 2030, that probability had to be assumed for the years where it was missing. Therefore, to calculate scratch off values for the period 1990-2006, the probability was assumed to be constant and equal to the values of 2007. On the other hand, future values were calculated using the most recent probability, that is, the one of 2018. Total values for scratch offs at year t were calculated though equation 3.3.
13
(3.3) Scratch Off (t) = [Market Entry (0) – Cumulative Scratch Off(t-1)]* Scratch Off Prob. (n)
Following this, market entry and exit were compounded each year, outputting the total quantity of cars, with the sum of individual segments returning the total car fleet until 2030. Moreover, it was possible to estimate the expected business volume for the automotive aftermarket. Using backwards induction, the Decision Tree segmentation was used to retrieve the estimated average cost over the lifetime of a car. However, since EVs are not present in Tree, an assumption was made on costs for these types of car, concretely, based on the work of Propfe, Redelbach, Santini, & Friedrich (2012), they were considered to have 50% less maintenance costs than conventional internal combustion cars. Since the cars described can be of two types, Diesel or Gasoline, an average cost was made between them given the Decision Tree output and based on the split with most observations.
4. Analysis of Results
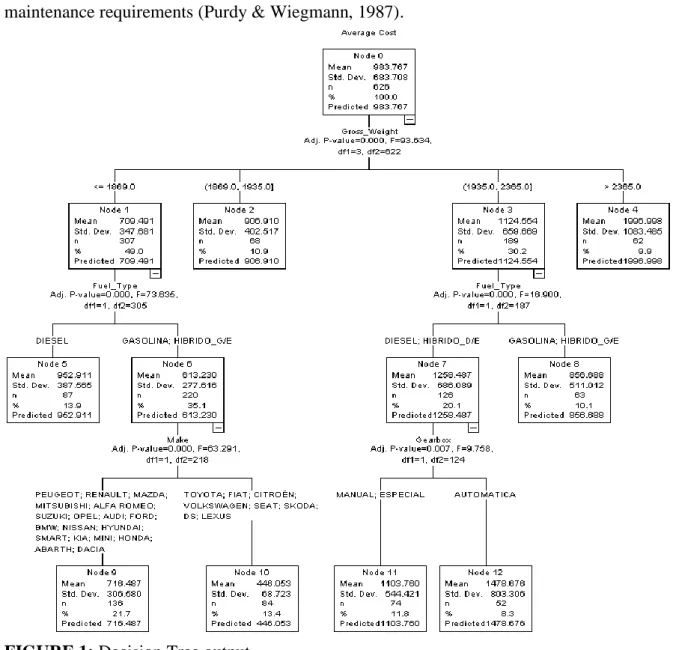
The segmentation process resulted in the Decision tree output in Figure 1, seen below. Observing the results, one can see that the algorithm has found significant splits of the data for the variables weight, fuel type, make and gearbox.
Hence, the first split of tree denotes that splitting the data by weight is relevant, creating four separate groups. Car weight will depend on its model and make, however, based on the data set cars under 1869 kg are mostly light-duty cars such as hatchbacks. Secondly, with weight between 1869 to 1935 kg, the common cars are larger hatchbacks and minivans. In the third interval, 1935 to 2365 kg, frequent car body styles are vans and SUVs and in the fourth interval, above 2365 kg, most cars are commercial vans and some SUV and minivan models. This way, the first split exhibits that the higher the weight of a car, the higher its maintenance costs will be. This not only goes in the line with literature, where cars are frequently differentiated by size
14 (Gnann et al., 2018), but is also expected, as cars with larger weight typically have greater maintenance requirements (Purdy & Wiegmann, 1987).
FIGURE 1: Decision Tree output.
Furthermore, there are two weight groups for which statistically significance differences were found. For weight below 1869 kg, the data is further split by Diesel, more expensive, and Gasoline or Gasoline Electric hybrids, less expensive. The same split happens in the group containing vehicles with weight between 1935 to 2365 kg, with the only difference being the inclusion of Diesel Electric hybrids in the Diesel group. Some evidence for this difference is found in the study of total cost of vehicle ownership made by Palmer, Tate, Wadud, & Nellthorp (2018).
15 Another separation is made for gasoline cars weighting below 1869 kg, this time given different makes. For this group, manufacturers such as Toyota, Fiat and Seat appear to have lower maintenance costs than Peugeot, Renault and Honda. Here, it can be observed that the split is binary even when brands like Audi or BMW are present, for which we could expect a higher cost, given their upper tier proposition. Another interesting fact is that Dacia, a second tier make from Renault, is put in the same group as its parent company, emphasizing that the market placement of a certain manufacturer might not affect maintenance costs the same way it does price.
Finally, diesel cars in the weight group 1935 to 2365 are found to have a significant split in terms of Gearbox, where manual is shown to be less expensive than automatic. This could relate to the former usually being more complex, and hence, more costly (Mogre, 2012).
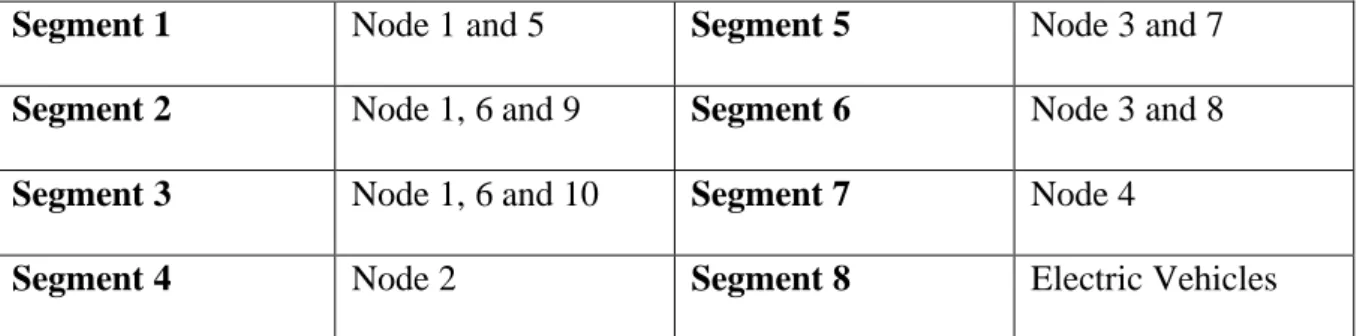
After analysing de Decision Tree output, the underlying data and discussing the results with Tips4y, 8 unique segments were identified. Those segments are shown in Table 1 based on each node of the decision tree seen in Figure 1.
Segment 1 Node 1 and 5 Segment 5 Node 3 and 7
Segment 2 Node 1, 6 and 9 Segment 6 Node 3 and 8
Segment 3 Node 1, 6 and 10 Segment 7 Node 4
Segment 4 Node 2 Segment 8 Electric Vehicles
*Nodes 11 and 12 not included due to exclusion of significant observations of Node 8. TABLE 1: Car fleet segments by Decision Tree node
Notably, an additional 8th segment was added in the segmentation process comprised of only EVs. That is due to the possibility that these cars were under sampled as the data set provided by the company is built based on market share (currently 1% for EVs). Moreover, researchers
16 have found that EVs have less maintenance costs than cars moved by diesel or gasoline (Palmer et al., 2018), having less components (Dombrowski & Engel, 2014).
Thereafter, market entry was forecasted using VAR modelling. The model computes an equation for each segment based on the causality with other segments, which can be found statistically significant or not. However, it is important to understand whether the estimates produced are reasonable. On this note, although only equations for segment 1 and 5 were found not statistically significant (p-value above 0.05), estimates were unreasonable. For instance, segment 2, which showed significance, predicted an estimated 10 000 entries for 2019 whereas in 2018 that value amounts to 71 117. This sporadic movement could be observed for every segment, with estimates shifting extremely year by year. One of the reasons for the failure of such estimates could be that causality is not actually present between segments, thus, a Granger causality Wald test was performed. Only some causalities were found significant, however, given the unreasonable estimates, the VAR with lag 1 was rejected as good fit for market entry. This way, another method was applied using ARIMA(p,d,q) modelling. The Dickey-Fuller stationarity tests were run and segments 1, 5, 7 and 8 rejected the null hypothesis for non-stationarity in one of the three variants of the test ran. Hence, no decision could made on stationarity for these segments and separate levels of differencing had to be compared. For some segments, no differencing was applied. The model’s chosen as well as their statistics are displayed below in Table 2. Besides the one for segment 8, all models have at least one auto regressive (AR) component. In most cases, the best model found is an AR(1) type model, which results in estimates that are based on the series previous lag. Exceptionally, the ARIMA for segment 1 includes two AR parameters, meaning that, besides the noise factor of the model, the prediction for year T relates to observations in T-1 and T-2.
17 TABLE 2: Summary of ARIMA model results.
The AR parameters are significant in every model for a 95% level of confidence (p-value below 0.05). Only segment 8 does not include an AR parameter, therefore it’s p-value is not displayed. Nevertheless, the constant in the ARIMA(0,3,0) showcased a non-significant p-value of 0.329. In explaining the variation in the series, each model presents an r-squared above 50%, although some do better than others, such as the ARIMA for segment 8 and segment 2. Overall, the models perform well in the Ljung-Box test, which tests whether the error is random or there could be a lack of fit. In this component, the ARIMA for segment 3 did not yield a positive result. Although this could undermine the relevancy of the model, an examination of the forecasted estimates showcases a reasonable result. Moreover, the r squared is one of the highest, thus, the model was still considered a good predictor.
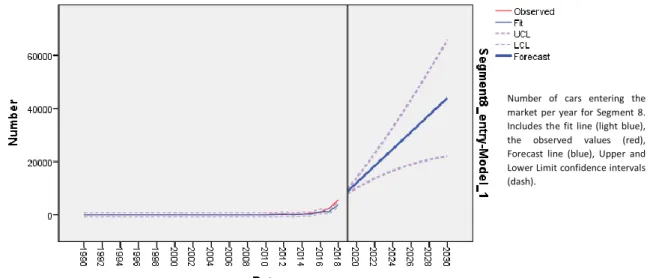
Altogether, ARIMA modelling provided reasonable estimates, hence, it was accepted as a good fit for forecasting market entry. Yet, the ARIMA computed for segment 8, EVs, presented some issues. In terms of forecast, figure 2, displayed below, shows a graphic of the forecast line, as well as fit line and respective upper and lower confidence level limits.
Segments Model R-squared Ljung-Box AR P-value
Segment 1 ARIMA (2,2,0) 0.505 0.379 Both <0.05
Segment 2 ARIMA (1,1,0) 0.869 0.684 0.027 Segment 3 ARIMA (1,0,0) 0.821 0.021 0.000 Segment 4 ARIMA (1,2,0) 0.747 0.512 0.04 Segment 5 ARIMA (1,0,0) 0.586 0.255 0.000 Segment 6 ARIMA (1,1,0) 0.826 0.295 0.000 Segment 7 ARIMA (1,0,0) 0.585 0.238 0.000 Segment 8 ARIMA (0,3,0) 0.898 0.901 -
18 FIGURE 2: Plot of ARIMA model for segment 8.
The growth of market entry is exponencial, with EV’s growing from 5182 in 2018 to 203 800 in 2030, that is, a growth of almost 2000 percentual points. Eventhough the segment is associated with high growth rates for the future, this estimate could be unreasonable for a forecast period with 11 years, given product life cycle theory. Given that, a bid to implement a Bass Diffusion model was made. The regression performed resulted in equation 4.1:
(4.1) Entry (t) = 0.817+0.736*Cumulative Entry(t-1) + 0.00008858*[Cumulative Entry(t-1)] ²
Nonetheless, estimation results were unrealistic. For the equation to be plotted as an S-shaped curve, as is expected in product life cycle theory, the coefficient for its squared variable must be negative, in this case, although close to 0, the coefficient for the variable Cumulative Entry(t-1) squared is positive. This is likely due to the exponential growth observed in the data for the EV segment being regressed. Thus, the estimates rise dramatically over time and the Bass diffusion model as to be rejected as the appropriate model for the EV segment.
On the other hand, an Holt-Brown linear exponencial smoothing model provided more prudent estimates, as is shown in Figure 3.
Number of cars entering the market per year for Segment 8. Includes the fit line (light blue), the observed values (red), Forecast line (blue), Upper and Lower Limit confidence intervals (dash).
19 0 200000 400000 600000 800000 1000000 1200000 1400000 1990 1992 1994 1996 1998 2000 2002 2004 2006 2008 2010 2012 2014 2016 2018 2020 2022 2024 2026 2028 2030 N u m b e r o f C ars Years
Conservative Scenario: Market Entry and Exit
Aggregate Market Entry Aggregate Scratch Off Upper Confidence limit
FIGURE 3: Plot of Holt-Brown exponential smoothing model for segment 8.
The model computed has an r-squared of 86.3%, with its parameters being statistically significant and the Ljung-Box test rejecting lack of fit. In terms of market entry for 2030, the value of the estimate is 43 994, considerably lower than the ARIMA estimate. Similarly to the latter, the forecast line does not reach a saturation point, nevertheless, the diffusion happens in a much slower fashion. Hence, the car fleet will be analysed with the Holt-Brown model forecasting EVs. Still, in order to fully understand the possible impact of EVs in the market, two scenarios are compared, a “Conservative” scenario that uses the Holt model and a “Bold” scenario that uses the Arima model discussed above. The combination between the ARIMAs for segments 1 to 7 plus the Holt-Brown model for segment 8 ouputs the aggregated market entry and total scratch off lines in figure 4.
FIGURE 4: Aggregated Market Entry and Exit in the Conservative scenario.
Number of cars entering the market per year for Segment 8. Includes the fit line (light blue), the observed values (red), Forecast line (blue), Upper and Lower Limit confidence intervals (dash).
20 0 500000 1000000 1500000 2000000 2018 2030 N u m b er o f C ars E n te ri n g th e M arke t Yearly Comparison 2018 v 2030
Conservative Scenario: Car Fleet by Segment
Segment 1 Segment 2 Segment 3 Segment 4 Segment 5 Segment 6 Segment 7 Segment 8
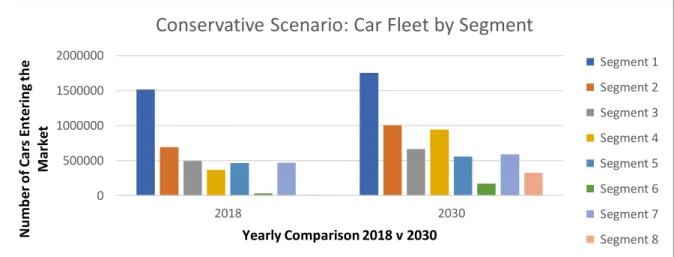
In aggregate, cars entering the market grow until 2020, following the trend of recent years, and then stabilize. In fact, after 2020, market entry in the car fleet rises slowly until 2030, at an average 1% growth per year. The plotted forecast counteracts the sporadic pattern observed in the historical data. This result could be explained with the model not assuming exogenous events that might affect the car fleet in Portugal. For example, the drop in car entries in the period from 2010 to 2014 might exist due to the economic crisis that affected the country. Nevertheless, excluding exogenous events, it is sensical that aggregate entries do not change abruptly from year to year. Furthermore, the scratch off line describes a curve over time that declines until 2027 before becoming almost constant. This decline relates to the increase in car entries in the 2020s, where cars start to have a longer life span. For instance, the scratch off probability for a car with 12 years was of 5% in 2010 whilst that value drops to 1% in 2018. Thus, after 2030, it is expected that the total scratch off value will rise again. Finally, with these values for market entry and exit, the total car fleet amounts to 6 million cars by 2030.
For the individual segments, one can observe in figure 5 that segment 4, comprised of cars with weight between 1869 and 1935 kg (commonly larger hatchbacks and SUVs), gains a large share of the market when compared to 2018, becoming the third biggest car segment. Moreover, the EV market share in this conservative scenario rises around 4%, with the later representing 5.4% of the car fleet.
21 0 500000 1000000 1500000 2000000 2018 2030 N u m b e r o f C ars E n te ri n g th e M ark et Yearly Comparison 2018 v 2030
Bold Scenario: Car Fleet by Segment
Segment 1 Segment 2 Segment 3 Segment 4 Segment 5 Segment 6 Segment 7 Segment 8 0 200000 400000 600000 800000 1000000 1200000 1400000 1600000 1990 1992 1994 1996 1998 2000 2002 2004 2006 2008 2010 2012 2014 2016 2018 2020 2022 2024 2026 2028 2030 N u m b er o f C ars Years
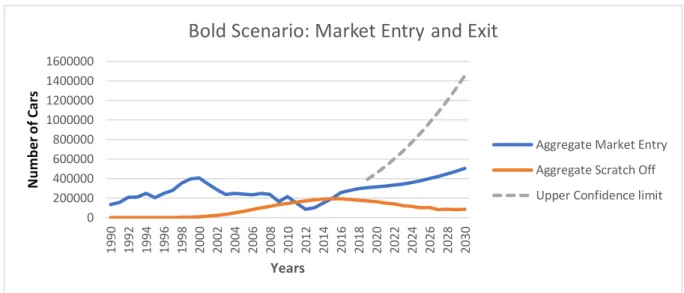
Bold Scenario: Market Entry and Exit
Aggregate Market Entry Aggregate Scratch Off Upper Confidence limit
On the other hand, the Bold scenario uses the ARIMA model to predict EV entries in the market, resulting in an exponential growth that affects the overall growth of the car fleet.
FIGURE 6: Aggregated Market Entry and Exit in the Bold scenario.
Figure 6 depicts the impact of this assumption in the former. Opposite from the steady growth presented in the “Conservative” scenario, in the “Bold” scenario the effect of the exponential growth of segment 8, EVs, is clear in the way the market entry line rises at a fast rate into the future. Given this, the car fleet total is also higher, with 6.7 million vehicles in 2030. To what concerns segment entry, the same values are obtained for the other segments, as the models used remained the same, but now the market share of EV’s is significantly higher, as is shown in Figure 7. In this scenario, EVs representation in the market reaches 15,5%, almost three times as more than in the “Conservative” scenario.
22 5. Managerial Implications
Having forecasted the Portuguese car fleet for 2030, the second of objective of this paper is to discuss the impact of the changes observed in the automotive aftermarket. Employing backwards induction on the Decision Tree created, it is possible to understand the potential of the aftermarket business (maintenance wise) for both the “Conservative” and the “Bold” scenarios. Overall, the aftermarket business volume grows between 2018 and 2030, with the growth in market entry observed for segment 4 and 6 alone generating around 142 million euros more for workshops. Apart from that, segment 1 suffers a slight drop in worth for the aftermarket business of around 20 million euros. Summing all segments, the total business volume for the maintenance business amounts to 850 million euros.
Comparing both our scenarios for the future, there is a significant difference brought by the assumptions on EVs. On the one hand, under the “Conservative” scenario, the potential business volume in Portugal by 2030 is 1 billion euros, with EVs contributing with 50 million euros worth of business. On the other, under the “Bold” scenario those values are 1.3 billion euros for the aftermarket business and around 230 million for EVs. This means that the most optimistic prediction for EV diffusion would create more 180 million worth of business for the automotive aftermarket than the prudent one. This growth, if it were to materialize, could have critical consequences for this industry. The reason being that the EV uses only half of the parts of a conventional fuel type of car and is incredibly efficient, so to that the maintenance cost over the lifetime of the car could decrease significantly (Dombrowski & Engel, 2014). Even though the model proposed tries to capture this effect, the use of the ARIMA model ends up creating a “not as bad” forecast where by 2030, the automotive aftermarket has increased its value at least 200 million in the “Conservative” scenario. However, this is also influenced by the growth of other segments. Without being the focus of researchers, the trend of segment 4, large hatchbacks and SUVs, is relevant for the future aftermarket business. The segment on its
23 own rises by 110 million euros over the course of 11 years, corresponding to the largest increase after EVs. Given the weight of its vehicles and their needs for parts, its impact could offset the one of EVs in the long run. Nevertheless, the car fleet is expected to reach a steady state, where trade-offs between segments will occur. Given that, one would expect that the “Bold” scenario would be concerning for managers in the industry, as the EV could capture a large market share of the Portuguese car fleet, reducing business volume for workshops.
6. Limitations and Recommendations for Future research
Despite the results obtained in forecasting the Portuguese car fleet, there are limitations that need to be addressed as well as suggestions for future research.
The failure to achieve good estimates with more complex VAR and Bass Diffusion models might have overlooked causalities and trade-offs between car fleet segments. The ARIMA model predicts a steady growth of the car fleet but at a certain point in time that fleet should saturate. Thus, further studies on the subject should seek to understand these relationships. Furthermore, the forecasts made included solely historical data from the Portuguese car fleet, however, the patterns observed depict trends that could have cause in exogenous effects. Hence, future research could retrieve empirical data from varied time series, such as GDP, and include exogenous variables in forecasting models.
Additionally, the data collected for the Decision Tree process was short in observations for EVs, leading to the use of assumptions to estimate the maintenance cost for these vehicles. Including more observations could lead to more significant splits of the data to be made. Moreover, making use of the average maintenance cost as the dependent variable for car fleet limits segmentation. Other variables like labour cost could also showcase relevant splits for the aftermarket business. Hence, future venues could find new methods to segment the car fleet.
24 More, the data for scratch off missed values for year before 2007 and did not include the whole of the scratch off business. This data could be extended to better determine scratch off probabilities for past years.
To conclude, a deeper understanding of the impact of the forecasts could be obtained jointly with Tips4y. Due to time constraints from both sides, it was not possible to obtain final insights from the company. Nevertheless, it would be interesting if future studies included the outcome of their research in managerial action.
7. Conclusion
This paper used time series modelling to forecast the Portuguese car fleet by 2030 and understand how its composition would affect the aftermarket business. Pursuing these goals, it contributed to existing literature in car fleet modelling by applying a unique segmentation process to the Portuguese car fleet and testing different forecasting models. It showed that, given certain circumstances, EVs gain a significant share of the market and reduce business volume for workshops, although that impact could be absorbed mainly through the growth of a segment composed of larger hatchbacks and SUVs. Moreover, it contributed to managerial action on the aftermarket business by accessing the variance in business volume resulting from changes in car fleet composition. Finally, it encourages further researchers to apply forecasting models that account for product life cycle theory and to follow up on the impact of the study on managerial decisions made by companies in the automotive aftermarket business.
References
Adhikari, R., & Agrawal, R. (2013). An Introductory Study on Times Series Modeling and Forecasting. Saarbrucken: LAP LAMBERT Academic Publishing.
Aluja-Banet, T., & Nafria, E. (1996). Automatic Segmentation by Decision Trees. COMPSTAT (pp. 181-186). Barcelona: Physica-Verlag HD.
Amini, M., Karabasoglu, O., Ilic, M., Boroojeni, K., & Iyengar, S. (2015). ARIMA-based Demand Forecasting Method Considering Probabilistic Model of Electric Vehicles’ Parking Lots. IEEE PES General Meeting. Denver: IEEE.
25 Amini, M., Kargarian, A., & Karabasoglu, O. (2016). ARIMA-based decoupled time series forecasting of electric vehicle charging demand for stochastic power system operation. Electric Power Systems Research 140, 378-390.
Beggs, S., Cardell, S., & Hausman, J. (1981). Assessing the potential demand for electric cars. Journal of Econometrics 17(1), 1-19.
Chen, D. (2011). Chinese automobile demand prediction based on ARIMA model. 4th International Conference on Biomedical Engineering and Informatics (pp. 2197-2201). Shanghai: IEEE.
Dombrowski, U., & Engel, C. (2014). Impact of Electric Mobility on the after Sales Service in the Automotive Industry. Procedia CIRP 16, 152-167.
Eggers, F., & Eggers, F. (2011). Where have all the flowers gone? Forecasting green trends in the automobile industry with a choice-based conjoint adoption model. Technological
Forecasting and Social Change 78(1), 51-62.
Gnann, T., Stephens, T., Zhenhong, L., Plötz, P., Liu, C., & Brokate, J. (2018). What drives the market for plug-in electric vehicles? - A review of international PEV market diffusion models. Renewable and Sustainable Energy Reviews 93, 158-164.
Hawkins, A. (2019, October 16). Volvo unveils its first fully electric car - and a bold pledge to do carbon neutral . Retrieved from The Verge:
https://www.theverge.com/2019/10/16/20915841/volvo-xc40-recharge-electric-suv-specs-miles-range-reveal
Ingram, G., & Liu, Z. (1997). Motorization and the provision of roads in countries and cities. Washington D.C.: World Bank .
Jong, G., Fox, J., Daly, A., Pieters, M., & Smit, R. (2004). Comparison of car ownership models. Transport Reviews 24(4), 379-408.
Jong, G., Fox, J., Pieters, M., Vonk, L., & Daly, A. (2002). Audit of Car Ownership Models. Leiden: RAND Europe 01192.
Khim, A., & Trommer, S. (2014). The new car market for electric vehicles and the potential for fuel substitution. Energy Policy 73(1), 47-57.
Kwiatkowski, D., Philips, P., Schmidt, P., & Shin, Y. (1992). Testing the null hypothesis of stationarity against the alternative of a unit root: How sure are we that economic time series have a unit root? Journal of Econometrics 54(1-3), 159-178.
Liu, C., & Lin, Z. (2017). How uncertain is the future of electric vehicle market: Results from Monte Carlo simulations using a nested logit model. International Journal of Sustainable Transportation 11(4), 237-247.
Mabit, S., & Fosgreau, M. (2011). Demand for alternative-fuel vehicles when registration taxes are high. Transportation Research Part D: Transport and Environment 16(3), 225-231. Mogre, M. (2012). Comparative Study between Automatic and Manual Transmission Car. International Conference on Mechanical, Automobile and Biodiesel Engineering, 308-312.
26 Moura, F. (2009). Car Organ Transplant: anticipating energy and environmental benefits of cleaner technologies. Tese de Doutoramento em Transportes. Instituto Superior Técnico, Lisboa.
Nau, R. (2019, June 2). Identifying the numbers of AR or MA terms in an ARIMA model. Retrieved from Duke Education: http://people.duke.edu/~rnau/411arim3.htm#unitroot Palmer, K., Tate, J., Wadud, Z., & Nellthorp, J. (2018). Total cost of ownership and market share for hybrid and electric vehicles in the UK, US and Japan. Applied Energy 209, 108-119. Pasaoglu, G., Harrison, G., Jones, L., Hill, A., Beaudet, A., & Thiel, C. (2016). A system dynamics based market agent model simulating future powertrain technology transition: Scenarios in the EU light duty vehicle road transport sector. Technological Forecasting and Social Change 104, 133-146.
Propfe, B., Kreyenberg, D., Wind, J., & Schmid, S. (2013). Market penetration analysis of electric vehicles in the German passenger car market towards 2030. International Journal of Hydrogen Energy 38(13), 5201-5208.
Purdy, J., & Wiegmann, J. (1987). Vehicle Maintenance: Cost Relationship and Estimating Methodology. Transportation Research Record 1140.
Sharma, S., & Kedia, N. (2019). Web Scrapping Tools. Journal of Analysis and Computation 0973-2861.
Silva, M., & Moura, F. (2012). Electric Vehicle Diffusion in the Portuguese Automobile Market. International Journal of Sustainable Transportation 10(2), 49-64.
Stock, J., & Watson, M. (2014). Introduction to Econometrics, Global Edition, 3rd Edition. Pearson Education Limited.
Swamidass, P. (2000). Holt-Brown's Forecasting Model. Boston, MA: Springer. Tips4y. (2019). Sistemas de Informação Auto. Retrieved from Tips4y:
https://www.tips4y.pt/index.asp
Zuhaimy, I., & Abu, N. (2013). New Car Demand Modeling And Forecasting Using Bass Diffusion Model. American Journal of Applied Sciences 10 (6), 536-541.