Tiago de Oliveira Tavares1, Matheus Anaan de Paula Borba2, Luís Alexandre Michelli Gallo3, Lucas Augusto da Silva Gírio4, Carla Segatto Strini Paixão5, Rouverson Pereira da Silva6 (Received: February 3, 2017; accepted: Monday, April 3, 2017)
ABSTRACT: One of the main concerns before agricultural mechanization is the fuel cost from an economic and environmental
point of view. In some literature, it has been demonstrated that the adequacy of tractors is directly related to consumption, which may become a strategy to reduce it. However, the studies were performed with conventional tractors, without information on how the special coffee tractors behave to the adequacy. In this respect, the aim of the present study was to evaluate the hourly fuel consumption in six possible adjustments of a special tractor in the operation of mechanized coffee harvesting. A 4x2 FWD tractor was used, with 52.2 kW power and 2400 kg mass, with 40% to the front axle and 60% to the rear to pull a Master Café 2 coffee harvester with 2900 kg mass without load. The treatments consisted of three ballast configurations in the tractor whether or not using auxiliary front-wheel drive (FWD). The adopted mass-power ratios were: 48, 52 and 56 kg kW-1; obtained through the quantitative alteration of liquid and solid ballasts of the tractor, respecting the mass distribution between the axles recommended by the tractor manufacturer. The evaluations consisted of monitoring fuel consumption at regular hourly intervals, following the premises of statistical process control. It is concluded that the mass-power ratio of 56 kg kW-1 with driven FWD should be used in order to obtain lower slipping, lower average hourly fuel consumption and higher quality.
Index terms: Statistical process control, operating balance, fuel consumption.
DESEMPENHO DE UM TRATOR ESPECIAL EM FUNÇÃO DA LASTRAGEM E DO ACIONAMENTO TRAÇÃO DIANTEIRA AUXILIAR NO RECOLHIMENTO DE CAFÉ
RESUMO: Uma das principais preocupações perante a mecanização agrícola é o gasto de combustível, do ponto de vista
econômico e ambiental. Em algumas literaturas é demostrado que a adequação de tratores está diretamente ligada ao consumo, podendo ser uma estratégia de redução do mesmo. Entretanto, os estudos foram realizados com tratores convencionais, não tendo informações sobre como os tratores especiais cafeeiros se comportam a adequação, neste sentido, objetivou-se neste trabalho avaliar o consumo horário de combustível em seis possíveis adequações de um trator de categoria especial na operação de recolhimento mecanizado de café. Utilizou-se um trator 4x2 TDA com 52,2 kW de potência e massa de 2400 kg, distribuída 40% na dianteira e 60% na traseira tracionando uma recolhedora Master Café 2 com massa 2900 kg sem carga. Os tratamentos constituíram de três configurações de lastros no trator utilizando ou não a tração dianteira auxiliar. As relações de massa-potência adotadas foram: 36 cv-1, 39 cv-1 e 42 kg cv-1; obtidas por meio da alteração quantitativa de lastros líquidos e sólidos do trator, respeitando-se a distribuição de massa entre os eixos recomendada pelo fabricante do trator. As avaliações consistiram em monitorar o consumo de combustível em intervalos regulares de uma hora, seguindo as premissas do controle estatístico de processo. Conclui-se que deve-se trabalhar na relação massa-potência de 42 kg ha-1 com a TDA acionada, para obter menor patinagem, menor consumo horário médio de combustível e maior qualidade.
Termos para indexação: Controle estatístico de processo, equilíbrio operacional, consumo de combustível.
1 INTRODUCTION
There are few studies with mechanized coffee harvesting, however, this phase is essential in mechanized harvesting areas, since the coffee naturally dropped before harvest plus the dropped coffee from the harvester can represent up to 20% of the total load (SANTINATO et al., 2015b; TAVARES et al., 2015). The hand-picked coffee is almost unviable due to the low operating capacity and the labor costs (LANNA; REIS, 2012; SANTINATO et al., 2015a).
In modern coffee growing, the resource management is increasingly viewed in a business way, analyzing costs and using strategies to
1,2,3,4,5,6 Paulista State University “Júlio de Mesquita Filho” /UNESP - Department of Rural Engineering - 14.884-900 Jaboticabal-SP [email protected], [email protected], [email protected], [email protected], [email protected], [email protected]
increase profitability in the short, medium and long terms (CUNHA et al., 2016; FERNANDES et al., 2012, 2016). In recent years, mechanization is evident in all productive stages; however, the concern of managers is to use machines in a rational and economic way (SANTOS; SILVA; GADANHA JUNIOR, 2014).
Among the mechanization costs, fuel is one of the main components, although this consumption is connected to the type of operation, machine and environment (MONTANHA et al., 2011). According to Miranda, Oliveira and Nunes (2000), the fuel consumption of tractors can be reduced, increasing their use efficiency or reducing the need for useful energy within agricultural operations.
The tractor was equipped in the front and rear wheels with 9.5x16 and 14.9x24 diagonal tires, respectively.
The treatments consisted of three ballast configurations in the tractor, resulting in mass-power ratios of 48, 52 and 56 kg kW-1. The tractor shows 2400 kg mass without ballast, with 40% to the front axle and 60% to the rear. For the 48 kg kW-1 ratio, only 50% liquid ballast (water) was used in the front and rear tires, increasing 160 kg and 238 kg in the front and rear axles, respectively. In the 52 kg kW-1 ratio, four metallic ballasts of 47 kg without liquid ballast were used in the front axle, while in the rear axle were used two metallic ballasts of 48 kg and 75% liquid ballast in the tires (totaling 356 kg of liquid ballast in both tires). For the 56 kg kW-1 ratio, three metallic ballasts of 47 kg and 75% liquid ballast (228 kg) were used in the front axle, while in the rear axle were used two metallic ballasts of 48 kg and 75% liquid ballast in the tires (356 kg liquid ballast). For each configuration, the mechanized set was operated with or without driven the auxiliary FWD. In all the treatments, the advance and the slipping were measured using an electronic measurement system developed by the “Finger do Brasil”, also adjusting the tire pressure according to the load and speed (LATIN AMERICAN TIRE AND RIM ASSOCIATION - ALAPA, 2008). The advance measurement system has two sensors that are positioned on the outer left-wheel of the tractor, which send the reading to a digital receiver that calculates and provides the advance and slipping information. The advance is evaluated at a distance of approximately 200 m, verifying the percentage of difference in the number of turns of the wheels with or without driven the FWD. The slipping is obtained by the ratio of the number of tire turns in a linear distance of 50 m without operating (in transport) and the same distance under operation, computed automatically by the sensors.
Hourly fuel consumption was obtained by monitoring the operation over time at hourly regular intervals. Ten supplies were performed for each mass-power configuration with the tractor operating with or without driven the FWD. At each working hour, the tractor’s hour meter was collected, the fuel was replaced and the consumption obtained according to the methodology described by Barbosa et al. (2008).
As performed by Tavares et al. (2015), the data were first analyzed through descriptive statistics using measures of central tendency and Fuel consumption and traction performance
are influenced by soil conditions, tire size, load/ pressure ratio, mass distribution on axles and type of carcass (radial/diagonal), angle and height of claws (SPAGNOLO et al., 2013). Moreover, the presence and use of the auxiliary front-wheel drive (FWD) can increase the traction level of the mechanized set (RALALDI et al., 2016).
Another important factor is the advancement or kinetic relationship that represents the number of turns that the front axle gives while the rear axle gives one turn with driven FWD. According to Prade et al. (2016), this advance should be between 1% and 5% for an adequate displacement of the tractor. The advance rate can be altered by changing the tire type or internal tire pressure (FEITOSA et al., 2015).
However, most of the studies with adequacy are performed with conventional-sized tractors, while in the coffee-growing field are used special (compact) tractors, and there are no studies that guide the adequacy of this class in coffee operations.
In this respect, knowing that the tractor should pull a machine that demands a lot of energy for the harvesting operation, it is assumed that the tractor’s adequacy can reduce the slipping and the fuel consumption. Thus, the aim of the present study was to evaluate the hourly fuel consumption and slipping on mechanized coffee harvesting in three working configurations, whether or not using auxiliary front-wheel drive (FWD).
2 MATERIAL AND METHODS
The study was performed in a coffee plantation in the municipality of Presidente Olegário, Minas Gerais, Brazil, close to the geodesic coordinates 18°02’ S and 47°27’ W, with average altitude and slopes of 917 m and 3%, respectively. The farming is characterized by a traditional savanna with commercial crop of
Catuaí Vermelho IAC 144 variety and spacing of
4.00 m between rows and 0.50 m between plants, totaling 5000 plants ha-1, with 10 years of age. There was no turnover in the interlines, showing firm ground.
The used mechanized set consisted of a tractor John Deere 5425N 4x2 FWD with 52.2 kW (75 hp) in the engine (nominal rotation) operated in the speed of 1.26 km h-1 at 1700 rpm and a MIAC Master Café 2 harvester with 2900 kg mass and 1.40 m working width equipped with an axial cleaning system and bulk tank with 3000 L capacity.
dispersion. For measures of central tendency, an arithmetic mean was used, allowing finding a mean value of data for each treatment; the median refers to a found value that separates the data, having the same amount of data below and above the same. The used dispersion measures were: data amplitude, standard deviation and coefficient of variation. These measures show how the data behaves around the mean. Measurements of skewness and kurtosis were also used.
The coefficient of skewness (Cs) quantifies how far the variable is in relation to a central value, characterizing how and how much the frequency distribution of the data is longer from the symmetry, being that when the Cs is greater than zero, there is an asymmetric distribution with a tendency of these values to be to the right of the central value; when Cs is below zero (of a negative nature), the distribution is asymmetric, tending to the left; and if Cs is equal to zero, the distribution is symmetric, i.e., there is a balance among data distribution (ORMOND et al., 2016).
The coefficient of kurtosis, identified as Ck, which can be classified as a weight measure of the distribution causes, indicating the dispersion (flattening and stretching) of the data distribution in relation to a pattern, being usually the normal curve. The kurtosis receives the following classification: the index equal to zero (Ck=0) indicates a normal mesokurtic distribution; whether Ck is lower than zero (Ck<0), i.e., a negative value, the distribution is platykurtic (thinner tails) and whether Ck is greater than zero (Ck>0), the distribution is leptokurtic (fatter tails) (ORMOND et al. al., 2016).
The coefficient of variation followed the classification of Pimentel-Gomes and Garcia (2002), which classifies as low (lower than 10%); medium (from 11 to 20%); high (from 21 to 30%) and very high (greater than 30%). To verify the data normality, the used test was the Anderson-Darling, whose objective is to measure the proximity between the points and the fitted line of the probability plot, as used by Cassia et al. (2013).
Afterwards, the consumption behavior was analyzed through statistical process control using the control charts for individual values in order to allow verifying the stability of the process. According to Voltarelli et al. (2013), control charts present all the observations obtained in the evaluations as well as their variability and behavior over time.
These charts show three rows, the center line representing the mean value while the other two represent the upper and lower control limits (UCL and LCL, respectively), being calculated based on the standard deviation of variables (for UCL, mean plus three times the standard deviation, and for LCL, mean minus three times the standard deviation, when greater than zero), indicating that if the process is under control, the points will be between the two threshold lines. Whether the points are outside the upper and lower control limits or are within limits, but presenting a non-random pattern, the process is given as potentially out of control, requiring an investigation to find corrective measures seeking to eliminate the causes responsible for such variation (VOLTARELLI et al., 2015).
3 RESULTS AND DISCUSSION
For the treatment 48 kg kW-1, the advance rate was 2.53% and 5.37% slipping, for the 52 kg kW-1, the advance rate was 1.8% and 2.88% slipping, while the treatment 56 kg kW-1 showed the advance rate of 2.28% and 0.01% slipping. Several studies indicate that ideal slipping varies from 5 to 15%, in loose ground values close to 15% are accepted while values close to 5% for firm ground (SERRANO et al., 2008); however, these studies were not performed with tractors, thus precluding the decision-making. It is believed that slipping results may be lower when working on firm terrain with low slope and at speeds around 1.3 km h-1. Regarding the advance rate, it can be observed that the values were acceptable (0 to 5%) in all configurations, according to the recommendation established by Prade et al. (2016).
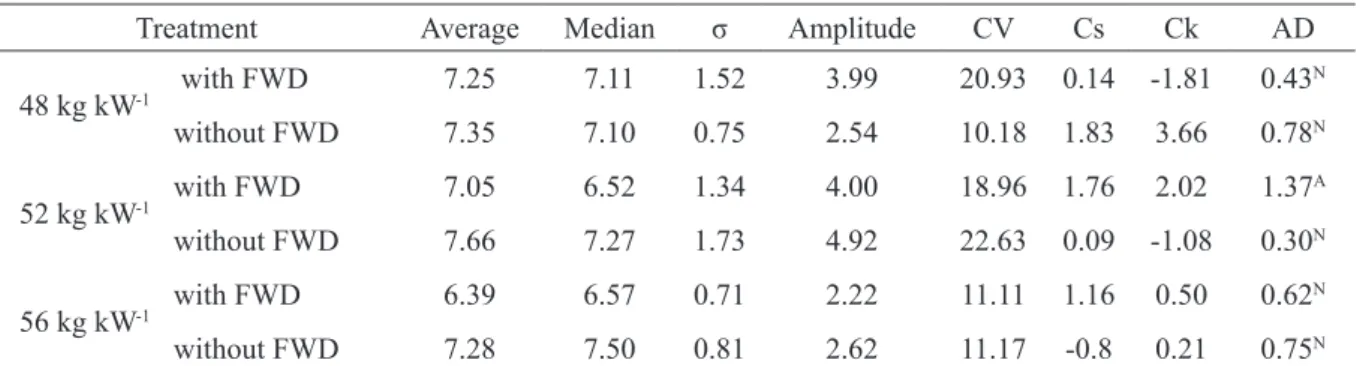
Based on the descriptive statistics of the fuel hourly consumption results (Table 1), it was noted that the data presented a normal distribution in all treatments, except for the treatment 52 kg kW-1 with the driven FWD, showing a non-normal distribution. Moreover, the means and medians have close values, being that the greatest difference occurs in the configuration where the data do not show normal distribution. The values found for the data amplitude of each configuration were low. On the other hand, the values of the standard deviation and coefficient of variation were high for the treatments 48 kg kW-1 with FWD and 52 kg kW-1 without FWD. For the other treatments, the values were medium, according to the classification of Pimentel-Gomes and Garcia (2002).
TABLE 1 - Descriptive statistics for fuel consumption as a function of the mass-power ratio and the use of auxiliary front-wheel drive.
Treatment Average Median σ Amplitude CV Cs Ck AD
48 kg kW-1 with FWD 7.25 7.11 1.52 3.99 20.93 0.14 -1.81 0.43 N without FWD 7.35 7.10 0.75 2.54 10.18 1.83 3.66 0.78N 52 kg kW-1 with FWD 7.05 6.52 1.34 4.00 18.96 1.76 2.02 1.37 A without FWD 7.66 7.27 1.73 4.92 22.63 0.09 -1.08 0.30N 56 kg kW-1 with FWD 6.39 6.57 0.71 2.22 11.11 1.16 0.50 0.62 N without FWD 7.28 7.50 0.81 2.62 11.17 -0.8 0.21 0.75N
σ - Standard deviation; CV (%) - Coefficient of variation; Cs - Coefficient of skewness; Ck - Coefficient of kurtosis; AD - Anderson-Darling normality test (N: normal distribution; A: non-normal distribution).
It is also observed that the values of the coefficient of skewness in the treatments 48 kg kW- 1 with FWD and 52 kg kW-1 without FWD had small skewness degrees to the right, while the treatments 48 kg kW-1 without FWD, 52 kg kW-1 with FWD and 56 kg kW-1 with FWD had a high skewness degree to the right. On the other hand, the treatment 56 kg kW-1 without FWD had moderate skewness degree to the left. By the coefficient of kurtosis, it was observed that the treatments 48 kg kW-1 with FWD and 52 kg kW-1 without FWD had a platykurtic distribution of the curve, while the other treatments showed leptokurtic (fatter tails) distribution.
In the control charts of the hourly fuel consumption (Figure 1) for configuration of 48 kg kW-1, it can be observed that the averages were considerably close by whether or not using the FWD, resulting in average consumption of 7.25 and 7.35 L h-1, respectively. On the other hand, there is a considerable difference in the variability of values, in which a greater consumption variability is observed when the harvesting operation is performed with FWD, which was also found in the moving range charts. However, despite the variability, whether or not using the FWD in the 48 kg kW-1 configuration demonstrates stability in the process.
A study performed in field operation by Fontana et al. (1986) showed that the use of auxiliary FWD increased hourly fuel consumption by 5.82%, although provided an average increase of 5.76% in operating capacity. Lopes et al. (2003) emphasized that fuel consumption is not only dependent on whether or not using the auxiliary FWD, but rather on a number of factors, including tire type, inflation pressure, soil type and ballasting.
Fiorese et al. (2015) found that the tractor load (mass-power ratio) together with the energy demand of the operation causes that the fuel consumption (energy demand) is changed as a function of the FWD usage. Thus, it is believed that the 48 kg ha-1 ratio is not indicated for the harvesting operation due to the greater harvester mass in relation to the tractor mass, which leads to the combination that generates the highest average hourly consumption when compared to the other configurations. The performance of this operation with the lightweight (low ballast) tractor is against the safety principles, having a high susceptibility to slipping and lateral slippage mainly in places with more sloping terrain.
For treatments in which the mass-power ratio is 52 kg kW- 1 (Figure 2), it is verified that the use of FWD had an average hourly fuel consumption of 7.05 L h-1, 7.96% (0.61 L h-1) hourly consumption saving in relation to the performance of the service without driven the FWD. It can also be verified that the use with driven FWD generates less variability in the hourly fuel consumption when compared to the FWD off. However, when FWD was used, there was an out-of-control point, evidencing some special cause that makes the process unstable, which can be attributed to the machine and to the environment in which the collector was jammed due to the excess of mineral impurities in the collected material.
Miranda, Oliveira and Nunes (2000) mentioned that fuel consumption is not significantly altered considerably, but reduced slipping increases the operating capacity, resulting in lower operating consumption. In this respect, Schlosser and Dallmeyer (1988) mentioned that the use of FWD in soil preparation operations reduced slipping and increased by 17% the operating capacity.
FIGURE 1 - Control charts of individual values and moving range for hourly fuel consumption in the configuration 48 kg kW-1 with and without auxiliary front-wheel drive (FWD).
FIGURE 2 - Control charts of individual values and moving range for hourly fuel consumption in the configuration 52 kg kW-1 with and without auxiliary front-wheel drive (FWD).
Thus, it is believed that the results obtained in this ratio 52 kg ha-1 (standard ratio of coffee tractors) be explained since it deals with a special tractor category (coffee), resulting in lower hourly fuel consumption for harvesting.
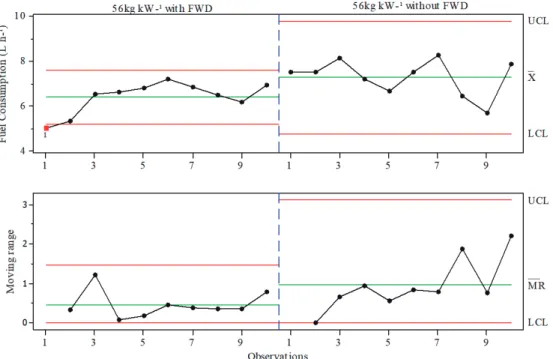
In the configuration 56 kg kW-1 (Figure 3), a similar behavior to the 52 kg kW-1 was observed (Figure 2), in which the use of the driven FWD promotes a lower fuel consumption as well as lower variability in the mean values obtained over time. Thus, it is observed that the average hourly consumption in the treatment 56 kg kW-1 with FWD was 12.22% (0.89 L h-1) lower than 56 kg kW-1 without FWD, which throughout a harvest can represent a high saving in the operating costs of the operation under study.
On the other hand, the first observation of the individual chart values of the treatment with FWD is outside the control limits, causing instability. However, once it is a value below the lower control limit, this observation refers to a lower average consumption value, thus being economically desirable. The possible explanation for this low fuel consumption value would be the characteristic of piles that, when there is a lower level of material to be collected, demand less energy from the tractor to the harvester.
Given all the presented results, it is possible to note an influence of the activation of the auxiliary traction in relation to the hourly fuel consumption for special tractors (coffee trees). For the harvesting operation, the use of 56 kg kW-1 with driven FWD generates the lowest fuel consumption when compared to the other tested configurations. This configuration makes the tractor more suitable to pull a machine with a mass bigger than its own mass, improving the traction power and reducing the fuel consumption. This hypothesis is confirmed by the lower average value, among all treatments, of hourly fuel consumption and lower range, therefore with greater reliability in the obtained results. The adoption of the 56 kg kW-1 ratio with driven FWD leads to lower fuel consumption, reducing up to 1.27 L h-1, showing best cost-effectiveness and economic viability. Once the total working hours in this operation is high, even small differences in hourly consumption averages would result in a large amount at the end of harvest.
Montanha et al. (2011) state that in operations, such as harvesting, where the harvester has a larger mass than the tractor, it is extremely important to use the FWD in order to provide greater stability in the operation, thus becoming safer to the operator.
FIGURE 3 - Control charts of individual values and moving range for hourly fuel consumption in the configuration 56 kg kW-1 with and without auxiliary front-wheel drive (FWD).
4 CONCLUSIONS
The best performance of the special coffee tractor in the coffee harvesting was observed in the mass-power ratio 56 kg kW-1 operating with the driven FWD, resulting in lower fuel consumption.
The adequacy of ballasts to the operation reduced fuel consumption by up to 1.27L h-1 in the harvesting, besides reducing slipping.
Statistical process control proved to be effective in monitoring the fuel consumption variability throughout the operation
5 ACKNOWLEDGEMENTS
The authors would like to thank the National Council for Scientific and Technological Development (CNPq), the Coordination for the Improvement of Higher Education Personnel (CAPES) and the Fazenda Gaúcha for structural and financial support.
6 REFERENCES
ASSOCIAçãO LATINOAMERICANA DE PNEUS EAROS. Manual de normas técnicas. São Paulo, 2008. 325 p.
BARBOSA, R. L. et al. Desempenho comparativo de um motor de ciclo diesel utilizando diesel e misturas de biodiesel. Ciência e Agrotecnologia, Lavras, v. 32, n. 5, p. 1588-1593, set./out. 2008.
CASSIA, M. T. et al. Quality of mechanized coffee harvesting in circular planting system. Ciência Rural, Santa Maria, v. 43, n. 1, p. 28-34, jan. 2013.
CUNHA, J. P. B. et al. Viabilidade técnica e econômica de diferentes sistemas de colheita do café. Coffee Science, Lavras, v. 11, n. 3, p. 416-425, jul./set. 2016. FEITOSA, J. R. et al. Influência na pressão interna dos pneus e da velocidade de deslocamento nos parâmetros operacionais de um trator agrícola e nas propriedades físicas do solo. Engenharia Agrícola, Jaboticabal, v. 35, n. 1, p. 117-127, jan./fev. 2015.
FERNANDES, A. L. T. et al. A moderna cafeicultura dos cerrados brasileiros. Pesquisa Agropecuária Tropical, Goiânia, v. 42, n. 2, p. 231-240, abr./jun. 2012.
______. Viabilidade técnica e econômica da irrigação localizada do cafeeiro, nas condições climáticas do planalto de Araxá, MG. Coffee Science, Lavras, v. 11, n. 3, p. 347-358, jul./set. 2016.
FIORESE, D. A. et al. Desempenho de três tratores agrícolas em ensaios de tração. Revista de Agricultura Neotropical, Cassilândia, v. 2, n. 2, p. 68-76, abr./jun. 2015.
FONTANA, C. F. et al. Desempenho comparativo de tratores com e sem tração dianteira auxiliar durante a escarificação do solo. Revista do Centro de Ciências Rurais, Santa Maria, v. 16, n. 3, p. 237-249, 1986. LANNA, G. B. M.; REIS, P. R. Influência da mecanização da colheita na viabilidade econômico-financeira da cafeicultura no sul de Minas Gerais. Coffee Science, Lavras, v. 7, n. 2, p. 110-121, maio/ ago. 2012.
LOPES, A. et al. Consumo de combustível de um trator agrícola em função do tipo de pneu, da lastragem e da velocidade de trabalho. Revista Brasileira de Engenharia Agrícola e Ambiental, Campina Grande, v. 7, n. 2, p. 382-386, maio/ago. 2003.
MIRANDA, N. O.; OLIVEIRA, M.; NUNES, R. N. Desempenho operacional de trator com tração dianteira auxiliar na subsolagem de um inceptisol. Revista Brasileira de Engenharia Agrícola e Ambiental, Campina Grande, v. 4, n. 1, p. 97-102, jan./abr. 2000. MONTANHA, G. K. et al. Consumo de combustível de um trator agrícola no preparo do solo para a cultura do algodão irrigado em função da pressão de inflação nos pneus. Energia na Agricultura, Botucatu, v. 26, n. 1, p. 39-51, 2011.
ORMOND, A. T. S. et al. Características agronômicas da soja em semeadura convencional e cruzada. Revista Agro@mbiente On-line, Boa Vista, v. 9, n. 4, p. 414-422, out./nov. 2016.
PIMENTEL-GOMES, F.; GARCIA, C. H. Estatística aplicada a experimentos agronômicos e florestais: exposição com exemplos e orientações para uso de aplicativos. Piracicaba: FEALQ, 2002. 309 p.
PRADE, R. et al. Influência da pressão interna dos pneus no raio de giro e índice de simetria de dois tratores agrícolas. In: CONGRESSO BRASILEIRO DE ENGENHARIA AGRíCOLA, 45., 2016, Florianópolis. Resumos Expandidos... Jaboticabal: SBEA, 2016. Available from: <file:///C:/Users/Thiago/Downloads /401181462140886influencia-do-lastro-liquido-e-da- pressao-interna-dos-pneus-na-relacao-cinematica-de-um-trator%20(1).pdf>. Acesso em: 10 dez. 2016.
RINALDI, P. C. N. et al. Condições de tração dos tratores agrícolas fabricados e comercializados no Brasil. Brazilian Journal of Applied Technology for Agricultural Science, Guarapuava, v. 9, n. 1, p. 83-89, jan./abr. 2016.
SANTINATO, F. et al. Análise econômica da colheita mecanizada do café utilizando repetidas operações da colhedora. Coffee Science, Lavras, v. 10, n. 3, p. 402-411, jul./set. 2015a.
______. Número de operações mecanizadas na colheita do café. Ciência Rural, Santa Maria, v. 45, n. 10, p. 1809-1814, out. 2015b.
SANTOS, N. B.; SILVA, R. P.; GADANHA JUNIOR, C. D. Economic analysis for sizing of sugarcane (Saccharum spp.) mechanized harvesting. Engenharia Agrícola, Jaboticabal, v. 34, n. 5, p. 945-954, set./out. 2014. SCHLOSSER, J. F.; DALLMEYER, A. U. Desempenho operacional de um trator com tração dianteira auxiliar operando com as rodas dentro e fora de sulco. In: CONGRESSO BRASILEIRODE ENGENHARIA AGRíCOLA, 17., 1988, Iperó. Resumos Expandidos... Iperó: CENEA/SBEA, 1988. v. 2, p. 432-437.
SERRANO, J. M. P. R. Pressão de insuflagem dos pneus no desempenho do conjunto trator-grade de discos. Pesquisa Agropecuária Brasileira, Brasília, DF, v. 43, n. 2, p. 227-233, fev. 2008.
SPAGNOLO, R. T. et al. Desempenho operacional de um trator agrícola em função da lastragem, pressão de inflação e desgaste do pneu. Engenharia na Agricultura, Viçosa, v. 21, n. 4, p. 379-386, jul./ago. 2013.
TAVARES, T. O. et al. Qualidade do recolhimento mecanizado do café. Coffee Science, Lavras, v. 10, n. 4, p. 455-463, out./dez. 2015.
VOLTARELLI, M. A. et al. Monitoring of mechanical sugarcane harvesting through control charts. Engenharia Agrícola, Jaboticabal, v. 35, n. 6, p. 1079-1092, nov./dez. 2015.
______. Quality of performance of the operation of sugarcane mechanized planting in day and night shifts. Australian Journal of Crop Science, Melbourne, v. 7, n. 9, p. 1396-1406, 2013.