Engineering ISSN: 1809-4430 (on-line)
_________________________
2 São Paulo State University (Unesp), School of Agricultural and Veterinarian Sciences/Jaboticabal, Brazil. 3 Federal University of São Carlos / Lagoa do Sino, Brazil.
EFFECTIVE POWER AND HOURLY FUEL CONSUMPTION DEMANDED BY SET TRACTOR- COFFEE HARVESTER IN FUNCTION OF ADEQUACY TRACTOR
BALLASTING
Doi:http://dx.doi.org/10.1590/1809-4430-Eng.Agric.v37n4p699-708/2017
TIAGO DE O. TAVARES1*, ANDRÉ F. DAMASCENO2, MURILO A. VOLTARELLI3,
ROUVERSON P. DA SILVA2, CARLOS E. A. FURLANI2
1*Corresponding author. São Paulo State University (Unesp), School of Agricultural and Veterinarian Sciences/
Jaboticabal - SP, Brazil. E-mail: [email protected]
ABSTRACT: The mechanized gathering process of sweeping coffee is extremely important to
reduce the losses of fruit not used in the harvesting operation. But this operation usually has a low operational performance and a high cost per unit collected in this way any measures that can effectively reduce costs increase the viability of the operation. In this sense, studies on adequacy tractor mass for each operation show improvement in energy use, reducing fuel consumption. So, this study aimed to quantify the fuel consumption and effective power along the process of a tractor 4x2 FWD pulling the coffee harvester. I was used as treatments three ballasting settings, these being equivalent the relations power to weight of 36, 39 and 42 kg hp-1 working with and without activated FWD, randomized statistically, with 10 repetitions each configuration. It was conclude that, at low power-weight ratio, the front wheel drive assist had no significant influence on the hour fuel consumption. Already in the configuration with higher ratio, the use of front wheel drive favored in reducing fuel consumption and better energy use.
KEYWORDS: dynamic mass equilibrium, power-weight ratio, front wheel assist.
INTRODUCTION
In recent years, Brazilian agriculture has undergone a transitional period due to the burden of costs and the increasing unavailability of labor (Fernandes et al., 2012). The intensive use of machines has become essential for the sustainability of many agribusiness components, and in the face of the high investments with the acquisition of machines, the concern with the optimization of their use becomes more and more necessary. Besides the constant search for the machines improvement, at each year, the market presents novelties, either by new concepts or adequacy of existing ones (Salvador et al., 2009).
Another factor that accounts for most of the costs is the fuel or the energy demand spent on agricultural activities, especially on large power machines, and for this reason, agricultural companies have been adjusting the machines to reduce operational consumption (Montanha et al., 2011).
As well as in cultures with higher production technology, coffee production underwent several adaptations in the last 15 years, especially in harvesting activities, mainly in order to reduce costs and guarantee the survival of the activity (Silva et al., 2003; Fernandes et al., 2012; Santinato et al., 2015a).
Considering the possibility of optimization of gathering operations and also the reduction of costs, mechanization becomes a point of extreme importance in a coffee crop (Santinato et al., 2015b). Among the harvesting stages, gathering of fallen fruits in the soil is notable for having a high cost per harvested unit, mainly due to the low operational field capacity (Tavares et al., 2015). Baio et al. (2013) point out that to reduce the costs of operations, we can increase the operational capacity or adjust the sets used for each operation, allowing reducing the demand for machinery and obtaining lower fuel consumption.
As agriculture tends to become increasingly mechanized, agricultural enterprises that seek to remain at the top of the market, with a greater margin of safety, are betting on management tools that monitor and provide information to enable decision making (Voltarelli et al., 2013). In this sense, these companies seek to adjust or balance the time and the machines operation mode according to the functions they perform, reducing maintenance and unnecessary consumption of fuel (Montanha et al., 2011).
The agricultural tractor may be suitable by modifying its mass-power ratio according to the conditions and operations in which it will work, what may increase or decrease the energy demand resulting from the operation. Therefore, the suitability of a tractor with the use of auxiliary front wheel drive (TDA) and ballast (liquid and metallic) can contribute, when well done, so that the tractor does not get excess mass (excess ballast) or excessive skating (lack of ballast), resulting in increased fuel consumption and wear of internal components (Monteiro et al., 2011). In this sense, recent studies with statistical process control (SPC) has shown a high management potential to monitor the variability causes of mechanized agricultural processes, allowing decision making to reduce the variability in question, increasing the reliability of operations (Zerbato et al. 2014, Silva et al., 2013).
In view of the aforementioned information, assuming that the suitability of tractors for agricultural use generates benefits to the operation's performance in order to reduce the hourly fuel consumption, this study aimed to evaluate the power demand in mechanized coffee harvester, through the adequacy of the tractor in three ballast configurations, with and without the use of the auxiliary power take-off.
MATERIAL AND METHODS
The experiment was carried out in the agricultural area of the municipality of Presidente Olegário-MG, Brazil, at latitude 18°02’04”south and longitude 47°27’38”west, with average altitude of 917 meters and and slope of 3%.According to Peel et al. (2007), the climate of the site is Aw according to the Köeppen-Geiger classification, with an average precipitation of 1400 mm annually. The soil of the site is classified as RED LATOSOL Dystroferric medium texture by EMBRAPA classification (EMBRAPA, 2006). The cultivar used was the Catuaí Vermelho IAC 144 planted in a circle (Pivot).
The pickup of the falling coffee was performed by a mechanized set tractor 4x2 FWD John Deere 5425 N with rated power of 75 hp (55.16 kW) at 2400 rpm in the engine and a Miac Master Coffee 2 harvester, operating at an average speed of 1.26 Km h-1. The tractor was equipped with Goodyear tires with dimensions 9.5-16 R1 on the front wheel and 14.9-24 R1 on the rear wheel. The statistical design was based on the assumptions of the statistical quality control, and the treatments consisted of three ballast configurations in the tractor, propitiating in the mass-power relations of 36, 39 and 42 kg hp-1.The tractor has 2400 kg mass without ballast, distributed in 40% and 60% in the front and the rear part, respectively.
the rear axle had 2 metallic ballasts of 48 kg, and 75% of water in the tires (356 kg of water in both).
The harvester has a mass of 3430 kg, transferring 600 kg to the tractor's drawbar, which
increases the mass of the tractor’s rear axle. This transfer occurs due to the fact that most of the
harvester mass is concentrated at the back of the harvester.
It was carried out the characterization of the advancement and the skating of the tractor’s
wheels, using an electronic advancer of the brand Finger of Brazil, coupling the equipment to the tractor’s wheels, to quantify the number of the wheels’ turns, adjusting also the tire pressure depending on the load, according to the ALAPA manual (ALAPA, 2007). The values of advancement and skating were 2.53 and 5.37; 1.80 and 2.88 and 2.28% and 0.01% for the 36, 39 and 42 kg hp-1 ratios, respectively.
The fuel consumption assessment was performed according to methodology cited by Macedo et al. (2016) using Oval flow meters; model LSN40, with output signal impulse type and 1 mL per pulse accuracy. Ten measurements were performed with the tractor operating with and without FWD triggered, at each mass-power ratio.The estimation of the effective power was calculated in function of theoretical power (Equations 1 and 2) according to Mialhe (1974), in which the total hourly fuel consumption of the mechanized coffee harvester set was used.
(1)
where,
Tp –Theoretical power, hp;
HFC - hourly fuel consumption, L h-1;
0,852 – Especific mass of fuel, kg L-1 (Mialhe, 1980);
10110 - calorific value of fuel, kcal kg-1 (Mialhe, 1980); 427 – mechanical equivalent of heat, kgm kcal-1;
3600 – conversion factor, 75 - conversion factor.
(2)
where,
Ep - effective power, kW; Tp –Theoretical power, hp;
0,34 - Mechanical thermal efficiency (Mialhe, 1980),
1,36 - conversion factor.
As initial analysis, the data were submitted to descriptive statistics, to allow the general visualization of their behavior. This analysis assumes the data as being independent of each other, therefore, without considering the influence of the sampling site and relative positions. Finally, a general demonstration of the behavior of the data was performed by calculating the measures of central tendency (mean and median) and dispersion measures (standard deviation, amplitude and coefficient of variation), as well as the coefficients of asymmetry and kurtosis (Léon et al., 2005). The Ryan-Joiner test was used to verify the normality of the data, being a measure of proximity of the points and the estimated probability line, giving greater rigidity to the analysis (Noiman, 2013).
the monitoring of the process and the identification of the variation type to which it is submitted over time, and may consist of: grouping - represented by groups of points in certain areas of the graph, above or below the median; trend - which represents a sequence of successive increases or decreases in detected observations when the number of useful observations is successive, more than seven;mixing - this is a pattern that indicates the absence of points near the center line, that is, the points alternate above and below the center line (median), showing that there are two distinct data groups; and oscillation - indication of the existence or not of a regular pattern occurring over time, being detected when the data fluctuates rapidly above or below the median.
The verification of the data randomness was performed by means of the 5% probability test and, since the p-value for the standards is less than 0.05, the null hypothesis of non-randomness is rejected in favor of the alternative to the standard tested. The occurrence of these patterns may indicate that the process is close to extrapolating the control limits that is, it becomes unstable or that it is already present in this situation, but this type of analysis must be complemented by checking the control charts, thus obtaining greater precision in the behavior of quality indicators (MINITAB, 2007).
It was also used I-MR control charts (individual values and moving amplitude), which have central lines (general mean and mean amplitude), as well as upper and lower control limits, defined as UCL and LCL, calculated with (For UCL, mean plus three times the standard deviation, and for LCL, mean minus three times the deviation, when greater than zero). These charts were used in order to identify the non-randomness due to the process, as well as to evaluate the operation quality, using as quality indicators the variables described previously (Montgomery, 2009).
RESULTS AND DISCUSSION
For the hourly fuel consumption and the effective power of the engine for each of the treatments used (36, 39 and 42 kg hp-1) and by the activation, or not, of the auxiliary front wheel
drive (FWD), it was obtained, according to the Ryan-Joiner test, that in five treatments, the results present normal probability distribution, whereas only in the 39 kg hp-1 setting with the FWD triggered, the results present a non-normal distribution (Table 1).
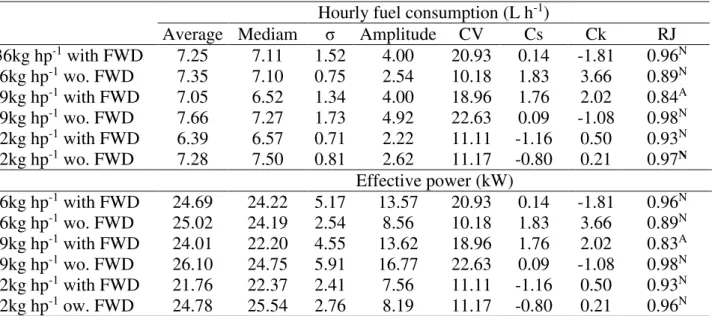
TABLE 1. Descriptive statistics for the hourly fuel consumption and effective power in the mechanized coffee harvester.
Hourly fuel consumption (L h-1)
Average Mediam σ Amplitude CV Cs Ck RJ
36kg hp-1 with FWD 7.25 7.11 1.52 4.00 20.93 0.14 -1.81 0.96N 36kg hp-1 wo. FWD 7.35 7.10 0.75 2.54 10.18 1.83 3.66 0.89N 39kg hp-1 with FWD 7.05 6.52 1.34 4.00 18.96 1.76 2.02 0.84A
39kg hp-1 wo. FWD 7.66 7.27 1.73 4.92 22.63 0.09 -1.08 0.98N 42kg hp-1 with FWD 6.39 6.57 0.71 2.22 11.11 -1.16 0.50 0.93N 42kg hp-1 wo. FWD 7.28 7.50 0.81 2.62 11.17 -0.80 0.21 0.97N
Effective power (kW)
36kg hp-1 with FWD 24.69 24.22 5.17 13.57 20.93 0.14 -1.81 0.96N
36kg hp-1 wo. FWD 25.02 24.19 2.54 8.56 10.18 1.83 3.66 0.89N 39kg hp-1 with FWD 24.01 22.20 4.55 13.62 18.96 1.76 2.02 0.83A 39kg hp-1 wo. FWD 26.10 24.75 5.91 16.77 22.63 0.09 -1.08 0.98N 42kg hp-1 with FWD 21.76 22.37 2.41 7.56 11.11 -1.16 0.50 0.93N
42kg hp-1 ow. FWD 24.78 25.54 2.76 8.19 11.17 -0.80 0.21 0.96N σ–Standard deviation; CV (%) –Coefficient of variation; Cs –Coefficient of asymmetry; Ck –Kurtosis coefficient; RJ – Ryan-Joiner normality test (N:Normal distribution; A:Non-normal distribution); wo. – without.
the amplitude of the results for each type of adequacy can be considered as high, as well as the values of the standard deviation and coefficient of variation, in only two treatments (36 kg hp-1 with
FWD and 39 kg hp-1 without FWD), indicating that, in these cases, the central tendency of the data (average) does not represent well the distribution of the data (Pimentel-Gomes & Garcia, 2002).
On the other hand, by the analysis of the hourly fuel consumption and the engine effective power, by means of the asymmetry coefficient, low and positive values were verified for two treatments (36 kg hp-1 with FWD and 39 kg hp-1 without FWD),indicating that the results are well distributed around the mean of the treatment; moderate and positive for the 36 kg hp-1 with FWD, indicating a slight asymmetry of the data to the right side of the distribution (average greater than the median) and moderate and negative for 42 kg hp-1 without FWD, resulting in mild asymmetry to the left, which represents the median being greater than the average of the data set (MINITAB, 2007). As for the rest of treatments the asymmetry coefficients are considered high, which may show a tendency to deviate from the distributions mean of the results, and is not, however, strong enough to make a non-normal distribution.
In relation to the kurtosis coefficient, it was found that the distributions, for treatments 36 kg hp-1 with FWD and 39 kg hp-1 without FWD, are considered platykurtic, because the coefficient is negative and its representation curve is flattened ;for the relations 36 kg hp-1 without FWD, 39 kg hp-1 with FWD and 42 kg hp-1 with and without FWD triggered, the distributions are leptokurtic, since they present values greater than zero, representing greater sharpness of the distribution curves. Despite the slight distortions of the curves, which represent the kurtosis coefficient, these were not sufficient to make the distribution not normal for both quality indicators.
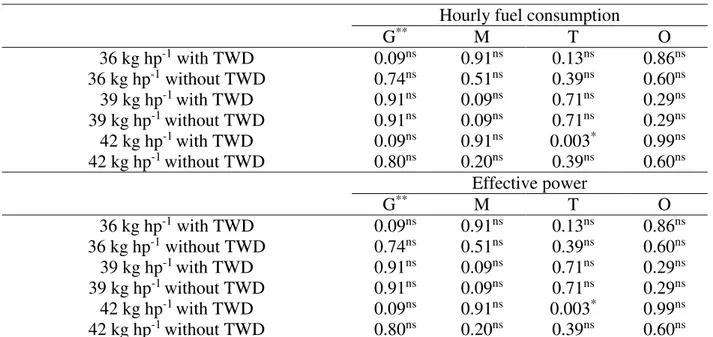
The standard values of the hourly fuel consumption and the effective power demanded in the operation presented non-randomness patterns only in the mass-power ratio of 42 kg ha-1, working with auxiliary front-wheel drive (FWD), in which there was a standard trend. This pattern may indicate possible increases in the amount of fuel demanded during the operation, while the other treatments had random behaviors (Table 1).
TABLE 2. Standard values of probability of sequential graphs for hourly fuel consumption and effective power in three ballasts of the tractor in the mechanized coffee harvester.
Hourly fuel consumption
G** M T O
36 kg hp-1 with TWD 0.09ns 0.91ns 0.13ns 0.86ns 36 kg hp-1 without TWD 0.74ns 0.51ns 0.39ns 0.60ns
39 kg hp-1 with TWD 0.91ns 0.09ns 0.71ns 0.29ns 39 kg hp-1 without TWD 0.91ns 0.09ns 0.71ns 0.29ns 42 kg hp-1 with TWD 0.09ns 0.91ns 0.003* 0.99ns
42 kg hp-1 without TWD 0.80ns 0.20ns 0.39ns 0.60ns Effective power
G** M T O
36 kg hp-1 with TWD 0.09ns 0.91ns 0.13ns 0.86ns
36 kg hp-1 without TWD 0.74ns 0.51ns 0.39ns 0.60ns 39 kg hp-1 with TWD 0.91ns 0.09ns 0.71ns 0.29ns 39 kg hp-1 without TWD 0.91ns 0.09ns 0.71ns 0.29ns 42 kg hp-1 with TWD 0.09ns 0.91ns 0.003* 0.99ns
42 kg hp-1 without TWD 0.80ns 0.20ns 0.39ns 0.60ns 1Weight-power ratios (36, 39 and 42 kg.hp-1) and working method (with and without auxiliary driven front wheel drive (FWD) **
G - Grouping, M- Mixture, T - Trend, O - Oscillation. Ns- not significant at p <0.05; * Significant at p <0.05.
According Mialhe (1980), information related to the effective power allows to verify if the mechanized assemblies are in equilibrium and behaving in a predictable way.
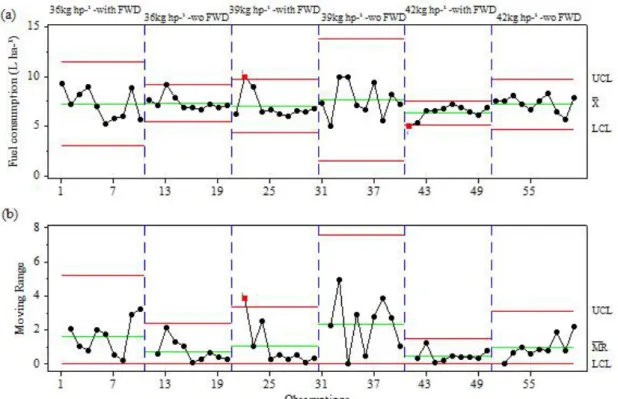
By analyzing the control charts for mass-power ratio 36 kg hp-1 with and without the front-wheel drive, it can be seen that the means of fuel consumption are close (7.25 L h -1 and 7.35 L H-1) (Figure 1; Table H-1). It is also noted that the process is considered stable, with all points within the lower and upper control limits with and without FWD (auxiliary front wheel drive). This information proves the randomness pointed out by the standard values of the sequential graphs, allowing affirming that the process is free of external influences (Table 2).
FIGURE 1. Control charts for fuel consumption in relations to power-weight 36, 39 and 42 kg hp-1.
(a) Control charts of individual values. (b) Control charts of moving amplitude. UCL: Upper control limit; LCL: Lower control limit; X̅: Average of individual values; MR: Average of moving range. wo = without.
On the other hand, the upper and lower limits present great variation, as well as their moving amplitudes, since these are acquired according to the standard deviation of each treatment,making the limits of the configuration with the triggered traction more distant, since its values of standard deviation and coefficient of variation were higher than the values of the treatment without the auxiliary front traction, evidencing the greater variability of the collected data in the first configuration.Therefore, in this configuration, there is no evidence of any advantage in the use of auxiliary tractor traction during the mechanized harvester operation, increasing the energy demand in the course of the operation.
For treatments in which the mass-power ratio is 39 kg hp-1, it can be verified that the configuration with the FWD-triggered has a behavior with less variability when compared to the configuration without FWD, showing standard deviation and coefficient of variation of lower values.
It is also observed that although there are no patterns of non-randomness (Table 2), the process is unstable, which may show that the use of random patterns and control charts are essential for the monitoring of an agricultural process, leading to a greater criterion in the analysis and interpretation of the factors that decrease the quality level of the operation. Therefore, in this configuration, there is evidence of advantages in the use of front tractor traction, despite the instability of the process, because in this configuration, the average hourly consumption is smaller, being considerable when observed in a longer time scale for the operation, resulting in lower energy demand of the operation.
The mass-power ratio 42 kg hp-1 for the coffee harvester operation when performed with the
auxiliary front-wheel drive showed an average hourly fuel consumption lower than the one in which there was no use of the FWD (Auxiliary Front Wheel Drive), with values of 6.39 and 7.28 L h-1, respectively (Figure 1).
It is also observed a lower amplitude and standard deviation of these results for the mass-power ratio 42 kg hp-1 with the use of FWD, resulting in less variability. However, the first observation of the treatment with FWD is outside the control limits, indicating that this configuration, despite having process instability, has lower hourly fuel consumption, which is interesting for the operation and does not necessarily represent a factor that compromise the quality and energy demand of the operation.
According to all these results, it is possible to observe a great influence of the activation of the auxiliary traction on the hourly fuel consumption in this condition of ballasting, and therefore, as the average value of this operation (42 kg hp-1 with FWD) has a module considerably smaller than the values of the other evaluated configurations. In this way, this option makes the operation of better cost-benefit to the producer, being economically viable, because as the total work hours of this tractor is high, small differences in the hourly consumption averages can result in major savings at the end of a crop.
Montanha et al. (2011) mention that in operations such as the mechanized coffee harvester, in which the harvester has a larger mass than the tractor, it is extremely important to use the FWD in order to provide greater stability in the operation, generating greater safety and comfort for the operator. Gabriel Filho et al. (2010) cite that, depending on soil surface conditions and the use of traction, speed can be increased to increase tractor performance.
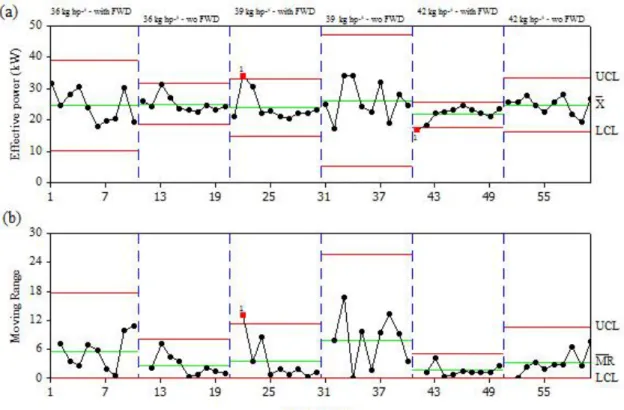
Figure 2 shows that the engine effective power showed process instability for the treatments with 39 and 42 kg hp-1, using FWD, with at least one point outside the control limits for the
FIGURE 2. Control charts for effective power in relation to power-weight 36, 39 and 42 kg hp-1. (a) Control charts of individual values. (b) Control charts of moving amplitude. UCL: Upper control limit; LCL: Lower control limit; X̅: Average of individual values; MR: Average of moving range. wo= without.
Despite the instability of the process, the treatment with 42 kg hp-1, using FWD, it was
verified the lowest effective power of the operation, using 40% of the available power of the engine in its nominal rotation, resulting in the lower energy demand of the operation, and can be considered the most adequate mass-power ratio for mechanized coffee harvester.It should be noted that the lowest and highest variability due to the coffee gathering operation occurred for the 42 kg hp-1 (with FWD) and 39 kg hp-1 (without FWD), respectively, being observed in the control charts for moving amplitude.
Seki et al. (2009), when assessing the energy demand in mechanized agricultural processes, reported that the effective power can be an indication of the energy consumption demanded in the operation, since it has a direct relation with the hourly fuel consumption. This situation may be similar to what occurred for the present study, since in the points of greatest fuel consumption there were an increase in the effective power, a fact that, when not properly identified, can make the operation performed by the mechanized group less sustainable.
CONCLUSIONS
The change in the weight-power ratio of the tractor, as well the use of auxiliary front-wheel drive, interfere directly for fuel and effective power demanded in the gathering operation.
The lowest values of the hourly fuel consumption and effective power takes place for the mass-power ratio with 42 kg hp-1 with auxiliary front-wheel drive.
The weight-power ratio 39 kg hp-1 and 42 kg hp-1 of the tractor-harvester set, without the auxiliary front-wheel drive, presents higher hourly fuel consumption and effective power of the operation.
ACKNOWLEDGEMENTS
This research was carried out with the financial support of the National Council of Scientific and Technological Development (CNPq).
REFERENCES
ALAPA - Associação Latino Americana de Pneus e Aros (2007) Manual de normas técnicas. São Paulo, ALAPA, 307p.
Baio FHR, Rodrigues AD, Santos GS, Silva SP (2013) Modelagem matemática para seleção de conjuntos mecanizados agrícolas pelo menor custo operacional. Engenharia Agrícola 33(2):402-410.
Cassia MT, Silva RP, Chioderoli CA, Noronha RHF, Santos EP (2013) Quality of mechanized coffee harvesting in circular planting system. Ciência Rural 43(1):28-34.
Dellaretti Filho O, Drumond FB (1994) Itens de controle e avaliação de processos. Belo Horizonte, Fundação Christiano Ottoni. 151p.
EMBRAPA - Empresa Brasileira de Pesquisa Agropecuária. (2006) Sistema brasileiro de classificação de solos. Brasília, Embrapa, 2 ed. 412p.
Fernandes ALT, Partelli FL, Bonomo R, Golynski A (2012) A moderna cafeicultura dos cerrados brasileiros. Pesquisa Agropecuária Tropical 42(2):231-240.
Gabriel Filho A, Lanças KP, Leite F, Acosta JJB, Jesuino PR (2010) Desempenho de trator agrícola em três superfícies de solo e quatro velocidades de deslocamento. Revista Brasileira Engenharia Agrícola Ambiental 14(3):333–339.
Léon A, Rubio G, Serna G (2005) Autoregresive conditional volatility skewness and kurtosis. The Quarterly Review of Economics and Finance 45:599-618.
Macedo DXS, Nicolau FEA, Nascimento HCF, Costa E, Chioderoli CA, Loureiro DR (2016) Operational performance of a tractor-seeder according to the velocity and working depth. Revista Brasileira Engenharia Agrícola e Ambiental 20(3):280-285.
Mialhe LG (1974) Manual de mecanização agrícola. São Paulo, Editora Agronômica Ceres. 301p.
Mialhe LG (1980) Maquinas motoras na agricultura. São Paulo, Editora da Universidade de São Paulo. 289p.
MINITAB (2007) MINITAB Release 16: Meet MINITAB 16. MINITAB StatGuide; MINITAB Help. [S.l.]
Montanha GK, Guerra SPS, Andrade-Sanchez P, Campos FH, Lanças KP (2011) Consumo de combustível de um trator agrícola no preparo do solo para a cultura do algodão irrigado em função da pressão de inflação nos pneus.Energia na Agricultura 26(1):39-51.
Monteiro LA, Lanças KP, Guerra SPS (2011) Desempenho de um trator agrícola equipado com pneus radiais e diagonais com três níveis de lastros líquidos. Engenharia Agrícola 31(3):551-560.
Montgomery DC. Control charts for variables. In: Montgomery DC, editor (2009) Introduction to statistical quality control. 6 ed. Arizona, Wiley, p226-268.
Noiman SA, Brown LD, Buja A, Rolke WR, Stine RA (2013) The power to see: A new graphical test of normality. The American Statistician 67(4):249-260.
Oliveira E, Silva FM, Salvador N, Figueiredo CAP (2007) Influência da vibração das hastes e da velocidade de deslocamento da colhedora no processo de colheita mecanizada do café. Engenharia Agrícola 27(3):714-721.
Pimentel-Gomes F, Garcia CH (2002) Estatística aplicada a experimentos agronômicos e florestais: exposição com exemplos e orientações para uso de aplicativos. Piracicaba, FEALQ. 309p.
Salvador N, Mion RL, Benez SH (2009) Consumo de combustível em diferentes sistemas de preparo periódico realizados antes e depois da operação de subsolagem. Ciência e Agrotecnologia 33(3):870-874.
Santinato F, Ruas RAA, Silva RP, Carvalho Filho A, Santinato R (2015a) Número de operações mecanizadas na colheita do café. Ciência Rural 45(10):1809-1814.
Santinato F, Ruas RAA, Silva RP, Duarte AP, Santinato R (2015b) Análise econômica da colheita mecanizada do café utilizando repetidas operações da colhedora. Coffee Science 10(3):402-411.
Seki AS, Benez SH, Silva PRA, Yano EH, Mello LMM (2009) Demanda energética nas operações mecanizadas na silagem de milho no sistema de “silo bag”. Engenharia Agrícola 29(3):424-430. Silva FM, Salvador N, Rodrigues RF, Tourino ES (2003) Avaliação da colheita do café totalmente mecanizada. Engenharia Agrícola 23(2):309-315.
Silva RP, Cassia MT, Voltarelli MA, Compagnon AM, Furlani CEA (2013) Qualidade da colheita mecanizada de feijão (Phaseolus vulgaris) em dois sistemas de preparo do solo. Revista Ciência Agronômica 44(1):61-69.
Tavares TO, Santinato F, Silva RP, Voltarelli MA, Paixão CSS, Satinato R (2015) Qualidade do recolhimento mecanizado do café. Coffee Science 10(4):455-463.
Voltarelli MA, Silva RP, Rosalen DL, Zerbato C, Cassia MT (2013) Quality of performance of the operation of sugarcane mechanized planting in day and night shifts. Australian Journal of Crop Science 7:1396-1406.