Production, 28, e20170081, 2018 DOI: 10.1590/0103-6513.170081 ISSN 1980-5411 (On-line version)
Research Article
This is an Open Access article distributed under the terms of the Creative Commons Attribution License, which
1. Introduction
The electric power sector is key to the country’s social and economic development. As it is a sector of high importance and complexity, it is up to the government to regulate and plan the system, in order to ensure the feasibility and security of supply at the lowest social costs possible. In 2014, Brazil consumed 45.7106 toe (ton of oil equivalent) of electricity, representing 18.3% of the total energy consumed in that year (Empresa de Pesquisa Energética, 2015). The electric power sector has monopoly characteristics in the transmission and distribution, and it also has a peculiar need of automatic control grid systems that allow one to obtain the balance between load and generation, that is, a constant and instantaneous balance between supply and demand, due to the fact that the cost of electric power storage is economically unfeasible. It is up to the Brazilian Electricity Regulatory Agency (ANEEL) to act as the regulator and it is up to the Brazilian Power System Operator (ONS) to control the operation (Law 9,648/98).
The energy load forecast is a vital part for the operation, expansion and electric power system’s reinforcement planning process. Described as the total energy generated by the Brazilian Interconnected Power Grid (SIN in the Portuguese acronym) power plants, the energy load considers all the energy required for supply, by the SIN, in the process of generating, transmitting and distributing electric power energy. The SIN is composed of the
Electric power load in Brazil: view on the long-term
forecasting models
Larissa Resendea*, Murilo Soaresb, Pedro Ferreirac
aFundação Getulio Vargas, Centro de Estudos de Energia (FGV Energia), Rio de Janeiro, RJ, Brasil bFlow Energia, Florianópolis, SC, Brasil
cFundação Getulio Vargas, Instituto Brasileiro de Economia (IBRE), Rio de Janeiro, RJ, Brasil *[email protected], [email protected]
Abstract
Paper aims: This paper aims to discuss how the energy load forecasts used by the System Operator and the main agents of the sector are made, and for what purposes, besides discuss the forecast deviations of the ONS’s and EPE’s models and their consequences and costs to the agents involved.
Originality: Fill a gap in the Brazilian literature when dealing with the Electric Power Load formally, and the consequences of forecast deviation used by the operator of system.
Research method: Simulations are carried out to estimate the cost of deviation, in order to assess the impact of the load forecast on the system.
Main findings: As a result, there is an urgent need to clarify forecasting methods and strategies; to avoid, by the sector agents, justifications that optimistic forecasts are necessary as security measures.
Implications for theory and practice: There are evidence that small improvements in forecasting models imply significant cost reductions.
Keywords
Electric power load. Forecast. Operations planning. Brazilian Interconnected Power System (SIN). Forecast deviation.
How to cite this article: Resende, L., Soares, M., & Ferreira, P. Electric power load in Brazil: view on the long-term forecasting models. Production, 28, e20170081. https://doi.org/10.1590/0103-6513.170081.
generation, transmission and distribution companies from the five regions of the country. The country’s total electric power production is complemented by the Isolated System, which includes small isolated systems not included in the SIN, and which represent about 1.7% of the total energy required by the country. Most isolated systems are concentrated in the Amazonian region and, therefore, have geographical difficulties regarding accessing the transmission lines of the SIN. Throughout this paper, we are considering the total energy load of the SIN, thus ignoring the Isolated System.
Energy demand forecasting is one of the most important policy tools used by the decision makers all over the world, especially for energy emerging markets, such as the Turkish where the studies on energy demand forecasting dates back to 1960s (Ediger & Akar, 2007). According to Zjavka & Snášel (2016), power load forecasting is important for an economically efficient operation and effective control of power systems and enables to plan the load of generating units. Forecasting the energy load enables the planner to study the system expansion due to the increased demand. In addition, the forecasting is also important to the other agents of the electric power sector, as it is vital for operationalization, enabling decisions with lower risks and more financial gains, also enabling better cash flows predictability, making the system more efficient overall.
Even though the load forecast plays a central role in the function of the entire electric power sector, there is a gap in the Brazilian literature about this theme and the theoretical bases that support the models used by the sector agents. Although several technical notes have been published on energy load forecasts, the methodological details that support such forecasts are generally omitted. This paper aims to encourage the reduction of this informational asymmetry, discussing the topic in a clear way and reaffirming its importance through the assessment of the costs to the sector of using low accuracy forecasts.
The context for such discussion could not be more favorable, when we experience an energy crisis environment with distribution companies with an over-contracted demand, a direct reflection of load forecast deviations made by several sector agents.
In addition to the introduction, the article is organized into 3 more sections. The second section deals with the mid- and long-term models of the energy load, critically analyzing the forecast used by ONS (Brazilian Power System Operator); discusses both the (lack of) historical assertiveness and the costs associated with these forecasts’ deviations; as well as exploring the magnitude of load forecast deviation in the Monthly Operational Program (PMO) for different forecasting horizons, simulating deviation-related costs in the scope of miscalculation of the settlement price for differences (PLD) and the minimum cost of the operation.
In the third section, a case study was carried out with the NEWAVE model, in order to evaluate the impact of the load forecasting on the system operation planning, highlighting the importance of predicting the energy demand with accuracy and always seeking improvements in the models currently in use. Finally, the fourth section presents the conclusion and suggestions for future work.
2. Critical view of the forecasting models
In a hydrothermal system, such as the Brazilian one, the availability of resources to supply the load at any future moment is not certain, which requires both the short and mid-term planning of the operation.
In this scenario, load studies are key for ONS and EPE (Energy Research Company) to understand the variables that propel electric power demand and to evaluate the size of the Brazilian national electric park and decisions regarding energy storage in hydropower plants.
Through load forecasting it is possible to optimize the planning of the electric power operation in advance to ensure the continuity of the demand supply and energy, reducing risks and costs and increasing the reliability and stability of the SIN. Load forecasting also enables studies on expansion and reinforcements and the programming of interventions in grid operation installations.
For the utilities in the electric power sector, in charge of the distribution of energy, forecasting the load is important both for the planning of their daily activities and for the planning of energy purchases, since the Brazilian energy sector model requires that 100% distribution companies demand is contracted through auctions, occurring up to five years before the resale of energy.
2.1. Short, mid and long term forecasts
(varying from 5 to 10 years ahead), where each forecast horizon is important for different types of studies on the electric power system operation.
Moreover, each forecasting horizon uses different load modeling methodologies, with the very short and short-term forecasts, which may be more abstract regarding the most important factors for forecasting, using computational methods such as fuzzy logic, neural networks, and Support Vector Machine (Barakat & Al-Qasem, 1998).
According to Ranaweera et al. (1996), neural networks have been considered an interesting application to short-term load forecasting, due to their ability to extract the relationship among input variables and output by learning from the available input-output readings. However, the method presents obstacles related to the mathematics of network specification and estimation, and also neutral networks are not easily up-datable to changing conditions (Ranaweera et al., 1996).
Fuzzy logic models have been proposed as an alternative forecasting method as it allows us to enter information by facts and rules formulated verbally by experts and describing the behavior of complex systems by using linguistic expressions (Dudek, 2016). In general, as remarks Kucukali & Cokgor (2007), fuzzy models were constructed with the aid of data processing and to achieve success with its algorithm is necessary detailed knowledge of the physical behavior of the system, under different conditions.
Another short-term method is Support Vector Machine, which is receiving attention due to implements the principle of structural risk minimization, making it have great generalization ability in the situation of small sample, but on the other hand, the difficult of selecting appropriate parameters affects its practicability (Fei et al., 2009).
Our study is intended to focus on the mid- and long-term forecasts, whose methodologies are generally motivated by statistical and economic reasons. An exception is the article Torrini et al. (2016), which proposes a logical-to-fuzzy approach for long-term forecasting of electric power consumption in Brazil. In this context, the Brazilian forecasting models, since the 1970s, tend to use Autoregressive Vectors with Deviation Correction (to consider the non-stationarity characteristic of load and demand series) as in Box & Jenkins models.
Box-Jenkins or ARIMA is basically a data-oriented approach that is adapted from the structure of the data themselves (Pai & Lin, 2005). According to one of the assumptions, the time series under study are generated from linear processes. Then, it makes it possible to analyze in detail the model and implement it (Zhang et al., 1998). However, it is important to highlight that when the time series are nonlinear, this approach may not be applied.
Regarding cointegration techniques and error-correction models (VAR-VEC), according to Bentzen & Engsted (1993), the main advantages in using these models are: i) it is possible to distinguish clearly between short- and long-run effects because both first differences and levels of the variables enter the model; ii) the speed of adjustment towards the long-run relationship can be directly estimated; iii) VAR-VECs have a sound statistical foundation in the theory of cointegration developed by Engle & Granger (1987).
In fact, the VAR-VEC approach is widely used in the most recent literature in Brazil and in the world, such as work Bentzen & Engsted (1993), which has modeled the demand for energy in Denmark in the long term using ECM modeling with GDP, energy price and temperature as explanatory variables; Andrade & Lobão (1997), which estimates the Brazilian residential consumption considering the following variables: income, electricity tariff of the sector and price of the domestic appliances; Schmidt & Lima (2004), which is based on the model of Andrade & Lobão (1997), expanding the analysis to include the commercial and industrial sectors, introducing a fuel price variable as a way to consider the effect of substitute goods on the demand of the sector.
Other similar studies include Mattos & Lima (2005), which also consider the effect of blackouts in the calculation of residential demand elasticities, Westley (1984) which analyzes residential and commercial electricity demands for the Paraguayan region using regressions by Ordinary Least Squares (OLS), Westley (1989), which estimates the commercial demand for electricity in Costa Rica from the OLS model in Two Stages (MQ2E) combined with estimates of the error components, and Viana & Silva (2014).
For the most part, such articles use the demand of each class at the national level as dependent variable. Some other studies are concerned with the estimation for some state or region, such as Mattos & Lima (2005), which estimates the residential demand in Minas Gerais, and Siqueira et al. (2006) and Irffi et al. (2009), which consider the Northeastern Region. Finally, it is also possible to find articles under panels, such as Bernstein & Griffin (2006) in the estimation for the American market.
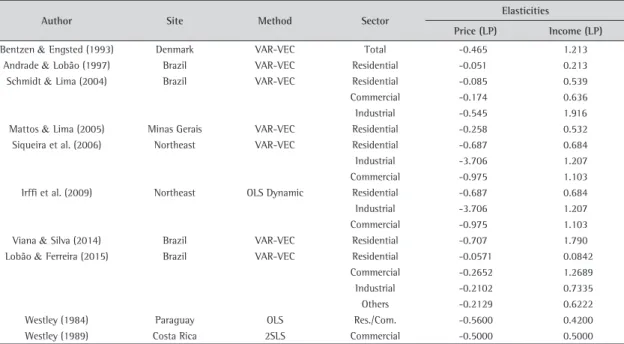
In addition to the secondary objective of an alternative proposal to predictive models already popular or of future scenarios analysis, such works tend to be concerned with the determination of demand elasticities in relation to the energy tariff and the income of the class in question. As mentioned before, such interests are justified by the informative potential of behavioral change of the demand when subject to different tax regimes and different economic realities. Since energy prices heavily influence macroeconomic variables, responses to price fluctuations are important in forecasting economic welfare impacts and efficacy of various policies (Rowland et al., 2017). Table 1 summarizes the results of the cited works that were used to estimate such elasticities.
Table 1. Summary of elasticities.
Author Site Method Sector Elasticities
Price (LP) Income (LP)
Bentzen & Engsted (1993) Denmark VAR-VEC Total -0.465 1.213
Andrade & Lobão (1997) Brazil VAR-VEC Residential -0.051 0.213
Schmidt & Lima (2004) Brazil VAR-VEC Residential -0.085 0.539
Commercial -0.174 0.636
Industrial -0.545 1.916
Mattos & Lima (2005) Minas Gerais VAR-VEC Residential -0.258 0.532
Siqueira et al. (2006) Northeast VAR-VEC Residential -0.687 0.684
Industrial -3.706 1.207
Commercial -0.975 1.103
Irffi et al. (2009) Northeast OLS Dynamic Residential -0.687 0.684
Industrial -3.706 1.207
Commercial -0.975 1.103
Viana & Silva (2014) Brazil VAR-VEC Residential -0.707 1.790
Lobão & Ferreira (2015) Brazil VAR-VEC Residential -0.0571 0.0842
Commercial -0.2652 1.2689
Industrial -0.2102 0.7335
Others -0.2129 0.6222
Westley (1984) Paraguay OLS Res./Com. -0.5600 0.4200
Westley (1989) Costa Rica 2SLS Commercial -0.5000 0.5000
Cointegration Techniques and Error-Correction Models (VAR-VEC); Ordinary Least Squares (OLS); Least Squares in Two Stages (2SLS).
At this point, as work Arsenault et al. (1995) points out, it is worth noticing that most the energy demand studies emphasize the structural characteristics of the energy demand models, where the different models are compared based on characteristics such as price and income elasticity, adjustment processes and structural changes, and not much attention is given to the accuracy of the forecast.
Regarding the types of errors associated with the use of the energy demand forecast model, Arsenault et al. (1995) emphasizes the accuracy of the explanatory variable data on the right side of the equations, the error on the model’s own structure, since the estimated coefficients are based on observations, and, finally, those random errors of the model that are considered equal to their expected values, that are assumed to be zero.
2.2. How load long and mid-term modes influence the SEB (Brazilian electric power sector)
The mid- and long-term forecast studies focus on the security and reliability of the system and the elaboration of a national strategy to expand energy supply to meet the demand. Such forecasts assess the trends in energy production and in energy usage and the different alternatives for expansion of offer, with diversification of the energy matrix and technological development.
The objective is to equate demanded and contracted energy, since contracting by the distributors happens via energy auctions, based on longer-term forecasts and therefore, less assertive. Such forecasts also enable the government to plan the auctions of new generating plants. The conduction of new energy auctions usually has a two-year minimum period, which is approximately the minimum construction time of thermoelectric, solar and wind power plants, for example.
over a 5-year horizon, such dispatch decisions consider the future energy load as deterministic and report, in addition to the optimal operational decision, the Marginal Operation Cost (CMO). In addition, it is used in the calculation of the Energy Settlement Price (PLD). The system’s PLD (Energy Settlement Price) is the shadow price associated with the demand supply constraint in the model, meaning the additional production cost of 1 MWh in the solution obtained by the model.
In considering the energy load forecast, as given in the sectoral model, any deviation in its forecast, ceteris paribus, leads to erroneous calculation of the optimum forecast of the dispatch and expansion of the system.
Thus, if the forecast is higher than the one that actually occurs, there will be a thermal dispatch above the optimal, in addition to a possible excessive expansion of the offer. Such a problem would lead to a future excess of energy offer, increasing the cost of energy to the consumer. Moreover, this high demand forecast would imply in hydro generators producing less and maybe even buying energy in the spot market to cover the undesired short position.
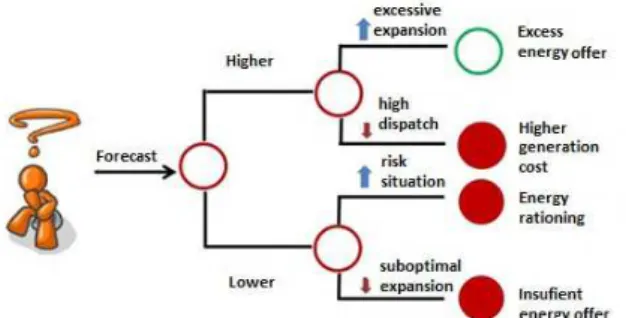
In case the load forecast is inferior to the one that actually occurs, it would result in less thermal production, and hydropower would be more used and consequently consumers would pay less as compared to previous situation. However, the optimal decision calculated by the operation planning model may lead the system to a risk situation in the future, where water reservoirs could achieve a low level. The same occurs if the impact extends to the expansion of the system, driving the system to higher chances of energy rationing and damaging economic activity, which would affect several sectors. The possible consequences of erroneous forecasts are exemplified in Figure 1.
Figure 1. Deviation cost - dispatch and expansion.
Load forecasts above the actual amount affect the consumers financially due to the high dispatch of thermoelectric power plants and possibly due to the unnecessary expansion of the system, while forecasts below the actual value put the system at risk due to the excessive depletion of reservoirs and the inadequate expansion of the system, and may even represent a future increase in consumer spending, in addition to causing severe complications in the case of energy rationing.
An example of the impact of the load deviation is in the establishing of the PLD. Used as the energy price in the short-term market, the PLD is obtained using the data deck that defines the Marginal Cost of Operation (CMO) and is used to plan the system operation, which is calculated weekly, based on the initial parameters of the dispatch optimization model at the lowest cost of operation possible.
In addition, regarding the new model of the Brazilian electric power sector, distributors are required to contract 100% of their energy. Given that there are only two hiring environments, one of which is free and the other one regulated, and the majority of agents are obliged to participate through the regulated environment, the energy utilities distribution companies are largely dependent on load forecasting to know how much energy they will need to contract in a 1, 3 and 5 year horizon. The accounting of the forecast deviation and the assessment of the assertiveness of the hiring regarding each distributor’s demand, however, is made on a monthly basis, with the settlement occurring in the short-term energy market, subject to the PLD.
It is noteworthy that there are several sources of costs to the consumers and energy agents due to a forecast deviation of the energy load. The financial impact on the Brazilian Electric Power System (SEB), as a whole, is even more complex and there are several costs that can be computed, both financial and environmental, regarding more dispatching of less clean energy sources. The next subsection explores the magnitude of the load forecast deviation in the PMO for different forecast horizons, in addition to simulating deviation costs under the misleading calculation of the PLD and of the minimum operation cost.
2.3. Forecast deviations and their financial impact on the Brazilian electric power system
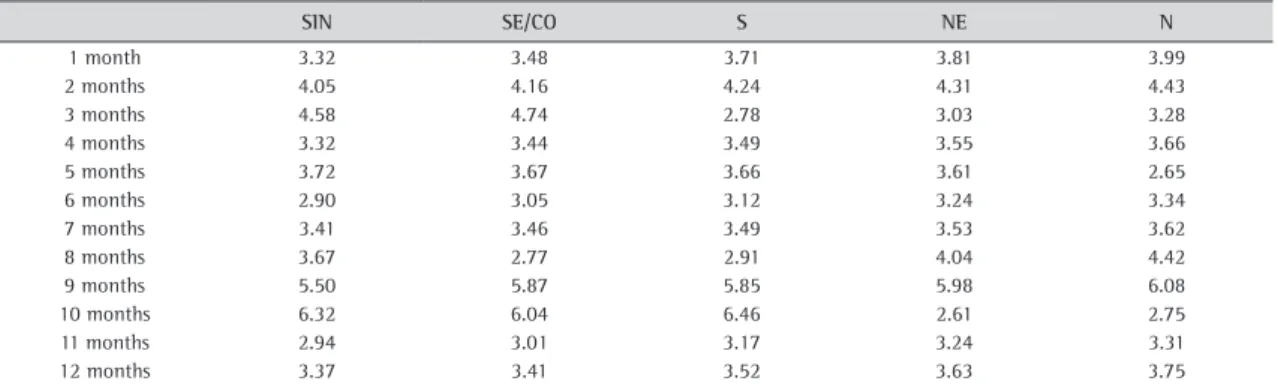
For a first check of ONS’s Energy Load forecast deviation, the mean squared deviation of forecast was calculated, considering a 1 to 12 month ahead horizon, based on the monthly PMOs from January 2007 to December 2015. For this purpose, energy load paths were created for each subsystem based on each month’s forecast.
In order to elucidate the methodology, the one month ahead forecast path of the given sub-system starts with the February 2007 load forecast, recorded in the January PMO of the same year, and ends with the January 2016 forecast, of the December 2015 PMO. The path of two months ahead forecast starts with the load forecast for March 2007 of the same year’s PMO, and ends with the forecast for February 2016 recorded in the December 2015 PMO, and so on.
Forecast horizons regarding 1 to 12 months ahead are considered, in addition to 24, 36, 48 and up to 60 months ahead. With the forecast trajectories, last value always being lower than the ones from May 2016, the RMSE was calculated, whose values are shown in Table 2. It can be noticed that the average of forecast deviation in the PMOs varies from 2.61 (10 month ahead forecast for the N subsystem) to 6.46 (10 month ahead forecast for the 3 Case Study
Table 2. Average of PMO Forecast deviations.
SIN SE/CO S NE N
1 month 3.32 3.48 3.71 3.81 3.99
2 months 4.05 4.16 4.24 4.31 4.43
3 months 4.58 4.74 2.78 3.03 3.28
4 months 3.32 3.44 3.49 3.55 3.66
5 months 3.72 3.67 3.66 3.61 2.65
6 months 2.90 3.05 3.12 3.24 3.34
7 months 3.41 3.46 3.49 3.53 3.62
8 months 3.67 2.77 2.91 4.04 4.42
9 months 5.50 5.87 5.85 5.98 6.08
10 months 6.32 6.04 6.46 2.61 2.75
11 months 2.94 3.01 3.17 3.24 3.31
12 months 3.37 3.41 3.52 3.63 3.75
Brazilian Interconnected Power System (SIN); Southeast/ Midwest (SE/CO); South (S); Northeast (NE); North (N).
In order to plan the SIN operation, the Brazilian Electric Power Sector uses a chain of coupled models that consider different planning horizons, where the coupling between the models is carried out through the function of the future cost of the energy operation and are solved through Stochastic Dual Dynamic Programming (PDDE) algorithms.
In order to evaluate the impact of load forecasting on system operation planning, a case study was carried out using the NEWAVE model. Although the planning of the operation, from an optimization point of view, is carried out with the integrated use of the NEWAVE and DECOMP models, any impact observed in the mid-term model directly affects the short-term model, which uses the future cost function of the NEWAVE model as a boundary condition. The main objective of the tests that were carried out is to show that for the same energy load - for example the one carried out for one given year - the operational policy is completely different depending on the expectation for energy demand in the other years of the study. In this sense, what is intended is to emphasize the importance of forecasting energy demand with accuracy and always looking for improvements in the models currently used.
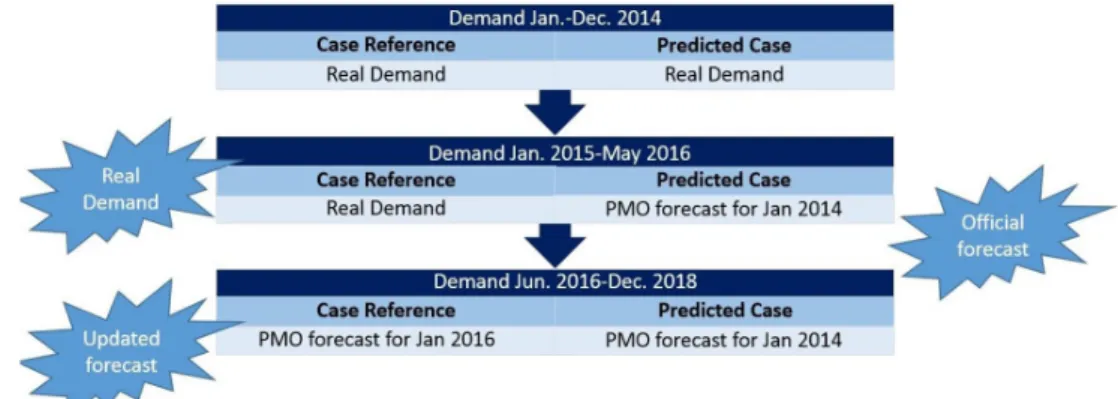
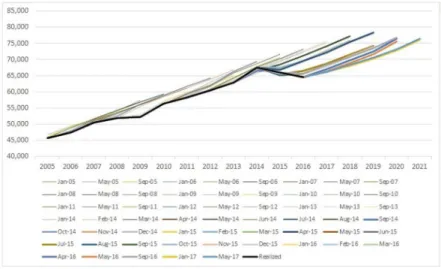
The case study was based on the Monthly Operational Program (PMO) of January 2014, of which we used the set of the NEWAVE model, whose planning horizon is from January 2014 to December 2018. The data set was changed to take into account the energy demand carried out from January to December 2014. This is the period of interest for which it is desired to observe the change in the operational policy due to the use of different forecasts demand for the 2015-2018 horizon. For this, as shown in Figure 2, the modified data set resulted in two studies:
Figure 2. Case study illustration.
• Case Reference (Real Demand 14-18): In this case, the intention for what is left of the planning period (2015-2018) is to use real demand, in order to establish a reference for the operational policy that would have been adopted had there been no uncertainties in future demand. As such study horizon encompasses months that have not yet been achieved, the demand from January/2015 to May/2016 and the PMO forecasts for May/2016 were used for the rest of the horizon, since they were the official estimate to date;
• Predicted Case (Predicted Demand 15-18): In this case, the official forecast for the January/2014 deck was maintained for the 2015-2018 horizon. In this case, whose demand in 2014 is identical to the previous case, it is desired to observe the change in the operational policy when using a forecast different from that demand actually observed.
In the real system planning, the NEWAVE and DECOMP models are updated monthly and weekly respectively, that is why the approach used is a simplification of the process, since the results of a NEWAVE run for a year are used, which would not normally done.
However, as mentioned earlier, the main objective is to show how sensitive operational policy is to the demand forecast, and not to measure precisely the impact of having used a forecast very different from the actual values, in 2014.
in the estimate of electric power consumption, when values more consistent with market expectations started being used and the optimistic view was taken away from the forecast.
In order to evaluate the operational policy with the different forecasts of demand, it was decided to show the results obtained for a simulation with 2,000 scenarios using each operative policy, always focusing on the results for 2014. Assumptions were made that the model is appropriate to the system, with no need for dispatch outside the merit of cost order. In order to meet the energy load, ONS dispatches, weekly, the thermal plants in order of merit, that is, it dispatches those that present a unit variable cost (CVU) lower than the marginal cost of operation.
The average, the 10th percentile and the 90th percentile of the marginal cost of the simulated dispatch for the two cases are presented in Figure 4. As it can noted, the expected situation occurred: with an optimistic load forecast, as in the case of Predicted Demand 15-18, the price guideline becomes higher, leading the generated PLD to became higher than it should be when the forecast was close to the actual load.
Figure 3. Official load forecast for the main PMOS.
Figure 4. Marginal cost of operation - southeast system.
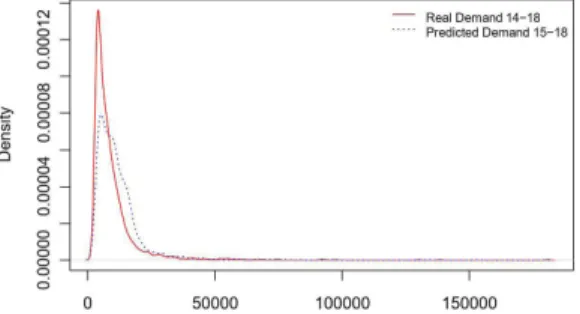
In terms of thermal generation costs, as can be seen in the simulated distribution graph for the two cases of analysis in Figure 6 and in the comparison of the average values, the percentile 10 and the percentile 90 shown in Table 4, the high cost of thermal generation calculated for the Predicted Demand 15-18 is a result of unnecessarily generated energy to meet the same demand in 2014 due to the over-estimated projection from 2015.
Table 3. Total cost of SIN’s (R$ ×106).
Aver. P10 P90
Real Demand 14-18 10135 3622 18484
Expected Demand 15-18 11711 4709 19792
Difference 1576 1087 1308
Brazilian Interconnected Power System (SIN).
Figure 5. Total cost of the SIN operation (Billions of Reais).
Table 4. Thermal generation cost (R$ ×106).
Aver. P10 P90
Real Demand 14-18 8473 4116 12124
Expected Demand 15-18 9374 4243 19253
Difference 900 127 7129
The analysis of the Spilled Energy for both cases indicates that the highest thermal dispatch, occurring in the case of Predicted Demand 15-18, results in a higher probability of spillage, which may represent a waste of resources under favorable hydrological conditions.
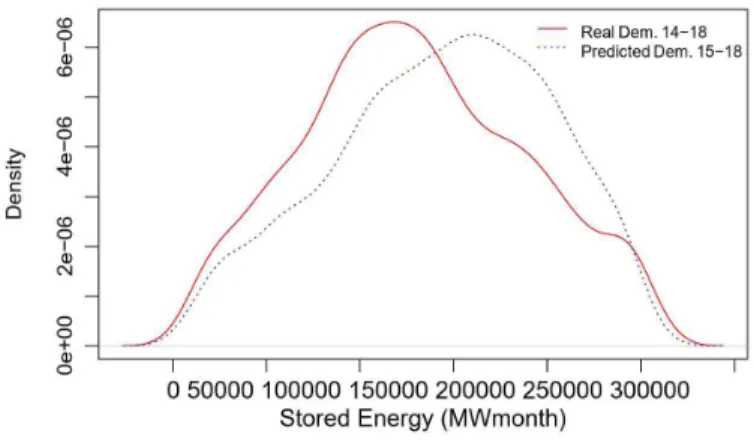
Figure 7 shows the distribution of the energies stored in November/2014 for the simulations regarding the two cases. As expected, the case in which an optimistic forecast for the future was used presented higher levels of storage, since the thermal dispatch, and consequently marginal costs, were higher in this case. Given that we now know the hydrological shortage experienced in the period of 2014, it could be argued that the use of an optimistic forecast for the demand ultimately would have had a positive effect, since the thermal dispatch was higher, if compared to the one we would have had if the forecast of demand had been the real one, and the operation by order of merit, more secure. However, such a combination of factors can only be seen as a
coincidence and, from the point of view of the uncertainty of demand alone, this difference in operational policy means the unnecessary use of resources, higher costs for society and, in cases where the system shows higher levels of storage, higher spillages.
In general, the argument that the use of optimistic load forecasts in the operation planning would work as a risk aversion and that a positive view is desirable in mid-term forecasts, in our point of view, does not work, since the nature of the uncertainties is very different, and there are already specific methodologies for considering risk aversion in the optimization models with results already demonstrated in several works, such as Shapiro (2011); Philpott & Matos (2012); Shapiro et al. (2013a); Maceira et al. (2015). In addition, the uncertainty regarding demand forecasting was addressed in the PDDE context in Shapiro et al. (2013b), when the impact of the forecast deviation was taken into account in the operational policy calculation of the mid-term model, which could be incorporated into the official methodology currently used.
Set for the first time in Brazil in 1931 and decreed as permanent in 2008, the “Horário de Verão (HV)” – Daylight Saving Time –, which consists of advancing clocks by one hour, aiming at the best use of the daylight during the summer, has as a main objective a decrease in the demand in the hours of higher consumption and, as a consequence, results in a higher security in the SIN operation and a more efficient energy supply to the population.
By way of comparison, according to data from Operador Nacional do Sistema Elétrico (2015), the implementation of 2014/2015 HV in the SE/MW and S regions provided an energy saving of around 265 MWaver, which translates into storage gains of 0.4% and 1.3% of the Maximum Storage Energy of the SE/MW and S subsystems, respectively. Regarding financial economy, according to data from Operador Nacional do Sistema Elétrico (2015), if not for the unfavorable hydrological conditions during the period of the HV that led ONS to adopt the policy of establishing the full generation dispatch in the thermal plants, preserving the storage in the reservoirs, the HV would provide the gains regarding the avoided cost to circumvent risks in equipment under normal operating regime, resulting in benefits of R$150.5 million, with the reduction of thermal generation for electric power security reasons, during the 2014/2015 HV period. The gains related to the rationalization of investment in generation and/or transmission for the supply to the load increase in the summer period, can be represented by the investment cost avoided in the construction of gas-fired thermal plants (US$750/Kw) to supply the peak load demand, equivalent to approximately US$ 2 billion or R$5 billion in the SIN (Operador Nacional do Sistema Elétrico, 2015).
Observing the differential of the Total Cost of the SIN Operation shown in this case study, when comparing the current forecast considered by ONS and the one that could be a result of a more load adequate forecast, it is possible to foresee that the latter would possibly result in savings of the same or higher significance than that one resulting from HV. This reinforces the importance of investing in a more robust energy load model in the Brazilian electric power system.
Next, some additional comments are made for the reader who has been following the Brazilian Electric Power Sector closely throughout 2014. The first comment concerns the high values of marginal costs of the operation (and consequently the PLD) observed during this year, not reflected in this study. The reason why high marginal costs were observed is directly related to the hydrological shortage observed mainly during this year’s wet period, a factor that is not part of the scope of this study, and which must be treated in a different
way, not related to the forecast of demand. The second concerns the existence of dispatches outside the order of merit, which are those used by ONS to add even more security to the system than that already incorporated by the Optimization models decision. Such dispatches are also disregarded and out of the scope of this study, motivated by the unfavorable hydrology observed in this period. Both factors, although left aside in the present study, do not invalidate the main objective, which is to show the change in operational policy observed with the use of different forecasts, when comparing a same period of operation with the same actual demand.
3. Conclusion
The present study prompted a discussion on the mid- and long-term forecast models of the energy load, making a critical analysis of the forecast used by ONS, in addition to exploring the dimension of the PMO load forecast deviation, simulating the deviation costs. As well, a case study was carried out with the NEWAVE model, in order to assess the impact of load forecasting on the planning of the system operation.
The relevance of this study overrides criticism, concerning the forecasts always being above those carried out by regulators. In fact, this study should raise three important aspects with the capacity to assist in the planning and operation of the sector, as well as to maximize the low tariff, namely: (a) the urgent need to clarify the models and strategies used for load forecasting; (b) justify that the always optimistic forecast as a security instrument for the sector does not seem appropriate. There are several instruments for this purpose, such as Shapiro (2011); Philpott & Matos (2012); Shapiro et al. (2013a); Maceira et al. (2015). If they fail in this task, new instruments must be developed and the methodology must be clear to the agents.
Finally, (c) we show that a slight improvement in the load forecast implies significant cost reductions, thus investing in the improvement of forecasting models becomes relevant. It is important to test, for example, (i) the inclusion of the long-term dependency in the models (co-integration); (ii) the use in the modeling of the rich information on the distributors’ consumption and; (iii) to think of other variables that can better explain the load, for example, to correlate it, not with GDP, but with the potential GDP, which can be reflected in more parsimonious forecasts.
References
Andrade, T. A., & Lobão, W. J. (1997). Elasticidade renda e preço da demanda residencial de energia elétrica no Brasil. Brasília: Instituto de Pesquisa Econômica Aplicada.
Arsenault, E., Bernard, J.-T., Carr, C., & Genest-Laplante, E. (1995). A total energy demand model of Québec: forecasting properties. Energy Economics, 17(2), 163-171. http://dx.doi.org/10.1016/0140-9883(94)00003-Y.
Barakat, E., & Al-Qasem, J. (1998). Methodology for weekly load forecasting. IEEE Transactions on Power Systems, 13(4), 1548-1555. http://dx.doi.org/10.1109/59.736304.
Bentzen, J., & Engsted, T. (1993). Short-and long-run elasticities in energy demand: a cointegration approach. Energy Economics, 15(1), 9-16. http://dx.doi.org/10.1016/0140-9883(93)90037-R.
Bernstein, M. A., & Griffin, J. M. (2006). Regional differences in the price-elasticity of demand for energy. Washington: U.S. Department of Energy. http://dx.doi.org/10.2172/877655.
Chern, W. S., & Just, R. E. (1982). Assessing the need for power: a regional econometric model. Energy Economics, 4(4), 232-239. http://dx.doi.org/10.1016/0140-9883(82)90003-2.
Dudek, G. (2016). Pattern-based local linear regression models for short-term load forecasting. Electric Power Systems Research, 130, 139-147. http://dx.doi.org/10.1016/j.epsr.2015.09.001.
Ediger, V., & Akar, S. (2007). ARIMA forecasting of primary energy demand by fuel in turkey. Energy Policy, 35(3), 1701-1708. http:// dx.doi.org/10.1016/j.enpol.2006.05.009.
Engle, R. F., & Granger, C. W. (1987). Co-integration and error correction: representation, estimation, and testing. Econometrica, 55(2), 251-276. http://dx.doi.org/10.2307/1913236.
Empresa de Pesquisa Energética – EPE. (2015). Balanço Energético Nacional (BEN). Brasília.
Fei, S., Wang, M.-J., Miao, Y., Tu, J., & Liu, C. (2009). Particle swarm optimization-based support vector machine for forecasting dissolved gases content in power transformer oil. Energy Conversion and Management, 50(6), 1604-1609. http://dx.doi.org/10.1016/j. enconman.2009.02.004.
Ferreira, P. G. C., Oliveira, F. L. C., & Souza, R. C. (2015). The stochastic effects on the Brazilian electrical sector. Energy Economics, 49, 328-335. http://dx.doi.org/10.1016/j.eneco.2015.03.004.
Irffi, G., Castelar, I., Siqueira, M. L., & Linhares, F. C. (2009). Previsão da demanda por energia elétrica para classes de consumo na região nordeste, usando OLS dinâmico e mudança de regime. Economia Aplicada, 13(1), 69-98. http://dx.doi.org/10.1590/S1413-80502009000100004.
Kucukali, S., & Cokgor, S. (2007). Fuzzy logic model to predict hydraulic jump aeration efficiency. Proceedings of the Institution of Civil Engineers: Water Management, 160(4), 225-231. http://dx.doi.org/10.1680/wama.2007.160.4.225.
Maceira, M. E. P., Marzano, L., Penna, D. D. J., Diniz, A., & Justino, T. (2015). Application of CVAR risk aversion approach in the expansion and operation planning and for setting the spot price in the Brazilian hydrothermal interconnected system. International Journal of Electrical Power & Energy Systems, 72, 126-135. http://dx.doi.org/10.1016/j.ijepes.2015.02.025.
Mattos, L. B., & Lima, J. E. (2005). Demanda residencial de energia elétrica em Minas Gerais: 1970-2002. Nova Economia, 15(3), 31-52. http://dx.doi.org/10.1590/S0103-63512005000300002.
Operador Nacional do Sistema Elétrico – ONS. (2015). Benefícios da implantação do horário de verão 2014/2015. Brasília.
Pai, P.-F., & Lin, C.-S. (2005). A hybrid ARIMA and support vector machines model in stock price forecasting. Omega, 33(6), 497-505. http://dx.doi.org/10.1016/j.omega.2004.07.024.
Philpott, A., & Matos, V. (2012). Dynamic sampling algorithms for multistage stochastic programs with risk aversion. European Journal of Operational Research, 218(2), 470-483. http://dx.doi.org/10.1016/j.ejor.2011.10.056.
Ranaweera, D., Hubele, N., & Karady, G. (1996). Fuzzy logic for short term load forecasting. International Journal of Electrical Power
& Energy Systems, 18(4), 215-222. http://dx.doi.org/10.1016/0142-0615(95)00060-7.
Rowland, C. S., Mjelde, J. W., & Dharmasena, S. (2017). Policy implications of considering pre-commitments in us aggregate energy demand system. Energy Policy, 102, 406-413. http://dx.doi.org/10.1016/j.enpol.2016.12.041.
Schmidt, C. A. J., & Lima, M. A. (2004). A demanda por energia elétrica no Brasil. Revista Brasileira de Economia, 58(1), 68-98. http:// dx.doi.org/10.1590/S0034-71402004000100004.
Shapiro, A. (2011). Analysis of stochastic dual dynamic programming method. European Journal of Operational Research, 209(1), 63-72. http://dx.doi.org/10.1016/j.ejor.2010.08.007.
Shapiro, A., Tekaya, W., Costa, J. P., & Soares, M. P. (2013a). Risk neutral and risk averse Stochastic Dual Dynamic Programming method. European Journal of Operational Research, 224(2), 375-391. http://dx.doi.org/10.1016/j.ejor.2012.08.022.
Shapiro, A., Tekaya, W., Soares, M. P., & Costa, J. P. (2013b). Worst-case expectation approach to optimization under uncertainty. Operations Research, 61(6), 1435-1449. http://dx.doi.org/10.1287/opre.2013.1229.
Siqueira, M. L., Cordeiro, J. R. H., & Castelar, I. (2006). A demanda por energia elétrica no nordeste brasileiro após o racionamento de 2001-2002: previsões de longo prazo. Pesquisa e Planejamento Economico, 36(1), 137-178.
Torrini, F. C., Souza, R. C., Oliveira, F. L. C., & Pessanha, J. F. M. (2016). Long-term electricity consumption forecast in Brazil: A fuzzy logic approach. Socio-Economic Planning Sciences, 54, 18-27. http://dx.doi.org/10.1016/j.seps.2015.12.002.
Viana, G., & Silva, A. L. M. (2014). Um modelo para projeções para demanda por energia elétrica, 2009-2017 para o setor residencial no Brasil. Revista Brasileira de Energia, 20, 107-126.
Westley, G. D. (1984). Electricity demand in a developing country. The Review of Economics and Statistics, 66(3), 459-467. http:// dx.doi.org/10.2307/1925002.
Westley, G. D. (1989). Commercial electricity demand in a Central American economy. Applied Economics, 21(1), 1-17. http://dx.doi. org/10.1080/772284227.
Zhang, G., Patuwo, B. E., & Hu, M. Y. (1998). Forecasting with artificial neural networks: the state of the art. International Journal of Forecasting, 14(1), 35-62. http://dx.doi.org/10.1016/S0169-2070(97)00044-7.