463
Abstract
The current developments with unmanned aerial vehicles (‘UAVs’) are revolution-izing many fields in civil applications, such as agriculture, environmental and visual inspections. The mining industry can also benefit from UAVs in many aspects, and the reconciliation through topographic control is an example. In comparison with tradi-tional topography and maybe modern techniques such as laser scanning, aerial photo-grammetry is cheaper, provides faster data acquisition and processing, and generates several high-quality products and impressive level of details in the outputs. However, despite the quality of the software currently available, there is an uncertainty intrinsic to the surfaces acquired by photogrammetry and this discrepancy needs to be assessed in order to validate the techniques applied. To understand the uncertainty, different surfaces were generated by UAVs for a small open pit quarry in southern Brazil. Well-established topographic surveying methodologies were used for geolocation support and comparison, namely the RTK (real-time kinetic) global navigation satellite sys-tem (GNSS) (here called conventional method) and laser scanning. The results showed consistency between the UAV surfaces with a few outliers in when vegetation, water and mobile objects during the flight missions. In comparison with the laser-scanned surface, the UAV results were less erratic surrounding the RTK points, showing that surfaces generated by photogrammetry can be a simpler and quicker alternative for mining reconciliation, presenting low uncertainty when compared to conventional methods.
Keywords: reconciliation, topography, UAV, photogrammetry, laser scanning. Filipe Beretta
http://orcid.org/0000-0002-1846-0465 Doutorando
Universidade Federal do Rio Grande do Sul – UFRGS Departamento de Engenharia de Minas
Porto Alegre - Rio Grande do Sul - Brasil [email protected]
Henrique Shibata Doutorando
Universidade Federal do Rio Grande do Sul – UFRGS Departamento de Engenharia de Minas Porto Alegre - Rio Grande do Sul - Brasil [email protected]
Rodrigo Cordova Mestrando
Universidade Federal do Rio Grande do Sul – UFRGS Departamento de Engenharia de Minas
Porto Alegre - Rio Grande do Sul - Brasil [email protected]
Rodrigo de Lemos Peroni Professor Associado
Universidade Federal do Rio Grande do Sul - UFRGS Departamento de Engenharia de Minas Porto Alegre - Rio Grande do Sul - Brasil [email protected]
Jeremias Azambuja Mestrando
Universidade Federal do Rio Grande do Sul – UFRGS Departamento de Engenharia de Minas
Porto Alegre - Rio Grande do Sul - Brasil [email protected]
João Felipe Coimbra Leite Costa Professor Titular
Universidade Federal do Rio Grande do Sul - UFRGS Departamento de Engenharia de Minas Porto Alegre - Rio Grande do Sul – Brasil [email protected]
Topographic modelling using
UAVs compared with traditional
survey methods in mining
Mining
Mineração
have been intensely developed for civil applications during the last few decades (Valavanis, 2007). Recently, many com-mercial gadgets allowed the popularization of new technologies and the increasing number of operators and fields of use. The light weight, battery autonomy, sensors improvements and miniaturization made the UAV application not only possible, but accessible for different applications (Herbst et al., 2016). Mining industry benefits from several developments using photogramme-try, such as geomorphology identification (Hugenholtz et al., 2013; Westoby et al., 2012; Javernick et al., 2014), rock mechan-ics (Salvini et al., 2016), targeting (Nishar et al., 2016), among others. Topographic modelling is one of the applications for the mining industry and it is used for mineral
certainty in mining reconciliation is the topographic model updating (Câmara et al., 2013), which demands that corrections be made on planning and/or operations. Nevertheless, due to elevated costs and time consumption, the surveying frequency might be sparse and, in some cases, can take months without a feedback from the opera-tions. An alternative way to increase the fre-quency of topography updating is through use of photogrammetry-based surfaces, acquired by UAVs and processed by specific software. Wheatstone (1838) developed an optical methodology for three-dimensional interpretation of models created from 2-D images. A few years later, Laussedat pres-ents the idea of photogrammetry and the multi-images model for larger areas (Guil-hot, 2006), introducing the stereoscopy
et al., 2016; Turner et al., 2014 and Lucieer et al., 2014) and others use the methodology in quarries (Shahbazi et al., 2015; Rossi et al., 2017). A certain degree of uncertainty associated with the image acquisition is expected (Colomina and Molina, 2014), such as lenses distortion, GPS imprecision, vegetation density, light glowing or shading and water reflection.
To quantify the uncertainty gener-ated by the new technology, this article compares digital surface models (‘DSM’) generated by photogrammetry using UAVs with those generated using traditional tech-niques. The surface models were generated for a quarry area in southern Brazil. Well-known topography techniques were used to assess the error of the photogrammetric model by comparison.
2. Materials and methods
Two UAVs were used for the aerial surveying. The aircraft models were two
quadcopters Phantom 3 and Phantom 4, both manufactured by DJI®, with original
cameras and GPS devices. Their technical specifications are shown on Table 1.
Specifications Phantom 4 Phantom 3
Weight (g) 1380 1280
Max speed (m/s) 20 16
Gimbal stabilization 3-axis 3-axis
Sensor 1 / 2.3” (CMOS) 12.4 Mpx 1 / 2.3” CMOS 12.4 Mpx
Lens FOV 94° FOV 94° Table 1Equipment technical specifications. During the flight, the images
over-lapping was set at 80% to maintain high definition and confidence levels for the photogrammetry process, allowing some images to be discarded when necessary. The software used for flight mission planning and control was Pix4Dcapture, a freeware available for mobile devices. The acquired images were processed using AgiSoft PhotoScan® v 1.2.6. The software was used to orient the pictures and recreate the topography through the point cloud generation, based on the homologous points in two or more images oriented by known ground points. The area was di-vided to comprise the portions with higher images overlapping, and also to reduce the non-interesting areas with vegetation cover
which could introduce differences between the surfaces.
To reference the mapping and to assess the quality of the model reconstruc-tion, a number of ground control points (GCPs) were taken by a GNSS system based on an RTK technique, model Trim-ble R4, and the points were also used as input for correcting small imprecisions on the mesh created with the images. In total, 14 ground control points were located with the RTK and used as georeference bench-marks and for adjustment of the DSMs.
Due to the vertical precision of the equipment and the geoid model adopted, RTK was also used to survey hundreds of additional points, which could be used as real benchmarks for quality check. A
Topcon’s laser scanner model GLS-1000 was used to survey points every 20 cm and generate a surface for comparisons, as its use in the mining industry has been popular for more than a decade.
465
Figure 1 A processed DSM resulting from UAV photogrammetry showing the control points in red and the laser scanner base points in yellow.
The RTK points were also used for visual quality check, but no surface was generated as the number of points is considerably small and cannot be
com-pared with DSMs generated from several thousands of points. The error among the RTK points, assumed as real, and the DSMs was measured by projecting these
points on each surface, preserving the XY plan coordinates. The new elevations for the five surfaces were compared against the 680 RTK original points (Figure 2).
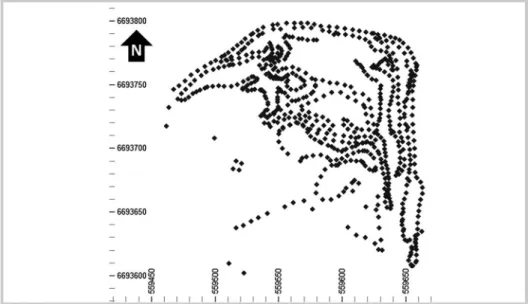
Figure 2 RTK original points distribution in plan view.
For each DSM, the absolute dif-ferences were computed and statistically analyzed. The average error, the mean
absolute disturbance, which is the sum of the errors in moduli divided by the number of points, mean squared deviation and
slope of regression between the original points and the projected elevations are shown in Table 2.
Table 2 Statistical results for the deviations (error) between each surface against the surveyed hard data.
Equipment Mission Aver. error (m) Mean absolute deviation (m) Mean squared deviation (m²) regression Slope of
Phantom 3 Vertical Images 0.007 0.064 0.80 0.9957 70 degrees Images 0.061 0.065 1.21 0.9935
Figure 3
Histogram of differences between the elevations of the RTK points and their equivalent location at the resulting surface.
3. Results and discussion
It is noteworthy that the surface built from the laser-scanned point cloud shows the poorest adherence when com-pared to the other results. Laser scan-ning has been widely used in the last decade and it is recommended for many precision applications with broadly validated method. But despite being made from three different shoot bases,
the laser scan application suggests that additional shoot bases would attenuate the extreme discrepancies. The long distances and the differences in height possibly shaded some areas such as in-accessible bench berms. However, the process of adding point clouds is time and computational consuming.
A visual check was performed to
467
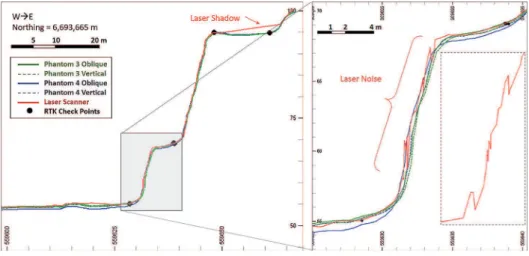
Figure 4 Vertical section with the five DSMs and their distances to the points assumed as real.
The biggest distortions for the UAV surfaces are observed in planar areas and the oblique photos potentiate this effect. The results suggest that vertical photogrammetry produces more accu-rate surfaces for the same equipment and conditions because every statistic analysed shows better fit for the DSMs generated with images acquired vertically, when compared with oblique photos taken at 70 degrees’.
Therefore, the most adherent sur-faces were originated from the vertical missions of both UAVs, which showed very similar statistical and visual results. The vertical photos from Phantom 3 show smaller average error and minimum mean
square deviation and a higher slope of regression (Table 2). Hence, from those DSMs, the one built from Phantom 3 vertical photos was selected as the most accurate and it was used for further com-parisons with all other surfaces, made in pairs with the one taken as the reference. James et al. (2017) used Monte Car-lo simulations to quantify the uncertainty related to the surface models. Although there are other publications that make suggestions to minimize systematic errors, the intention presented here is to show the divergencies among techniques for quick and low-cost topographical surveying to be applied by small mining companies. The objective is not to correct errors, but
to assess the discrepancies and highlight the effects of settings.
To compare the elevations obtained with each flight mission, it was necessary to regularize the point clouds obtained. Using a script developed to compare pairs of grids (each of them representing a surface), the surfaces were sampled and compared at regularly spaced grids (1 m x 1 m), so that the elevation was the only variable for the sampled points from this regular mesh. The algorithm uses the XY plan to needle the surfaces and record the Z interception value. Figure 5 shows the sampled regular grid from the surface originated with Phantom 3 and vertical photos.
The reference grid was indi-vidually compared against the others through maps and histograms of the deviations for every regularly spaced
point of the grid. Figure 6 shows the visual results for the comparisons. All scales were limited between -/+1 m of absolute differences between a pair
of surfaces. The spot discrepancies on the middle left represent moving equipment and buildings.
Figure 6
Maps of the deviations in comparison with the P3
vertical assumed as reference surface.
The comparison between the refer-ence surface and the one built from the scanned points clearly shows the largest discrepancies. This fact is attributed to the laser scanner limitations at large distances, typical of open pit areas. Even scanning from different bases, many areas show a sparse number of points, due to eclipsing and/or longer distances from the emission bases. Areas with the largest discrepancies are the same ones with a lesser number of data for the laser scanner and, consequently, longer
triangle edges.
Moving objects is another source of differences, even when considering the two closest results (P3 and P4 verti-cal photos). Flight missions made with a time-lapse difference detected vehicles and other moving equipment at different locations. The areas with these differ-ences could be manually classified in the software and were not processed, but for the purpose of showing and justifying the impacts, no filter was applied. Vertical or sub-vertical walls also tend to result in
local discrepancies for vertical distances between surfaces. This explains how buildings, poles and slope faces present higher divergences.
For the images previously shown in Figure 6, the statistical comparisons between the selected DSM (Phantom 3 Vertical) against all the others are shown in Figure 7, the histograms of the differences were also limited to show the most important deviations, as the outer values represent moving objects, sub-vertical walls, vegetation, etc.
Figure 7
Histograms of the deviations
in comparison against the base surface.
With the mean of 0.03 m, the differ-ences between both surfaces from vertical imagery showed the smallest standard de-viation (0.30 m), which indicates that areas
with a lesser pair of points have big discrep-ancies and those with higher values are in vegetation or shaded portions, as previously observed in Figure 6. For the oblique photos,
the resulting DSMs show higher and more consistent biased errors. The charts were truncated to evidence the differences around zero. However, extreme discrepancies were
(a) (b)
469 observed in all surfaces, mainly in vegetation,
suspended objects, shaded and flooded areas that could not be distinguished from others.
Extreme discrepancies of more than 15 m were observed in vegetation areas between laser scanned points and vertical photos for
Phantom 4. Between the DSMs of vertical cameras, the extreme values also exist, but are not consistent throughout the area.
4. Conclusions
The DSMs created from two air-crafts in two different configurations each, showed acceptable discrepancies between themselves. When compared against reliable data acquired from tradi-tional topography surveying, the surfaces showed different levels of deviation in elevation and the photos acquired in missions with vertical cameras showed more consistent surfaces than the oblique ones. In addition, the surface built from points surveyed with laser scanner was more erratic and showed several extreme error values in comparison with the most accurate surface.
The laser-scanned points were af-fected by occlusions due to slope crests or other objects, water reflexion and even suspended dust. To correct these prob-lems, high performance computers, more shooting points and a huge number of
data would need to be acquired and post-processed, which characterizes a weakness of this widely used method.
The different flights taken using Phantom 3 and Phantom 4 demonstrated consistency. The differences presented in the maps and error histograms showed a small dispersion considering the applica-tion. The study area was mainly made of blasted rock and irregular surfaces that might present variations depending on the orientation of cameras and positioning of the RTK when compared to the point cloud reconstruction.
The level of details given by the UAVs photogrammetric techniques proved to be more accurate, dense in informa-tion and faster when compared to tra-ditional methods (GPS point survey) or even modern and so called high definition techniques (e.g. laser scanner). The point
cloud generated by photogrammetry was as dense as the LS and the points received their respective RGB colours from the images taken. The high quality outputs, such as orthophoto, point cloud, contours, DSM, photos itself and movies for the-matic purposes can be quickly produced. The small aircrafts and cameras used in this study showed better performance when compared to traditional methods and/or the more sophisticated techniques. The differences observed in the elevations were within the acceptable level of varia-tion given that the mining locavaria-tion is an area of constant movement of material and there is a large amount of irregulari-ties and loose material in the pit surface. For further work, it is suggested that the resulting quality, processing speed, opera-tional implementation and products can be investigated using different techniques.
References
CÂMARA, T., FONTOURA, D., PERONI, R., CAPPONI, L. Controlling dilu-tion and mine planning. In: APCOM SYMPOSIUM APPLICATIONS OF COMPUT-ERS AND OPERATIONS RESEARCH IN THE MINERAL INDUSTRY, 36. Porto Alegre: FLE, 2013. p. 1–10.
COLOMINA, I., MOLINA P. Unmanned aerial systems for photogramme-try and remote sensing: a review. ISPRS Journal Of Photogrammetry And Remote Sensing, v. 92, p. 79–97, 2014.
EISENBEISS, H. UAV photogrammetry. Dresden University of Technology, 2009.
236 p. (Ph. D. Thesis).
ELTNER, A., KAISER, A., CASTILLO, C., ROCK, G., NEUGIRG, F., ABEL-LAN, A. Image-based surface reconstruction in geomorphometry - merits, limits and developments. Earth Surface Dynamics, v. 4, p. 359-389. 2016.
GUILHOT, N. La photographie terrestre en France: une technique de transition.
Le Monde des Cartes. v. 188, p. 22-29. 2006.
HERBST, S., WORTMANN, G., HORNUNG, M. Conceptual design studies of vertical takeoff and landing remotely piloted aircraft systems for hybrid missions.
CEAS Aeronautical Journal, v. 7, n.1, p. 135–48, 2016.
HUGENHOLTZ, C. H., WHITEHEAD, K., BROWN, O., BARCHYN, T., MOORMAN, B., LECLAIR, A., RIDDEL, K., HAMILTON, T. Geomorphological mapping with a small unmanned aircraft system (SUAs): feature detection and accuracy assessment of a photogrammetrically-derived digital terrain model. Geomorphology,
v. 194, p. 16–24, 2013.
JAVERNICK, L., BRASINGTON, J., CARUSO, B. Modeling the topography of shallow braided rivers using structure-from-motion photogrammetry. Geomorphology,
v. 213, p. 166–82, 2014.
JAMES, M., ROBSON, S., SMITH, M. 3-D uncertainty-based topographic change detection with structure-from-motion photogrammetry: precision maps for ground control and directly georeferenced surveys. Earth Surface Processes and Lanforms,
v. 42, p. 1769-1788, 2017.
Received: 16 May 2017 - Accepted: 13 April 2018.
tonomous unmanned aircraft. Journal Of System Design And Dynamics, v. 1, n.2, p.
120–128, 2007.
ROSSI, P., MANCINI, F., DUBBINI, M., MAZZONE, F., CAPRA, A. Combin-ing nadir and oblique UAV imagery to reconstruct quarry topography: methodology and feasibility analysis. European Journal of Remote Sensing, v. 50, p. 211-221, 2017.
SALVINI R., ESPOSITO G., MASTROROCCO G., SEDDAIU M. Using a remotely piloted aircraft system (RPAs) to analyze the stability of a natural rock slope.
EGU General Assembly 2016. Vienna, v. 18, p. 4409-4416, 2016.
SHAHBAZI, M., SOHN, G., THÉAU, J., MÉNARD, P. UAV-based point cloud generation for open-pit mine modelling. In: INTERNATIONAL CONFERENCE OF UNMANNED AERIAL VEHICLES IN GEOMATICS, 2015, Toronto. 2015.
TURNER, D., LUCIEER, A., WALLACE, L. Direct georeferencing of ultrahigh-resolution UAV imagery. IEEE Transactions on Geoscience and Remote Sensing,
v. 52, p. 2738-2745, 2013.
VALAVANIS K. Advances in unmanned aerial vehicles: state of the art and the road to autonomy. Tampa, Florida: Springer, 2007. 552p.
WHEATSTONE, C. On some remarkable, and hitherto unobserved, phenomena of binocular vision (Part the first). Philosophical Transactions of the Royal Society of London. 1838:371-94, 1838.