TADAYUKI YANAGI JUNIOR
PARTIAL SURFACE WETTING TO RELIEVE ACUTE THERMAL STRESS OF LAYING HENS
A dissertation presented to Federal University of Viçosa in partial fulfillment of the requirements of Agricultural Engineering
TADAYUKI YANAGI JUNIOR
PARTIAL SURFACE WETTING TO RELIEVE ACUTE THERMAL STRESS OF LAYING HENS
A dissertation presented to Federal University of Viçosa in partial fulfillment of the requirements of Agricultural Engineering
Program for obtaining the degree of “Doctor Scientiae”.
APPROVED: February 28, 2002
Prof. Fernando C. Baêta Prof. Guido S. Damasceno (Committee Member) (Committee Member)
Prof. Hongwei Xin Prof. Richard S. Gates
This work is dedicated to my dear mother Conceição
ACKNOWLEDGMENTS
Firstly, I would like to thank my advisers, Dr. Ilda de Fátima Ferreira Tinôco (Federal University of Viçosa, Brazil) and Dr. Hongwei Xin (Iowa State University, U.S.A.) for their knowledgeable supervision, encouragement and warm friendship throughout this research.
My deepest acknowledgments goes to my ex-adviser, Dr. Guido de Souza Damasceno, for his supervision, valorous advices, unquestionable support and warm friendship, during most part of my Doctorate training at the Federal University of Viçosa.
A special word of gratitude goes to Dr. Richard S. Gates (University of Kentucky, U.S.A.) for his scientific expertise assistance during all phases of this work, for his critical review of the manuscripts, and for his friendship.
I am especially appreciative of Dr. Fernando da Costa Baêta for his support and friendship during my study.
Sérgio Zolnier, Mauro Aparecido Martinez, and Lêda Rita D'Antonino Faroni. The last two professors were respectively responsible for the approval and for the extension of my training in U.S.A.
To the former and current head of the Department of Mathematics and Physics and the president of the Federal University of Lavras, Agostinho Roberto de Abreu, Ruben Delly Veiga and Fabiano Ribeiro do Valle, respectively. Their support was imperative to making this training possible.
It was a great pleasure to work with my fellow graduate students Sandra Regina, Carlos Moisés and Rolf Jentzsch at Federal University of Viçosa, and Bin Shao, Manuel Puma and Justin Chepette at Iowa State University. It was a great experience to share knowledge and experiences with friends with rich academic and cultural background.
My thanks go further to my friends Ivano and Flávia, Solenir and Rogério, Luis Gonsaga and Maria Ester, Bergson Cavalcanti and Tomásia, Olívio Bahia and Tânia, Meire Berbet and Sérgio, José Luiz, Leila Leal, Danilo Filho and others. I would like to thank the secretaries of the Department of Agricultural Engineering of Federal University of Viçosa, as well as of the Agricultural Engineering and Biosystems Department of Iowa State University.
I am very thankful to the CAPES Agency and the Federal University of Lavras for their financial support that gave me this singular opportunity.
Funding for this research was partially provided by the US Poultry and Egg Association and the CAPES Foundation and is acknowledged with gratitude.
BIOGRAPHY
TADAYUKI YANAGI JUNIOR, son of Tadayuki Yanagi and Conceição Aparecida Yanagi, was born on October 5th, 1968, in Boa Esperança, Minas Gerais State, Brazil.
In December 1992, the author received his B.S. degree in Agricultural Engineering at the Federal University of Lavras, Lavras, Minas Gerais State, Brazil. During the undergraduate program, he worked as a teaching and research assistant with scholarship provided by the University and by the CAPES Foundation (“Coordenação de Treinamento de Pessoal de Nível Superior”).
In August 1995, the author received his Master of Science degree in Agricultural Engineering at the Federal University of Lavras.
In December 1995, the author started to work as an Assistant Professor at Federal University of Lavras.
INDEX
ABSTRACT ……….………. ix
RESUMO ……….. xi
GENERAL INTRODUCTION ………. 01
REFERENCES ………. 03
CHAPTER 1 ………. 07
A RESEARCH FACILITY FOR STUDYING POULTRY RESPONSES TO THERMAL STRESS AND ITS RELIEF 1.1. INTRODUCTION ……….. 07
1.2. MATERIALS AND METHODS ……… 08
1.2.1. Environment Control Facility ………. 08
1.2.2. Measurement and Control of Environmental Variables …… 09
1.2.3. Measurements of Thermograph, Core Body Temperature and Behavior of the Experimental Birds ………….………... 11
1.3. SYSTEM PERFORMANCE AND APPLICATION ………... 12
1.3.1. Performance ……… 12
1.3.2. Application ……….…….. 13
OPTIMIZATION OF INTERMITTENT PARTIAL SURFACE COOLING FOR HEAT STRESS RELIEF OF LAYING HENS
2.1. INTRODUCTION ……….. 25
2.2. MATERIALS AND METHODS ……… 27
2.2.1. Experimental Birds ………. 27
2.2.2. Experimental Rooms and Instrumentation ………. 28
2.2.3. Experimental Conditions ……….…….. 30
2.2.4. Bird Handling and Determination of Cooling Water Spray Interval (SI) ……….. 31
2.2.5. Data Analysis and Development of Sprinkling Interval (SI) and Evaporation Rate (ER) Models……….. 32
2.3. RESULTS AND DISCUSSION ………... 32
2.3.1. Sprinkling Interval (SI) and Evaporation Rate (ER) Models. 32 2.3.2. Surface temperature (tsurf) and Core Body temperature (tb) of the Hens ……….. 34
2.3.3. Sample Application of Sprinkling ………. 34
2.4. CONCLUSIONS ……… 35
2.5. NOMENCLATURES ……… 35
2.6. REFERENCES………... 36
CHAPTER 3 ………. 49
A THERMAL DISCOMFORT INDEX FOR LAYING HENS 3.1. INTRODUCTION ………. 49
3.2. MATERIALS AND METHODS ……….. 50
3.2.1. Experimental Birds ……… 50
3.2.2. Experimental Rooms and Instrumentation ……… 51
3.2.3. Experimental Conditions ……….……. 53
3.2.4. Bird Handling ………. 54
3.2.5. Data Analysis and Development of Thermal Discomfort Index (TDI) ……….. 54
3.3. RESULTS AND DISCUSSION ………... 55
3.3.1. Thermal Discomfort Index (TDI) ………. 55
3.4. CONCLUSIONS ……… 57
3.6. REFERENCES ……….. 58
CHAPTER 4 ………. 69
MODELING PARTIAL SURFACE EVAPORATIVE COOLING OF CHICKENS 4.1. INTRODUCTION ……….. 69
4.2. THEORETICAL MODEL ………. 71
4.2.1. Assumptions ……… 71
4.2.2. Governing Equations……….. 71
4.2.2.1. Heat and Mass Balance ……….. 71
4.2.2.2. Convection Heat Transfer Coefficient …………... 73
4.2.2.3. Mass Transfer Coefficient ………... 74
4.2.2.4. Psychrometric and Thermodynamic Properties of Moist Air ………. 75
4.3. EXPERIMENTAL DESIGN AND MEASUREMENTS ………. 77
4.4. RESULTS AND DISCUSSION ………... 78
4.4.1. Overall Thermal Resistance of Body Tissue and Feathers (Rbf) ……….. 78
4.4.2. Model Validation ………. 78
4.4.2.1. Effects of V and RH on ∆tb,50 of Non-wetted Hens ………... 79
4.4.2.2. Effect of the Direct Evaporative Cooling of ∆tb,50 on Sprayed Bird ……….………... 79
4.5. CONCLUSION AND RECOMMENDATIONS ……….. 80
4.6. REFERENCES ……….. 81
ABSTRACT
YANAGI JUNIOR, Tadayuki. D.S. Federal University of Viçosa, February 2002. Partial surface wetting to relieve acute thermal stress of laying hens. Adviser: Ilda de Fátima Ferreira Tinôco. Committee members: Fernando da Costa Baêta and Guido de Souza Damasceno.
establish empirical equations to describe the need of partial surface wetting for cooling laying hens (Hy-Line W-98, 34 ±1 wk old) subjected to a range of thermal stress conditions. The thermal exposures consisted of a factorial combination of 3 dry bulb temperatures (tdb) (35, 38 and 41 °C) × 2 dew point temperatures (tdp) (21.1 and 26.7 °C) × 3 air velocities (V) (0.2, 0.7 and 1.2 m· s -1
RESUMO
YANAGI JUNIOR, Tadayuki. D.S. Universidade Federal de Viçosa, fevereiro 2002. Molhamento superficial parcial para alívio de estresse térmico agudo em galinhas poedeiras. Orientador: Ilda de Fátima Ferreira Tinôco. Conselheiros: Fernando da Costa Baêta e Guido de Souza Damasceno.
GENERAL INTRODUCTION
Poultry are homeotherms in that their body temperatures remain relatively constant despite relatively large environmental fluctuations. There exists a range of environment, known as the thermoneutral zone (TNZ), where minimum effort or energy expenditure is required of the animal for thermoregulation or maintaining constant body temperature. For adult poultry (e.g., laying hens) the TNZ is 21 to 25 °C. High thermal environments cause reduction in feed energy intake, and consequently reducing the amount of energy available for production. Clearly, the negative impacts of thermal stress can reduce the hen productivity and thus the profit of the farmer. Therefore, it is imperative to improve the thermal environment surrounding the hens.
A cost-effective solution to summer cooling is direct evaporative cooling that has been studied for many animal species (Minett 1947; Sinha and Minett, 1947; Bahga, 1980; Hernandez and Castellanos, 1983; Flamenbaum et al., 1986; Igono et al., 1987; Strickland et al. 1989; Bucklin et al. 1991; Turner et al., 1992; Hillman et al., 2001; Culver et al., 1960; Hsia et al., 1974; Panagakis et al., 1992; Bridges et al., 2000). But, few studies have been reported for poultry (Wilson and Hillerman, 1952; Chepete and Xin, 1999, 2000; and Ikeguchi and Xin, 1999, 2001). The water sprayed on the sweat-lacking bird acts as artificial sweat, and when evaporating, helps removing its body heat.
Chepete and Xin (1999, 2000) tested a cost-effective method for cooling laying hens in Iowa based on intermittent partial surface wetting of the hens. In that study, the water was applied to 20-, 38- or 56-wk-old laying hens that were exposed to thermal-challenging condition of 40 °C air temperature (tdb), 45 % relative humidity (RH), and 0.15 to 0.20 m· s-1 air velocity (V). The authors reported the beneficial effect of the method for thermal stress relief in that the physiological responses (e.g., core body temperature, body heat load, surface temperature, body weight loss, and mortality) of the birds subjected to the treatment were generally better than the control ones. Ikeguchi and Xin (1999, 2001) tested an intermittent low-pressure sprinkling system in commercial laying hen house in Iowa. The system was activated for 10 s every 15 min when the tdb exceed 32 °C. The results showed an overall increase in egg production of 2.6 % while no adverse effects were observed on egg or feed quality.
Although Chepete and Xin (1999, 2001) and Ikeguchi and Xin (1999, 2001) verified that intermittent partial surface wetting reduces thermal stress of the hens, it is necessary to optimize the amount of water applied as function of the environmental conditions. This information could be incorporated to a commercial environment controller via an empirical mathematical equation.
performances of laying hens and turkeys, respectively. BGHI has been used in U.S.A. for quantifying animal thermal stress under outdoor production conditions. Due to the low insulation level in the Brazilian animal confinement facilities, BGHI has been widely used in quantification of the effective environment. A limitation of THI’s equation is the absence of V and solar radiation. The thermal discomfort suffered by the animal for a given temperature and humidity would be different when air velocity changes from calm to drafty, and vice versa. Thus, the development of a thermal discomfort index (TDI) that incorporates air temperature, humidity and air velocity is highly desirable.
Finally, to better understand the theory underlying the direct evaporative cooling it is desirable that a heat and mass transfer model be developed to predict changes in core body temperature as a function of the environmental conditions. Several models have been proposed to depict the heat and mass transfer in several animals subjected to direct wetting (Bouchillon et al., 1970; Wathen et al., 1971; Mitchell, 1976; Mahoney and King, 1977; Bakken, 1981; Wathes and Clark, 1981; Gebremedhin, 1987; Webb and King, 1983; McArtur, 1991; Gebremedhin and Wu, 2000), but few studies have been carried out for poultry. It was therefore one of the objectives of this study to develop a practical model that may be used to predict some physiological responses of the birds to prospective cooling schemes.
REFERENCES
Bahga, G. S., P. C. Ganwar, R. K. Srivastava and D. P. Dhingra. 1980. Effect of spray cooling on blood composition in buffaloes during summer. Indian Journal of Dairy Science 33(3):294-298.
Bakken, G. S. 1981. A two-dimensional operative-temperature model for thermal energy management by animals. Journal of Thermal Biology 6:23-20.
Bridges, T.C., L.W. Turner and R.S. Gates. 2000. Swine performance enhancement with cooling as influenced by summer growth period and weather, pp 348-356. Proc. 1st Intl. Conf. On Swine Housing, Des Moines IA. 9-11 Oct. ASAE: St. Joseph, MI.
Bucklin, R. A., L. W. Turner, D. K. Beede, D. R. Bray, R. W. Hemken. 1991. Methods to relieve heat stress for dairy cows in hot, humid climates. Applied Engineering in Agriculture 7(2):241-247.
Chepete, H.J. and H. Xin. 2000. Cooling Laying Hens by Intermittent Partial Surface Sprinkling. Transactions of ASAE 43(4):965-971.
Chepete, J. H. and H. Xin. 1999. Cooling poultry by partial surface sprinkling. ASAE Paper No. MC99-120. St. Joseph, MI: ASAE..
Culver, A. A., F. N. Andrews, J. H. Conrad and T. L. Noffinger. 1960.
Effectiveness of water sprays and wallow on the cooling and growth of swine in a normal summer environment. Journal of Animal Science 19(2):421-428.
Flamenbaum, I., D. Wolfenson, M. Mamen and A. Berman. 1986. Cooling dairy cattle by a combination of sprinkling and forced ventilation and its implementation in the shelter system. Journal of Dairy Science 69(12):3140-3147.
Gates, R.S. and M.B. Timmons. 1988. Method to assess economic risk applied to environmental control options for animal housing. Transactions of the ASAE 31(1):197-201.
Gebremedhin, K. G. 1987. A model of sensible heat transfer across the boundary layer of animal hair coat. Journal of Thermal Biology 12(1):5-10.
Gebremedhin, K. G. and B. Wu. 2000. A model of evaporative cooling of wet skin surface and fur layer. ASAE Paper No. 004114, ASAE, St. Joseph, Mi.
Hillman, P.E., K.G. Gebremedhin, A. Parkhurst, J. Fuquay and S. Willard. 2001. Evaporative and convective cooling of cows in a hot and humid environment. pp 343-350 in: Stowell, Bucklin and Bottcher (eds), Proceedings of Livestock Environment VI, 21-23 May, Louisville KY. ASAE Publications, St. Joseph, MI.
Hsia, L. C., M. F. Fuller and F. K. Koh. 1974. The effect of sprinkling on the performance of growing and finishing pigs during hot weather. Tropical Animal Health and Production 6(3):183-187.
Igono, M. O., H. D. Johnson, B. J. Steevens, G. F. Krause and M. D. Shanklin. 1987. Physiological, productive, and economic benefits of shade, spray, and fan system versus shade for Holstein cows during summer heat. Journal of Dairy Science 70(5):1069-1079.
Ikeguchi, A. and H. Xin. 1999. A low-pressure sprinkling system for heat stress relief of caged laying hens. ASAE Paper No. 994220. St. Joseph, MI: ASAE.
Ikeguchi, A., and H. Xin. 2001. Field evaluation of a sprinkling system for cooling commercial laying hens in the Midwestern U.S. region. Applied Engineering in Agriculture. (In Press)
Mahoney, S. A. and J. R. King. 1977. The use of the equivalent black-body temperature in the thermal energetics of small birds. Journal of Thermal Biology 2(3):115-120.
McArthur, A. J. 1991. Metabolism of homeotherms in the cold and estimation of thermal insulation. Journal of Thermal Biology 16(3):149-155.
Minett, F. C. 1947. Effects of artificial showers, natural rain and wallowing on the body temperatures of animals. Journal of Animal Science 6(1):35-48.
Mitchell, J. W. 1976. Heat transfer from spheres and other animal forms. Biophysical Journal 16(6):561-569.
Sinha, K. C. and R. C. Minett. 1947. Application of water to the body surface of water buffaloes and its effect on milk yield. Journal of Animal Science 6(3):259-264.
Strickland, J. T., R. A. Bucklin, R. A. Nordstedt, D. K. Beede and D. R. Bray. 1989. Sprinkler and fan cooling system for dairy cows in hot, humidity climates. Applied Engineering in Agriculture 5(2):231-236.
Timmons, M.B. and R.S. Gates. 1988. Predictive model of evaporative cooling and laying hen performance to air temperature and evaporative cooling. Transactions of the ASAE 31(5):1503-1509.
Turner, L. W., J. P Chastain, R. W. Hemken, R. S. Gates and W. L. Crist. 1992. Reducing heat stress in dairy cows through sprinkler and fan cooling. Applied Engineering in Agriculture 8(2):251-256.
Wathen, P., J. W. Mitchell and W. P. 1971. Porter. Theoretical and experimental studies of energy exchange from Jackrabbit ears and cylindrical shaped appendages. Biophysical Journal 2(12):1030-10-47.
Wathes. G. M. and J. A. Clark. 1981. Sensible heat transfer from the fowl: boundary-layer resistance of a model fowl. British Poultry Science 22(2):161-173.
Webb, D. R. and J. R. King. 1983. Heat-transfer relations of avian nestlings. Journal of Thermal Biology 8(4):301-310.
Wilson, W.O. and J.P. Hillerman. 1952. Methods of cooling hens with water. Poultry Science 31(5):847-850.
Xin, H., J.A. DeShazer, and M.M. Beck. 1992. Responses of pre-fasted growing turkeys to acute heat exposure. Transactions of the ASAE 35(1): 315-318.
CHAPTER 1
A RESEARCH FACILITY FOR STUDYING POULTRY RESPONSES TO THERMAL STRESS AND ITS RELIEF
1.1. INTRODUCTION
Puma et al. (2001) developed an automated measurement, control, and data acquisition system for studying feeding and drinking behavior of individual poultry.
One of the recent research thrusts at Iowa State University has been to explore alternative cooling means for thermal stress relief of caged layers (Chepete and Xin, 2000; Ikeguchi and Xin, 2001; Xin and Puma, 2001). One thermal relief method that has demonstrated merits is intermittent partial surface (i.e., head and appendages) wetting of the birds (Chepete and Xin, 2000; Ikeguchi and Xin, 2001). The practice to date has been to apply cooling water at a fixed rate (e.g., sprinkle 10 s every 10 min when house temperature exceeds 32°C or 90°F) regardless of the severity of the climate. Such a scheme lacks optimization of system operation because water evaporation rate depends greatly on thermal conditions, i.e., air dry-bulb temperature (tdb), RH, and air velocity (V). A variable application rate reflecting deviation of the thermal condition from the upper critical temperature is more desirable. To quantify and optimize the variable, climate-dependent cooling water needs, a facility is needed to create the target thermal environments, determine water application rate, and measure animals’ physiological responses to the cooling scheme. There is also, a lack of information concerning the interactive effects of tdb, RH, and V on poultry subjected to thermal challenging. The objective of this paper was to describe the development and application of a test facility allowing for conduct of such experiments.
1.2. MATERIALS AND METHODS
1.2.1. Environment Control Facility
had minimal temperature control and no RH control of the incoming air. The rooms were equipped with static pressure control such that the airflow rate of the rooms and the common corridor area was automatically adjusted to maintain a negative pressure for the corridor, minimizing the chance of potential cross-room contamination.
Situated inside the testing room was a small wind tunnel (1.10 m W × 2.45 m L × 0.69 m H; 3.6 ft W × 8.0 ft L × 2.3 ft H), that was constructed with aluminum frame and PVC sidewalls (Figure 1). The wind tunnel contained air straighteners that were made of 0.06 m diameter × 0.6 m L (0.2 ft D × 2 ft L) PVC tubes. The main body of the wind tunnel was divided into two regions: sensor region and animal region (1.1 m W × 0. 5 m L; 3.6 ft W × 1.6 ft L). The animal region was covered by a plastic film of 0.78 transmittance for acquiring infrared thermographs or surface temperatures and behavioral video images of the animals. More circuits (a total capacity of 80 A at 120 VAC) were added to accommodate the required heaters, humidifiers, fans, transducers, and data loggers. Figures 2 and 3 show the experimental room and instrumentation and the monitoring devices, respectively.
1.2.2. Measurement and Control of Environmental Variables
Environmental variables of concern included tdb, RH and V at the animal-occupied zone (AOZ) inside the wind tunnel. Air temperature and RH were measured with a thermistor temperature (±0.2 °C or 0.36 °F) and capacitance RH (±3 %) probe (model HMP35L, Campbell Scientific, Inc., Logan, Utah) placed in the wind tunnel upstream of AOZ – sensor region (Figure 1). Air velocity was measured with an omni-directional transducer (accuracy of 3 % reading) (TSI model 8475-12, Davis Instruments, Baltimore, Md.). Temperature (tdb), RH and V were sampled at 2-s intervals, and stored as 1-min averages using a programmable measurement and control module (model CR10, CSI).
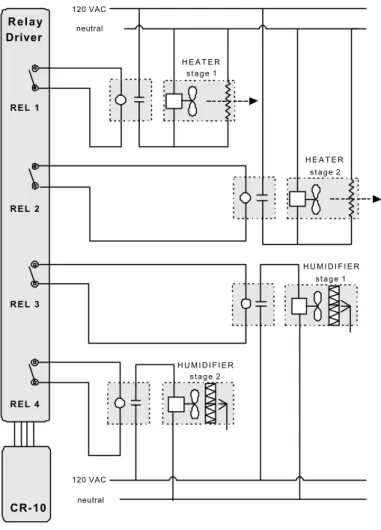
blocking most of the supply and return air ducts, thereby reducing the unnecessary supplemental heat and humidification requirements. Heating and humidification of air were achieved by four 1.5 kW electric resistance heaters (model PT261, Rival Manufacturing Company, Kansas City, Mo.) and five humidifiers of various capacities. Heaters and humidifiers were switched by the CR10 via a 4-channel relay driver (model A21REL-12, CSI) connected to four electromagnetic 12 VAC coil relays (1 HP at 120 VAC) (Figure 4). Two discrete control stages for tdb and two stages for RH were used. Each heating stage had a maximum power output of 3.0 kW. The first humidification stage had a water output of 5.06 l
·
hr-1 while the second humidification stage had an output of 3.94 l·
hr-1. The first stage of heating and humidification provided a baseline or coarse control, whereas the second stage provided fine-tuning or refinement toward the target points.1.2.3. Measurements of Thermograph, Core Body Temperature and Behavior of the Experimental Birds
Surface temperature (tsurf) distribution or thermograph of the birds was measured using an infrared (IR) imaging camera (0.06 ºC thermal discernability) with a wide-angle (32°) lens (Thermacam PM250, FLIR Systems, N. Billerica, Mass.). The camera was mounted on an adjustable cantilever beam stand at 1.5 m (5 ft) above the AOZ floor. External transmittance (τ ) between the camera and the animal was corrected to compensate for the plastic film cover above the AOZ. To perform the correction, an electrical heat mat was placed on the floor and thermographs were taken without and with the plastic cover. Adjustment for τ was made until tsurf readings with and without the presence of the film cover were in agreement. Regression analysis revealed τ of the plastic film to be 0.78. Real-time IR images were displayed on a TV monitor and used to guide the operator in deciding the timing of cooling water application to the birds (described later). The IR camera was connected to a PC via a RS-232 serial port, and controlled by a Visual Basic (VB) program. The IR images were recorded onto a 40 MB PCMCIA memory card in the IR-camera. A snapshot of the VB program screen display is shown in Figure 6. The recorded images were subsequently analyzed with a companion program (TherMonitor 95) of the IR camera.
simultaneous recording of rectal temperature was made with a precision thermistor probe (0.1°C accuracy, Model PT907, Pace Scientific, Inc., Charlotte, N.C.). Seven comparative tests were performed, one hen per test. Each test consisted of data sampled at 10 s intervals for a period of 18.5 (one test) or 28.5 (six tests) minutes. The testing thermal conditions used in the environmental room were: 37.8 °C (100°F) and 41 % RH (3 tests); 32.2°C (90 °F) and 52 % RH (2 tests); 32.2 °C and 41 % RH (1 test); and 26.7 °C (80 °F) and 59 % RH (1 test). Air velocity of 0.2 m· s-1 (39.4 ft· min-1) was used in all tests. Core body temperatures measured by both methods were compared using a paired t-test (SAS, 1985).
Behavioral data of the birds (locomotion, drinking, or state of alert) were acquired with a video recording system that consisted of a CCD camera with a high-speed aperture lens (Panasonic, WV-CP410) above the AO Z, a time-lapsed VCR (Panasonic, PV-V4520), and a TV monitor.
1.3. SYSTEM PERFORMANCE AND APPLICATION
1.3.1. Performance
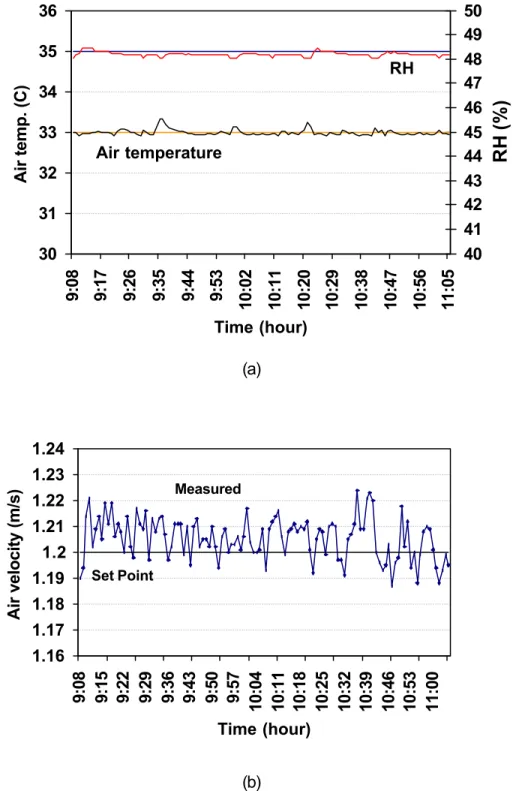
The control and measurement system described above performed well. Examples of controlled tdb, RH and V profiles are presented in Figure 8. With the 6 kW supplemental heating and 9.0 l· hr-1 (2.4 gal· hr-1) humidification capacities, thermal conditions of tdb = 35 to 41 ºC, and concomitant RH = 33 to 63 % - the target values for our studies were readily achievable.
block, and L-shape, were tested. The L-shape antenna proving to be most stable. The recorded tb raw data were filtered in an Excel spreadsheet to remove spurious data. For this particular study, the filter consisted of two steps. It started with an average of 10 consecutive, stable values. In the first step, data outside a pre-defined physiological range (e.g., from 40 to 43 °C; depending on the thermal environment conditions) were eliminated. In the second step, absolute difference between the current data point (output data from first step) and the running average of 10 proceeding data points was compared to a boundary threshold of 0.25 °C. If the difference was greater than the threshold, the current value was replaced with the running average; otherwise, the current value remained unchanged. The resultant data agreed well (t-test, P>0.99) with those obtained when the rectal probe properly remained inside the cloacae, as shown in table 1.
1.3.2. Application
Using the system, a study was performed to a) determine water evaporation rate of laying hens cooled by intermittent partial surface wetting at various tdb, RH and V combinations; and b) quantify physiological responses of the hen to the selected thermal conditions. Two laying hens at a time were subjected to the controlled environment, with one serving as control (not cooled), denoted as Ctrl; and the other as treatment (cooled), denoted as Trt. It is beyond the scope of this paper to describe the results in detail, which are presented by Yanagi et al. (2001a,b,c). Instead, sample data are presented to illustrate the system application. Figure 8 shows an example of tsurf and tb (after filtering) profiles of Ctrl and Trt birds. Timing of water application for the partial surface wetting was guided by visual observation of changes in the thermograph. Namely, as soon as tsurf of the Trt bird, showing an abrupt decline immediately after a spray, returned to nearly the pre-wetting level, it was time to spray again. The goal was to prevent tsurf from rising above the initial level.
feather thermal resistance (Rbf) of the bird may be calculated based on the heat balance equation as follows:
(
)
(i 0,1,2,3,... 1)t A c m R t t 1 t t R ) ( p bf(i) surf(i) b(i) a surf(i)
c = −
∆ ∆ ⋅ − − ⋅ − = N i b θ
N
R
R
1 N 0 i bf(i) bf∑
=
− = where,m = mean body mass of the hen before and after thermal exposure, kg cp = specific heat of the body, assumed to be 4.18 J· (g· °C)-1
A = surface area of the bird, m2, calculated as A = 0.1067· m0.705 (Mitchell, 1930)
N = number of measurement points considered during the thermal exposure period
θ
∆ = time interval between measurement points, s
1.4. CONCLUSIONS
A control and measurement system was developed for studying interactive effects of thermal conditions on physiological responses of small animals. The system features control of air temperature (35 to 41 ± 0.2 °C), relative humidity (33 to 63 ± 2 %), and velocity (0 to 1.5 ± 0.1 m.s-1) at the animal-occupied zone; continuous, non-contact IR measurements of thermographs (surface temperature); and continuous, telemetric measurement of core body temperature. A study with laying hens, concerning thermoregulatory responses to thermal challenge and its relief, was conducted to demonstrate application of the system.
1.5. REFERENCES
Chepete, H. J., and H. Xin. 2000. Cooling laying hens by intermittent partial surface sprinkling. Transactions of the ASAE 43(4): 965-971.
Costello, T.A., I.L. Berry, and R.C. Benz. 1991. A fan-actuated mechanism for controlled exposure of a psychrometer wet bulb sensor to dusty environment. Applied Engineering in Agriculture 7(4): 473-477.
Gates, R.S., L.W. Turner, H. Chi and J.L. Usry. 1995. Automated weighing of group-housed growing-finishing swine. Transactions of the ASAE 38(5): 1479-1486.
Mitchell, J. W. 1976. Heat transfer from spheres and other animal forms. Biophysical Journal 16(6):561-569.
Ikeguchi, A., and H. Xin. 2001. Field evaluation of a sprinkling system for cooling commercial laying hens in the Midwestern U.S. region. Applied Engineering in Agriculture (In press).
Puma, M.C., H. Xin, R.S. Gates, and D. J. Burnham. 2001. An instrumentation system for measuring feeding and drinking behavior of poultry. Applied Engineering in Agriculture (In press).
Xin, H., I.L. Berry and T.A. Costello. 1994. A computerized measurement and data acquisition system for field poultry research. Computer and Electronics in Agriculture 11: 143-156.
Xin, H. and M.C. Puma. 2001. Cooling caged laying hens in high-rise house by fogging inlet air. Proc. of the 6th International Livestock Environment Symposium, Louisville, Kentucky, pp244-249. LCCN 2001090005, St. Joseph, MI: ASAE.
Yanagi, Jr., T., H. Xin and R. S. Gates. 2001a. Optimal operation of intermittent partial surface cooling for heat stress relief of laying hens. ASAE Paper No. 014110, St. Joseph, MI: ASAE.
Yanagi, Jr., T., H. Xin and R. S. Gates. 2001b. Thermal discomfort index for laying hens. ASAE Paper No. 014064, St. Joseph, MI: ASAE.
Yanagi, Jr., T., H. Xin and R. S. Gates. 2001c. Modeling partial surface evaporative cooling of chickens. ASAE Paper No. 013011, St. Joseph, MI: ASAE.
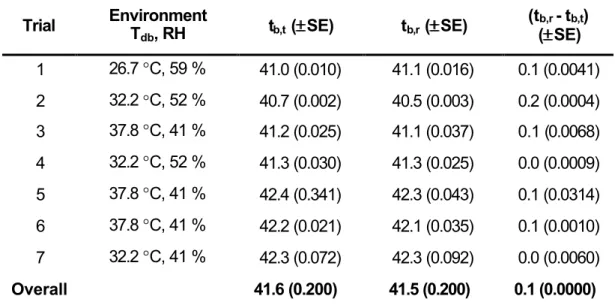
Table 1. Comparison of mean body temperature measurements obtained with rectal probe (tb,r) and telemetric transmitter (after filtered) (tb,t) during each of the seven paired trials.
Trial Environment T
db, RH tb,t (±±SE) tb,r (±±SE)
(tb,r - tb,t) (±±SE) 1 26.7 °C, 59 % 41.0 (0.010) 41.1 (0.016) 0.1 (0.0041) 2 32.2 °C, 52 % 40.7 (0.002) 40.5 (0.003) 0.2 (0.0004) 3 37.8 °C, 41 % 41.2 (0.025) 41.1 (0.037) 0.1 (0.0068) 4 32.2 °C, 52 % 41.3 (0.030) 41.3 (0.025) 0.0 (0.0009) 5 37.8 °C, 41 % 42.4 (0.341) 42.3 (0.043) 0.1 (0.0314) 6 37.8 °C, 41 % 42.2 (0.021) 42.1 (0.035) 0.1 (0.0010) 7 32.2 °C, 41 % 42.3 (0.072) 42.3 (0.092) 0.0 (0.0060) Overall 41.6 (0.200) 41.5 (0.200) 0.1 (0.0000) Note: There was no significant difference in tb values measured with both
methods (P> 0.99).
0.60 0.60 0.50 0.75 2.45 0.25 0.30 0.14 0.33 0.36 0.17 cage 0.17 Wire -mesh screen Wire -mesh screen Wire -mesh screen AOZ Air straightener
(made of PVC tubes)
V probe
tdb/ RH probe 0.25 1.10 0.17 0.17 Wire -mesh screen Wire -mesh screen Wire -mesh screen
0.60 0.60 0.50 0.75
2.45 0.25 0.30 0.14 0.33 0.36 0.17 cage 0.17 Wire -mesh screen Wire -mesh screen Wire -mesh screen AOZ Air straightener
(made of PVC tubes)
V probe
tdb/ RH probe 0.25 1.10 0.17 0.17 Wire -mesh screen Wire -mesh screen Wire -mesh screen
Figure 1 - Schematic top view of the experimental wind tunnel. Air flows horizontally from left to right (unit of dimension = m; 1 m = 3.28 ft). AOZ = animal occupied zone.
IR-Camera
V-Camera
Wind tunnel
IR-Camera
V-Camera
Wind tunnel
Data logger &
Controller CR10
IR-Camera
Controller
IR-Image
Telemetry
Telemetry Receptor
VCR
Video
Image
H U M I D I F I E R s t a g e 2
CR-10
R E L 4
120 VAC
neutral R E L 3
H U M I D I F I E R s t a g e 1 H E A T E R
s t a g e 2
R E L 2 R E L 1
H E A T E R s t a g e 1
R e l a y Driver
120 VAC
neutral
Figure 4 – Schematic representation of electrical wiring for air temperature and relative humidity control in the testing room.
Off
Ta, SP
Ta,SP -∆∆ Ta,2 Ta,SP -∆∆ Ta,1 Ta,SP + ∆∆ Ta,1 Ta,SP + ∆∆ Ta,2 On Stage 1 Stage 2
Heater status
Air temperature
On OffTa, SP
Ta,SP -∆∆ Ta,2 Ta,SP -∆∆ Ta,1 Ta,SP + ∆∆ Ta,1 Ta,SP + ∆∆ Ta,2 On Stage 1 Stage 2
Heater status
Air temperature
Ona. b.
c. d.
30 31 32 33 34 35 36
9:08 9:17 9:26 9:35 9:44 9:53
10:02 10:11 10:20 10:29 10:38 10:47 10:56 11:05
Time (hour)
Air temp. (C)
40 41 42 43 44 45 46 47 48 49 50
RH (%)
RH
Air temperature
(a)
1.16 1.17 1.18 1.19 1.2 1.21 1.22 1.23 1.24
9:08 9:15 9:22 9:29 9:36 9:43 9:50 9:57
10:04 10:11 10:18 10:25 10:32 10:39 10:46 10:53 11:00
Time (hour)
Air velocity (m/s)
Measured
Set Point
(b)
Figure 8 – Examples of controlled air temperature, relative humidity (RH) (a) and velocity (b) profiles with regards to set points (unit conversion:
Elapsed-time (min)
0 20 40 60 80
Body temperature (°C)
40.0 40.5 41.0 41.5 42.0
Telemetry Rectal-probe
Figure 9 – Example of laying hen body temperature as measured by telemetric system vs. rectal probe (unit conversion: °F=1.8×°C + 32).
Elapsed-time (min)
0 20 40 60 80 100 120 140 160
Chicken surface & body temp. (°C)
32 34 36 38 40 42 44 46 48
tb (Ctrl)
tsurf (Ctrl)
tb (Trt)
tsurf (Trt)
t
db(C)
34
35
36
37
38
39
40
41
42
R
bf(m
2
.C.W
-1)
0.00
0.05
0.10
0.15
0.20
0.25
0.30
R
bf
= 1.36 (±8.1E-02
) - 0.032 (±2.1E-03 )
.
t
db
r
2= 0.89
CHAPTER 2
OPTIMIZATION OF INTERMITTENT PARTIAL SURFACE COOLING FOR THERMAL STRESS RELIEF OF LAYING HENS
2.1. INTRODUCTION
Adult laying hens have a thermoneutral zone (TNZ) of 21 to 25 °C. Deviation of the thermal environment from TNZ leads to performance reduction or mortality under severe conditions. Several studies have shown the adverse effects of elevated environmental temperature on laying hen performance (Squibb et al., 1959; Payne, 1966; Mowbray and Sykes, 1971; Marden and Morris, 1975; Vohra et al., 1979, Zulovich and DeShazer, 1990; Samara et al., 1996; Bordas and Minvelle, 1997; Yahav, 2001). Bordas and Minvelle (1997) verified a reduction of 16% in feed intake, 13% in number of eggs laid, 8% in body weight and 4% in egg weight of several laying hen breeds when they were exposed to 35 ±1 °C vs. 21 ±1 °C. The thermally induced performance reduction was observed for all breeds tested.
conjuction with evaporative cooling pad, misting or fogging (Reece and Deaton, 1971; Shackleford, 1979; Timmons et al., 1981; Wilson et al., 1983; Ross and Herrick, 1983; Canton et al., 1983; Gates and Timmons, 1986; Bottcher et al., 1989; Koca et al., 1991; Xin and Puma, 2000), and mechanical ventilation coupled with direct evaporative cooling (Berry et al., 1990; Chepete and Xin, 1999, 2000; Ikeguchi and Xin, 1999, 2001). These studies have shown clear benefits of evaporative cooling on bird performance. Several studies have also been conducted to optimize evaporative cooling systems, as reported by Gates et al. (1991ab, 1992), Bottcher et al., (1991, 1992b), Singletary et al. (1996), and Simmons and Lott (1996).
intermittent sprinkling improved overall egg production by 2.6% and as high as 5.6 %, and there were no adverse effects observed on egg and feed quality.
Evaporation rate (ER) of sprinkled water from the bird surface depends on the surrounding thermal condition. Obviously the water will evaporate faster when the surrounding air is dry and drafty than when it is wet and calm. Hence, a constant rate of water application for different thermal conditions, though providing appreciable benefits especially under hot conditions, would not fully utilize the potential of such a system. Further, there is a practical risk in air quality (especially ammonia volatilization) associated with using excessive sprinkling. Therefore, this study aimed to optimize the process by addressing the following objectives: 1) to quantify cooling water needs of laying hens under various thermal conditions, as expressed by sprinkling interval (SI, min) at a fixed sprinkling dosage (10 ml· hen-1); and 2) to establish prediction equations relating SI or ER (ml· min-1) of the cooling water to the environmental variables. Ultimately, these prediction equations will be incorporated into an automatic environmental controller for operating the cooling system.
2.2. MATERIALS AND METHODS
2.2.1. Experimental Birds
10:00 P.M.), as used on the farms, was provided with fluorescent light that produced an illumination intensity of 20 lux (1.9 fc) at the bird level.
2.2.2. Experimental Rooms and Instrumentation
One of three environmental rooms (5 m L x 3.5 m W x 3.0 m H each) in the LEAP II lab was used as the acclimation or holding room, and another room was used as the testing room. All rooms had a minimum control of tdb for the incoming air, and no control on RH. The following modifications to the testing room and installation of control and measurement instruments were made to achieve the desired experimental conditions and data collection.
model 8475-12, Davis Instruments, Baltimore, Md.) placed in the upper stream of the ventilation air; it was controlled by manual adjustment of the variable-speed fan. The environmental variables tdb, RH and V were generally controlled within ±0.2°C, ±2%, and ±0.02 m· s-1 of the respective target points.
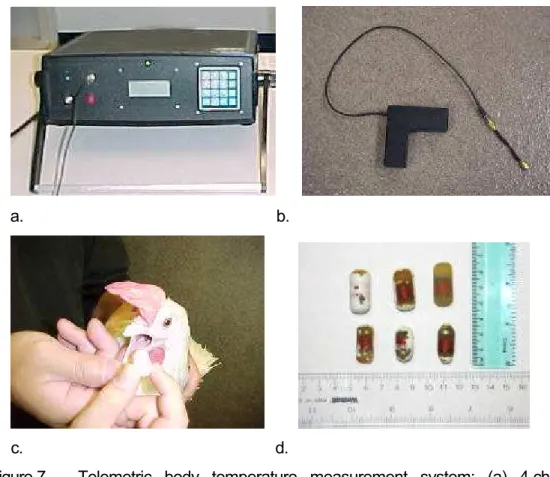
A new, surgery-free telemetric system with a 4-channel receiver (two frequencies of 262 and 300 kHz), in conjunction with omni-directional L-shaped antenna, (model 4000, HTI Technology, Inc., Palmeto, FL) was used to continuously measure core body temperature (tb) of the hens (Fig. 3). This non-invasive method involves an ingestible telemetric pill (1.2-1.4 cm diameter x 2.5-2.8 cm L) that is swallowed and resides in the hen gizzard (fig. 4a). It usually takes 4 to 6 hr for the pill to reach the gizzard after being swallowed. Occasionally, the pill remained in the crop for more than 6 to 8 hr. Because crop temperature does not represent tb, a replacement bird was used under such circumstances. After each test, the hens were sacrificed by cervical dislocation, and the pills were retrieved and re-used if their conditions permitted. Lifespan of the pills typically ranged from 3 to 7d. Examples of pill appearances after various days of residence in the gizzard are shown in figure 4b. The receiver was connected to a PC via an RS-232 serial communication cable, providing continuous transfer of tb data collected at 4-s intervals from the receiver to the PC hard drive. Further details of the telemetry system can be found in Brown-Brandl et. al (2001).
AG-6730, Panasonic), a time-lapse VCR (model PV-V4520, Panasonic), and a TV monitor. A more detailed description of the instrumentation system for environmental control and data acquisition is given in Yanagi et al. (2001).
2.2.3. Experimental Conditions
To determine the relationship between thermal conditions and cooling water needs of the hen, a factorial combination of the following thermal conditions was selected: a 3-level dry-bulb temperature, tdb at 35, 38, and 41 °C, a 2-level dew-point temperature, tdp at 21.1 and 26.7 °C, and a 3-level air velocity, V at 0.2, 0.7, and 1.2 m· s-1. Hence, there were a total of 18 tdb x tdp x V combinations.
For given tdb and tdp, vapor pressure deficit or VPDair of the moist air was derived from the following equation:
VPDair = Pws(tdb) – Pw = (1 -
φ
) ⋅ Pws(tdb) (1)where φ is RH (decimal), Pw is the actual water vapor pressure (Pa), and Pws(tdb) is the saturation vapor pressure (Pa) at tdb. For 0 ≤ tdb ≤ 200 °C, Pws can be calculated using the following equation (ASHRAE, 1997):
Pws(T) = e[C1/T+C2+C3⋅T+C4⋅T2+C5⋅T3+C6⋅ln( )T] (2)
where T is in K and the constant coefficients are:
C1 = -5.8002206 E+03, C4 = 4.1764768 E-05, C2 = 1.3914993 E+00, C5 = - 1.4452093 E-08, C3 = - 4.8640239 E-02, C6 = 6.5459673 E+00.
2.2.4. Bird Handling and Determination of Cooling Water Spray Interval (SI)
On the night before subjecting the hens to one of the 18 combined thermal conditions, telemetric tb transmitters was given to a pair of randomly selected hens in the acclimation room, one designated as the control (Ctrl)– not cooled, and the other as the treatment (Trt) – cooled by partial surface wetting. Following an overnight acclimation and thus establishment of the baseline tb under thermoneutral conditions, the hens were transferred to the wind tunnel in the testing room the next day. In the wind tunnel, the hens were kept in a 2-compartment (0.33 x 0.36 m) cage whose partition was covered with plastic film to prevent cross-compartment movement of the cooling mist. After 10-min thermal exposure, the head and neck appendages of the Trt hen were manually sprayed with 10 ±0.1 ml of 24 ±1 °C water. A 3.8 l polyethylene sprayer (model 60171, H.D. Hudson Manufacturing Co., Hastings, MN) at 207 kPa (30 psi), controlled by a time-delay relay and solenoid valve, was used to ensure consistent water output of the cooling sprays. The dosage of 10 ml per spray was based on the result of a preliminary experiment conducted to determine the maximum amount of water absorption by the related areas of a hen.
During the thermal exposure period, the hens were not provided with feed but had free access to drinking water at 24 ±1°C. Hens were weighed before and after the thermal exposure. They were also monitored if eggs were laid during the thermal exposure periods. The protocol was approved by the Committee on Care and Use of Animals for Research at Iowa State University.
2.2.5. Data Analysis and Development of Sprinkling Interval (SI) and Evaporation Rate (ER) Models
To establish the relationship between SI or ER and the thermal conditions, a principal component analysis (SAS, 2001) was performed to determine the number of independent variables among five candidate input variables: tdb, V, VPDair and their non-linear transformations of tdb· V and VPDair· V . Choices of the transformed variables were based on the physics of convective heat transfer and evaporation. Once the number of independent variables was determined, a maximum r2 regression procedure (SAS, 2001) was used to identify the most contributing terms.
2.3. RESULTS AND DISCUSSION
2.3.1. Sprinkling Interval (SI) and Evaporation Rate (ER) Models
and 1.0 m· s-1 V increase. This confirms the rationale of using transformation of V,
V
, in relating its effect on SI or ER.Results of the principal component analysis revealed that greater than 95% of the variation in the SI data could be explained by linear combinations of two of the five candidate input variables (i.e., tdb, V, VPDair, tdb⋅ V , VPDair· V ). Further, 99% of the variation was explained by linear combinations of three of the five variables. Regression analysis using the maximum r2 criterion yielded the following functional relationships for SI10 (min), where subscript 10 stands for application dosage of 10 ml· hen-1, and ER (ml· min-1):
(
2.08)
26.02(
1.65)
V 5.77 10(
4.36 10)
VPD67.70
SI 3 -4 air
10= ± − ± ⋅ − ⋅ ± ⋅ ⋅
−
r2 = 0.89 (4)
(
1
.
63
10
)
1
.
05
10
(
5
.
25
10
)
V
VPD
127
.
0
ER
=
±
×
−2+
×
−4±
×
−6⋅
⋅
airr2 = 0.89 (5)
Values in parentheses are standard errors of each coefficient. Using these equations, contours of iso-SI and iso-ER as a function of V and VPDair were established, as shown in Figures 6 and 7, respectively. For convenience of practical application, contours of iso-VPDair vs. tdb and RH are presented in Figure 8.
Hence use of SI8 = 10 min would be reasonable as well. Nevertheless, further validation of the SI/ER equations needs to be conducted before incorporated into automatic controllers for commercial applications.
2.3.2. Surface Temperature (tsurf) and Core Body Temperature (tb) of the Hens
Sample dynamic profiles of tsurf and tb for the Trt and Ctrl hens are shown in Figures 9, 10 and 11 for tdb of 35, 38, and 41°C, respectively. Surface temperature (tsurf) dropped abruptly upon spraying of the cooling water, and gradually returned to the initial state at a rate dependent on the environment. The dynamic tsurf patterns confirmed the proper timing of the sprays.
At 35°C tdb, both Ctrl and Trt hens were able to maintain tb lower than 43°C (Fig. 9). At 38 oC or 41°C tdb, the Trt hens experienced less tb rise during the test (figs. 10 and 11), lower mortality, and longer survival time than the Ctrl hens. This was particularly true at the lower V and thus limited wind-chill effects for the Ctrl hens. A detailed comparison of the physiological responses between the Trt and Ctrl hens to delineate the effectiveness of the cooling method under the thermal conditions tested will be presented in a separate subsequent publication.
2.3.3. Sample Application of Sprinkling
conditions range from 0.25-0.33, 0.32-0.45 and 0.42-0.63 ml· min-1 for these respective V values.
2.4. CONCLUSIONS
Cooling water needs of intermittent partial surface wetting to relieve thermal stress for laying hens were quantified by subjecting 34 ±1 wk Hy-Line W-98 hens to 18 thermal conditions formed by a 3 × 2 × 3 factorial combination of tdb (35, 38, 41 °C), tdp (21.1, 26.7 °C) and V (0.2, 0.7, 1.2 m· s-1). The synergistic effect of tdb was further expressed in terms or air vapor pressure deficit (VPDair). The cooling water needs were expressed as spray interval of a 10 ml· hen-1 dosage (SI10) or evaporation rate (ER, ml· min-1). ER was related to VPDair and V as ER=0.127 +1.05×10⁻⁴⋅ V ⋅VPDair. SI10 was related to VPDair and V as SI 67.70 26.02 V 5.77 10 VPDair .
3
10 = − ⋅ − ⋅ ⋅
− Although further
verification is recommended the empirical relationships provide a basis for optimizing the cooling system under commercial production conditions.
2.5. NOMENCLATURE
φ relative humidity of moist air, decimal
C1 to C6 coefficients of equation for determination of saturation vapor pressure
ER evaporation rate of cooling water, ml· min-1 Pws(t) saturation vapor pressure at temperature t, Pa RH relative humidity, %
SI sprinkle interval, min
T, tdb dry bulb temperature of air, K and °C, respectively tdp dew point temperature of air, °C
VPDair air vapor pressure deficit, Pa
2.6. REFERENCES
ASHRAE. 1997. ASHRAE Handbook: Fundamentals. American Society of Heating, Refrigerating and Air-Conditioning Engineers. In: Psychrometrics, chapter 6. pp 6.1-6.17. Atlanta, GA.
Berry, I.L., T.A. Costello, and R.C. Benz. 1990. Cooling broiler chickens by surface wetting. ASAE Paper. No. 90-2024. St Joseph, MI: ASAE.
Bordas, A. and F. Minvelle. 1997. Résponse à la chaleur de poules pondeuses issues de lignées sélectionnés pour une faible (R-) or forte (R+) consomation alimentaire résiduelle. Genetics, Selection, Evolution 29(3):279-290.
Bottcher, R.W., G.R. Baughman, and D.J. Kesler. 1989. Evaporative cooling using a pneumatic misting system. Transactions of the ASAE 32(2):671-676.
Bottcher, R.W., G.R. Baughman, R.S. Gates, and M.B. Timmons. 1991. Characterizing efficiency of misting systems for poultry. Transactions of ASAE 34(2):586-590.
Bottcher, R.W., L.B.Driggers, T.A.Carter, and A.O.Hobbs. 1992a. Field comparison of broiler house mechanical ventilation systems in a warm climate. Applied Engineering in Agriculture 8(4):499-508.
Bottcher, R.W., M.-III Czarick, M.P.Lacy, and G.R. Baughman. 1992b. Evaporative efficiency of a fogging fan for poultry. Applied Engineering in Agriculture 8(6):855-860.
Brown-Brandl, T.M., Yanagi, T., Xin, H., Gates, R.S., Bucklin, R. and G. Ross. 2001. Telemetry system for measuring core body temperature in livestock and poultry. ASAE Paper No. 01-4031. St Joseph, MI: ASAE.
Chepete, H.J., and H. Xin. 1999. Evaluation of intermittent partial surface wetting on heat stress relief of laying hens. ASAE Paper. No. 99-4219. St Joseph, MI: ASAE.
Chepete, H.J., and H. Xin. 2000. Cooling laying hens by intermittent partial surface sprinkling. Transactions of ASAE 43(4):965-971.
Gates, R.S. and M.B. Timmons. 1986. Impact of evaporative cooling in layer houses. ASAE Paper. No. 86-4536. St Joseph, MI: ASAE.
Gates, R.S., M.B.Timmons, and R.W. Bottcher. 1991a. Numerical optimization of evaporative misting systems. Transactions of ASAE 34(1):275-280.
Gates, R. S., J. L. Usry, J. A. Nienaber, L. W. Turner and T. C. Bridges. 1991b. Optimal misting method for cooling livestock housing. Transactions of the ASAE 34(5):2199-2206.
Gates, R. S., D. G. Overhults, R. W. Bottcher and S. H. Zhang. 1992. Field calibration of a transient model for broilermisting. Transactions of the ASAE 35(5):1623-1631.
Gates, R.S. and M.B. Timmons. 1988. Method to assess economic risk applied to environmental control options for animal housing. Transactions of the ASAE 31(1):197-201.
Ikeguchi, A., and H. Xin. 1999. A low-pressure sprinkling system for heat stress relief of caged laying hens. ASAE Paper. No. 994220. St Joseph, MI: ASAE.
Ikeguchi, A., and H. Xin. 2001. Field evaluation of a sprinkling system for cooling commercial laying hens in the Midwestern U.S. region. Applied Engineering in Agriculture 17(2):217-221.
Koca, R.W., W.C.Hughes, and L.L. Christianson. 1991. Evaporative cooling pads: test and evaluation. Applied Engineering in Agriculture 7(4):485-490.
Marden, A. and T.R. Morris. 1975. Comparison between constant and cyclic environments on shell quality and other lay performance factors with leghorn pullets. Poultry Science 54:36-46.
Mowbray, R.M. and A.H. Sykes. 1971. Egg production in warm environmental temperatures. British Poultry Science 12:25-29.
Payne, G.C. 1966. Practical aspects of environmental temperature for laying hens. World’s Poultry Science Journal 22:126-139.
Ross, E. and R.B. Herrick. 1983. Evaporative cooling of laying hens in Hawaii Strains, temperature, humidity. Poultry Science 62(5):741-745.
Samara, M.H., K.R. Robins, and M.O. Smith. 1996. Interaction of feeding time and temperature and their relationship to performance of the broiler breeder hen. Poultry Science 75:34-41.
Shackleford, A.D. 1979. Evaporative cooling of broilers. Poultry Science 58(4):1106.
Simmons, J.D. and B.D. Lott. 1996. Evaporative cooling performance resulting from changes in water temperature. Applied Engineering in Agriculture 12(4):497-500.
Singletary, I.B., R.W. Bottcher, and G.R. Baughman. 1996. Characterizing effects of temperature and humidity on misting evaporative efficiency. Transactions of the ASAE 39(5):1801-809.
SAS (2001) User’s Guide (Release 8.2). Statistical Analysis System Institute, Inc., Cary, NC.
Squibb, R.L, G.N. Wogan, and C. H. Reed. 1959. Production of white leghorn hens subjected to high environmental temperatures with wide diurnal fluctuations. Poultry Science 38(5):1182-1183.
Timmons, M.B., G.R. Baughman, and C.R. Parkhurst. 1981. Use of evaporative cooling to reduce poultry stress. ASAE Paper. No. 81-4558. St Joseph, MI: ASAE.
Timmons, M.B. and R.S. Gates. 1988. Predictive model of evaporative cooling and laying hen performance to air temperature and evaporative cooling. Transactions of the ASAE 31(5):1503-1509.
Vohra, P., W.O. Wilson, I.D. Siopes. 1979. Egg production, feed consumption and maintenance energy requirements of leghorn hens as influenced by dietary energy at temperatures of 15.6 and 26.7 °C. Poultry Science 58:674-680.
Wilson, J.L.; H.A. Hughes, and W. D.-Jr. Weaver. 1983. Evaporative cooling with fogging nozzles in broiler houses. Transactions of ASAE 26(2):557-561.
Xin, H. and M.C. Puma. 2000. Fogging inlet air to cool laying hens in high-rise houses. ASAE Paper. No. MC00-123. St Joseph, MI: ASAE.
Yanagi –Jr., T., H. Xin, and R.S. Gates. 2001. Measurement and control for studying animal-environment interactions. In: World Congress on Computers in Agriculture and Natural Resources, Iguassu Falls, Brazil. ASAE Paper. (Accepted).
Table 1– Summary of spray intervals (SI) at the dosage of 10 ml
·
hen-1 for the tested thermal environmental conditions.tdb (°C) tdp (°C) RH (%) VPDair (kPa) V (m· s-1) SI10, (min) 0.2 41.4 (0.5)
45 3.1 0.7 29.8 (1.1)
21.1
1.2 20.6 (0.2) 0.2 49.0 (1.0)
63 2.1 0.7 32.3 (0.0)
35
26.7
1.2 22.4 (0.2) 0.2 30.9 (0.6)
38 4.1 0.7 23.9 (0.4)
21.1
1.2 19.1 (1.0) 0.2 41.8 (1.0)
53 3.1 0.7 26.1 (0.6)
38
26.7
1.2 20.7 (0.7) 0.2 22.4 (1.3)
32 5.3 0.7 17.2 (1.1)
21.1
1.2 13.5 (0.5) 0.2 27.7 (0.4)
45 4.3 0.7 21.0 (0.3)
41
26.7
1.2 16.5 (1.2) Notes: tdb, tdp = dry-bulb and dew-point temperature of the air, respectively,
°C.
VPDair = vapor pressure deficit of the air, calculated as the difference between saturated vapor pressure at the given tdb and the actual vapor pressure, kPa.
Values in parentheses are standard errors of the means.
Area = 274 mm2
Area = 274 mm2
Figure 1 – Typical comb shape and size of the experimental hen.
0.60 0.60 0.50 0.75
2.45 0.25 0.30 0.14 0.33 0.36 0.17 cage 0.17 Wire -mesh screen Wire -mesh screen Wire -mesh screen AOZ Air straightener
(made of PVC tubes)
V probe
tdb/ RH probe 0.25 1.10 0.17 0.17 Wire -mesh screen Wire -mesh screen Wire -mesh screen
0.60 0.60 0.50 0.75
2.45 0.25 0.30 0.14 0.33 0.36 0.17 cage 0.17 Wire -mesh screen Wire -mesh screen Wire -mesh screen AOZ Air straightener
(made of PVC tubes)
V probe
tdb/ RH probe 0.25 1.10 0.17 0.17 Wire -mesh screen Wire -mesh screen Wire -mesh screen
Figure 2 - Schematic top view of the wind tunnel. Air flows horizontally from left to right. Unit of dimension: m
(a) (b)
(a) (b)
*>48.2°C
*<34.7°C
35.0 40.0 45.0
*>48.2°C
*<34.7°C
35.0 40.0 45.0
(a) (b) *>48.2°C
*<34.7°C
35.0 40.0 45.0
*>48.2°C
*<34.7°C
35.0 40.0 45.0
(b) (d)
*>48.2°C
*<34.7°C
35.0 40.0 45.0
*>48.2°C
*<34.7°C
35.0 40.0 45.0
(e) (f)
Air Velocity (m s
-1)
0.2
0.4
0.6
0.8
1.0
1.2
VPD
air
(kPa)
2.0
2.5
3.0
3.5
4.0
4.5
5.0
15
20
25
30 35
40
Figure 6 – Contours of spray interval (min) at a nominal dosage of 10 ml· hen-1 as a function of air vapor pressure deficit (VPDair) and velocity (V).
0.2
0.4
0.6
0.8
1.0
1.2
VPD
air
(kPa)
2.0
2.5
3.0
3.5
4.0
4.5
5.0
0.6
0.5
0.4
Dry Bulb Temperature (
oC)
30 32 34 36 38 40 42 44 46
Relative Humidity (%)
0 20 40 60 80 100 1 2 3 4 5 6 7 8
Figure 8 – Contours of air vapor pressure deficit (VPD
air, kPa) as a
function of dry-bulb temperature and relative humidity.
Thermal Environment Condition: 35 C Tdb, 21.1 C Tdp (45 % RH), and 0.2 m/s
3 0 3 2 3 4 3 6 3 8 4 0 4 2 4 4 0
30 60 90
120 150
E l a p s e d - T i m e ( m i n )
Chicken Surface &
Body Temp. (C)
T b - C t r l T b - T r t Tsurf - Ctrl
T s u r f - T r t
Thermal Environment Condition: 35 C Tdb, 26.7 C Tdp (63 % RH), and 1.2 m/s
3 0 3 2 3 4 3 6 3 8 4 0 4 2 4 4 0
30 60 90
120 150
E l a p s e d - T i m e ( m i n )
Chicken Surface &
Body Temp. (C)
T b - C t r l Tb - Trt
Tsurf - Ctrl
Tsurf - Trt
Thermal Environment Condition: 38C Tdb, 21.1 C Tdp (38 % RH), and 0.2 m/s
30 35 40 45 50 0
30 60 90 120 150
Elapsed-Time (min)
Chicken Surface &
Body Temp. (C)
Tb - Ctrl T b - T r t Tsurf - Ctrl
Tsurf - Trt
Thermal Environment Condition: 38 C Tdb, 21.1 C Tdp (38 % RH), and 1.2 m/s
3 0 3 2 3 4 3 6 3 8 4 0 4 2 4 4 0 3 0 6 0 9 0 120 150
E l a p s e d - T i m e ( m i n )
Chicken Surface &
Body Temp. (C)
T b - C t r l T b - T r t
T s u r f - C t r l
T s u r f - T r t
(a) (b)
Thermal Environment Condition: 38 C Tdb, 26.7 C Tdp (53 % RH), and 0.2 m/s
3 0 3 2 3 4 3 6 3 8 4 0 4 2 4 4 4 6 4 8 0
30 60 90
120 150
E l a p s e d - T i m e ( m i n )
Chicken Surface & Body Temp. (C)
T b - C t r l T b - T r t
T s u r f - C t r l
T s u r f - T r t
Thermal Environment Condition: 38 C Tdb, 26.7 C Tdp (53 % RH), and 1.2 m/s
3 0 3 2 3 4 3 6 3 8 4 0 4 2 4 4 0
30 60 90 120 150
E l a p s e d - T i m e ( m i n )
Chicken Surface & Body Temp. (C)
T s u r f - T r t T s u r f - C t r l T b - C t r l
T b - T r t
(c) (d)
Thermal Environment Condition: 41 C Tdb, 21.1 C Tdp (32 % RH), and 0.2 m/s
30 32 34 36 38 40 42 44 46 48 0
30 60 90
1 2 0 1 5 0 Elapsed-Time (min)
Chicken Surface & Body Temp. (C)
T b - T r t Tb - Ctrl
T s u r f - T r t Tsurf - Ctrl
Thermal Environment Condition: 41 C Tdb, 21.1 C Tdp (32 % RH), and 1.2 m/s
3 0 3 2 3 4 3 6 3 8 4 0 4 2 4 4 4 6 4 8 0
30 60 90
120 150
E l a p s e d - T i m e ( m i n )
Chicken Surface &
Body Temp. (C)
Tb - Ctrl Tb - Trt Tsurf - Ctrl Tsurf - Trt
(a) (b)
Thermal Environment Condition: 41 C Tdb, 26.7 C Tdp (45 % RH), and 0.2 m/s
30 32 34 36 38 40 42 44 46 48 0
30 60 90
1 2 0 1 5 0 Elapsed-Time (min)
Chicken Surface &
Body Temp. (C)
T b - T r t T b - C t r l
T s u r f - T r t Tsurf - Ctrl
Thermal Environment Condition: 41 C Tdb, 26.7 C Tdp (45 % RH), and 1.2 m/s
3 0 3 2 3 4 3 6 3 8 4 0 4 2 4 4 4 6 4 8 0
30 60 90
120 150
E l a p s e d - T i m e ( m i n )
Chicken Surface &
Body Temp. (C)
Tb - Ctrl Tb - Trt Tsurf - Ctrl Tsurf - Trt
(c) (d)