Broad-temperature range spectroscopy of the two-centre modular
redox metalloprotein
Desulfovibrio desulfuricans
desulfoferrodoxin
Niels H. Andersen,
aSven E. Harnung,
bIb Trabjerg,
bIsabel Moura,
cJosé J. G. Moura
cand Jens Ulstrup
aa
Department of Chemistry, Building 207, Technical University of Denmark,
DK-2800 Lyngby, Denmark
b
Department of Chemistry, University of Copenhagen, Universitetsparken 5,
DK-2100 Copenhagen, Denmark
c
Departamento de Química and, Centro de Química Fina e Biotecnologia,
Faculdade de Ciéncas e Tecnologia, Universidade Nova de Lisboa, 2825-11 Caparica, Portugal
Received 1st April 2003, Accepted 2nd July 2003
First published as an Advance Article on the web 24th July 2003
The electronic–vibrational couplings of the two-centre non-heme iron protein Desulfovibrio desulfuricans desulfoferrodoxin (DFx) in three oxidation states, i.e. fully oxidised (grey), half-oxidised (pink), and fully reduced (colourless), have been investigated by variable temperature (VT) UV/VIS, MCD, CD, and EPR spectroscopy. The UV/VIS spectra of grey DFx at room temperature is characterised by broad charge transfer (CT) transitions associated with oxidised centre I (495 and 368 nm) and II (335 and 635 nm). The transitions are resolved at 78 K, substantiated by VT-MCD and -CD. The data offer novel information about the electronic–vibrational couplings
of the transitions. Multiphonon bandshape analysis discloses strong contributions from both local Fe–S and S–C stretching and solvent/protein modes. A number of transitions are blue- or red-shifted compared with monomeric desulforedoxin, superoxide reductase or dismutase, and cloned Desulfovibrio vulgaris DFx fragments. Conversion from grey to pink DFx is accompanied by drastic electronic–vibrational changes of both centres. The data suggest that electron transfer and optical CT-transitions of DFx are controlled by environmental reorganization in the whole region between the metal centres.
Introduction
Electron transfer (ET) has long been in strong focus as one of the most important elementary reaction steps in chemistry and biology. Both microscopic features and the organization of biological ET chains have been mapped in detail, and broad understanding of the central controlling factors achieved.1,2
A crucial notion is long-range ET between localized metal centres, for which the spatial separation significantly exceeds
the structural extension of the centres and their local environ-ment. A second feature is that ET function is frequently under-taken by proteins containing several redox centres, which mutually “communicate”. This notion implies not only that the centres exchange electrons but also that they affect each other,
by electrostatic interactions, or via the conformational protein system. The comprehensive mapping of cooperativity in the four-heme cytochromes c3 has, for example led to detailed
microscopic understanding of this protein.3,4
The large number of inter-heme contacts, and microscopic redox potentials is, however, prohibitive for complete microscopic mapping. In this respect redox metalloproteins with two centres offer special
perspectives. These proteins are prototypes for multi-centre electron transport, but structurally and functionally simple enough that complete thermodynamic, spectral, and kinetic mapping is in principle feasible. This offers microscopic insight
into both cooperative multi-centre ET and spectral interactions between the communicating centres, as reflected in CT and
other spectral transitions.5
In this report we address the modular two-centre non-heme iron redox protein DFx from the sulfate reducing bacterium Desulfovibrio desulfuricans (Dd).6 Our objective is to disclose
details of the electronic structure and electronic–vibrational couplings of the two centres, as well as changes of these couplings in the different oxidation states. DFx is engaged
in monomer–dimer equilibria.7 These are apparently Ca2⫹
-independent8 but Ca2⫹
-ions are indispensable when crystal-lising DFx,9 and both monomer–dimer equilibria and
conformational details may still be influenced by the presence
of Ca2⫹
-ions. The monomer is a 13.9 kDa, 125-residue protein.10
Well separated oxidation potentials of the two metal centres (⫹4 ± 10 mV and ⫹240 ± 10 mV vs. SHE),11 ensure that
three different oxidation states, grey, pink, and colourless, i.e.
FeI()FeII(), FeI()FeII() and FeI()FeII(), can be
char-acterised. In the following “FeI” and “FeII” refer to centre I
(low-potential) and II (high-potential), respectively. Com-prehensive room temperature (RT) spectroscopic (UV/VIS, Mössbauer, EPR, and resonance Raman spectroscopy)6,11
and a high-resolution three-dimensional X-ray crystal structure12
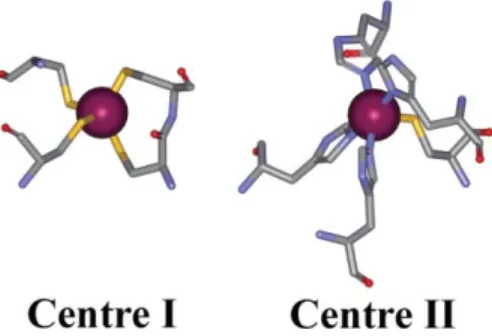
have disclosed many structural details (Figs. 1 and 2). FeI,
located in a 34-residue domain, resembles the rubredoxin-like Desulfovibrio gigas (Dg) desulforedoxin (Dx) Fe(S-Cys)4-centre
(Cys9, Cys12, Cys28 and Cys29), with two adjacent Cys-ligands
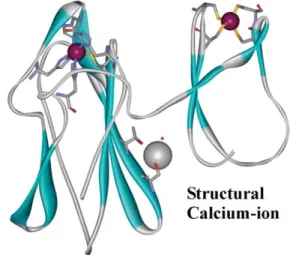
Fig. 1 Three-dimensional ribbon structure of the two domains of
Desulfovibrio desulfuricans DFx. Right and left: domain I and II respectively. Data source: 1DFX.pdb at http://www.biochem.ucl. ac.uk/ bsm/pdbsum. Graphic representation: Weblab Viewer Pro.
DOI
:
10.1039/
b303656a
in the coordination sphere.13 Fe
II is located in a 88-residue
domain 21.6 Å from FeI. In this Fe-centre, Fe(Nε-His)3
-(Nδ-His)(S-Cys), iron is coordinated to four histidines and an apical Cys in a distorted square pyramidal structure (His48, His68, His74, His118 and Cys115). This novel type of non-heme iron centre has been encountered in other proteins and reported to display superoxide dismutase (SOD) and reductase (SOR) activity.14–16 The N- and C-terminal fragments (modules)
of DFx from Desulfovibrio vulgaris (Dv) representing domain I and II, respectively, have also been expressed in Escherichia coli and characterised spectroscopically.17
High-resolution X-ray structures are available for Pyrococcus furiosus (Pf) SOR,18 to
which structural and spectral reference will be important in the following.19 The DFx structure shows a homo-dimer form
where two DFx molecules are related by a two-fold symmetry axis. The inter-domain region between the two DFx molecules holds six structural water molecules in an ordered hydrogen bond network in which a Ca2⫹
-ion is involved, indicative of enzyme and trigger function. The Ca2⫹
-ion which lies on the twofold axis of the DFx-dimer is ligated twice by Ser87 (both O and Oγ), Thr89 (Oγ) and a water molecule.
12 DFx shows, finally,
an interesting surface electrostatic charge distribution. The overall surface charge density is high and negative, but two patches of high positive charge are localized20 close to Fe
II and
may serve a molecular recognition function.
Distinct ligand-to-metal CT bands dominate the UV/VIS spectra of the two centres. The protein is therefore well suited for addressing electronic–vibrational coupling on optical excitation, and perhaps interactions between the centres. The present study first addresses the CT spectral properties of DFx
in the three states by UV/VIS spectroscopy in a broad temper-ature range. These data provide a spectral resolution, which has warranted analysis based on multiphonon optical bandshape theory2,21 for each of the 45 spectra covering the temperature
range from 78–298 K. VT-MCD and CD spectra of DFx in the three oxidation states have, secondly, been recorded. The electronic–vibrational coupling is strong, and suggests that conformational sub-states are present. Major structural/ conformational changes in both centres also accompany the conversion from pink to either grey or colourless DFx.
Experimental
Desulfovibrio desulfuricans was grown and DFx isolated and purified as described.6 Stock solutions (γ
DFx = 13.5 mg ml ⫺1,
A280/A495= 5.95) in TRIS/HCl buffer
(2-amino-1,3-dihydroxy-2-hydroxymethylpropane) pH 7.6 were prepared and stored at
⫺80 ⬚C.
Chemicals for buffers and protein handling, i.e. Na2HPO4ⴢ
2H2O, NaH2PO4ⴢ2H2O, (CH3)2AsO2H (cacodylic acid), Na2S2O4ⴢ
2H2O (sodium dithionite), NaOH, and CaO were analytical
grade. Water was Milli-Q (Milli-Q Housing). The amounts of components needed for buffer preparations were calculated
using the Davies equation for activity coefficient correction. All
Fig. 2 Three-dimensional structure of the two iron centres in
Desulfovibrio desulfuricans DFx. Left: centre I. Right: centre II. Data source: 1dfx.pdb at http://www.biochem.ucl.ac.uk/bsm/pdbsum. Graphic representation: Weblab Viewer Pro.
buffers were prepared as below with an ionic strength I = 30 m, and pH = 7.0 before mixing with glycerol. The latter was
added as a glassing agent in the ratio 2 : 1 (v/v). Solutions were vacuum-filtered through a 45 µm millipore filter and stored at
4 ⬚C.
Sodium cacodylate (NaCcd): dissolution of 2.394 g cacodylic acid in water, followed by 0.600 g NaOH in a 500 ml volumetric
flask.
Calcium cacodylate (CaCcd): sonication of CaO-powder (0.2804 g) in cacodylic acid (1.594 g) solution. After dissolution the volume was adjusted to 500 ml.
Phosphate buffer: dissolution of 0.1349 g Na2HPO4ⴢ2H2O
and 0.1133 g NaH2PO4ⴢ2H2O in 100 ml water.
Glycerol (99.5% pure) was distilled twice at low pressure. The boiling point in the final distillation was 111 ⬚C at 0.01 mmHg.
DFx: after thawing the frozen DFx stock solution, the protein was stored at 4 ⬚C as a mixture of grey and pink DFx
in TRIS buffer pH 7.6. The DFx solution was filtered (45 µm)
before transfer to the buffer with no further purification.
Transfer to other buffers was carried out by ultrafiltration. Grey
DFx was prepared by adding a few granules of K2[IrCl6]
(potassium hexachloro-iridate(), equilibrium oxidation
potential 867 mV versus SHE) to the protein solution in an Amicon cell. Residual [IrCl6]
2⫺/3⫺
was removed by
ultra-filtration. The final buffer (phosphate for all types of
spectro-scopy) was added and removed three times. NaCcd or CaCcd buffers was used for the low-temperature absorption
spectro-scopy experiments. Colourless DFx was prepared by adding a few granules of sodium dithionite to the Amicon cell. The solutions were ultrafiltered (YM3 filter) under argon. Colour-less DFx is air-sensitive and oxidises partially to pink DFx if a reducing agent is not present. The final solutions were therefore
always pink, i.e. they had become partially re-oxidised by air. A few granules of dithionite were added to the cuvette just before immersion into the cryostat. The absence of colour was verified by visual inspection. Pink DFx was prepared via
complete reduction to the colourless form with dithionite, followed by removal of dithionite by ultrafiltration, and
re-oxidation of FeI by air exposure. The cuvette with dithionite
free DFx-solution was left overnight at 4 ⬚C before use. The
solutions became pink but the exact percentage of oxidation remained unknown.
Absorption spectroscopy
Low-temperature absorption spectra were recorded on a Varian Cary 5E UV-VIS-NIR double-beam spectrophotometer, equipped with an Oxford Instruments DN liquid bath cryostat. The cryostat was fitted into the sample beam with an in-house
made adapter. The wavelength scale (reproducibility ± 0.0125 nm or ½ cm⫺1 at 500 nm) was calibrated against didymium
and holmium oxide filter-glasses (Varian, Inc.). Pre-heating
for at least two hours prior to use ensured stable conditions for spectrophotometer lamps (deuterium and tungsten type), the nitrogen purged optical system, and the detectors.
The cryostat sample chamber was modified by introduction
of a helium gas purge facility to ensure atmospheric pressure conditions, effective thermal contact, and to prevent
conden-sation of vaporised solvent at the inner optical windows. The optical window material (spectrosil-WF Quartz) is transparent in the range 190–3500 nm.
Two computers controlled the spectrophotometer and the cryostat. One computer controlled a spectral scan every 25 min via the Varian software, the second one an Object Bench visual basic macro, which ensured sample temperature equilibrium in five min every 25 min (20 min was required for thermal
equilibrium). Spectra were recorded at 45 different
an ice–water mixture. The absolute T-deviation was less than 1 K, and the reproducibility better than 0.1 K.
All samples were contained in polymethylmethacrylate (PMMA) cuvettes. PMMA has excellent transparency in the range from 260 to 1600 nm. In contrast to glass or quartz, PMMA is robust to solidification of the buffer/glycerol mixture,
but there is a significant spectral absorption difference within
individual PMMA-cuvettes. The same cuvette was therefore used for both sample and background scanning. Absorption spectra in the T-range 298–78 K in the whole UV/VIS range for the three oxidation states of DFx in NaCcd buffer were first
recorded. As DFx is engaged in Ca2⫹
-dependent monomer– dimer equilibria, similar recordings in CaCcd buffer were also
undertaken. The RT equilibrium concentration of DFx, at which half of the monomer is left in a two-state monomer– dimer model, is reported to be 1 µ.8 The DFx concentration in
all samples was in the range 23–78 µ. This corresponds to
monomer fractions in the range 15–8%, if temperature, solvent, and other effects are disregarded, but these figures may vary
significantly over the broad temperature range used.
MCD and CD spectroscopy
MCD spectroscopy was recorded with two spectropolarimeters. The first one was an in-house rebuilt Cary 14
spectrophoto-meter, the second one a Jasco-710 spectropolarimeter. Both instruments were equipped with the same Oxford Instruments SM3 liquid helium superconducting split-coil cryostat. The CD-intensity was calibrated against 5 m 2{Λ-(⫹)-[Co(en)3
]-Cl3}ⴢNaClⴢ6H2O in water.
22 The wavelength was calibrated with
didymium and holmium oxide glass-filters.
The sample holder was fitted with a carbon-glass resistance
temperature sensor and two wire-wound resistive heating elements with electrical supply from an ITC2 temperature controller. The best temperature control was achieved by running the ITC2 automatically with application of a slight liquid helium flow into the sample chamber while pumping
to vacuum. The temperature was calibrated against boiling liquid helium and boiling nitrogen. The temperature range was 6.6–82 K, and the magnetic field strength in the range
0–4 T.
90 µl of DFx solution was mixed with 180 µl glycerol in a round flat quartz QS 0.1 cm cuvette with a lower volume-limit
of 283 µl. Mixing of sample and glycerol was continued until no refraction inhomogeneity could be observed. The cuvette was fastened in the sample holder and immersed into the cryostat while flushing with helium gas. The temperature was allowed to
drop rapidly to 160 K before evacuation of the sample chamber. At T= 120 K the sample cracked into a fragmented but highly transparent glass. Tg of the aqueous/glycerol solvent mixture
1 : 2 (v/v) is ≈163 K. The transparency of the sample was controlled by visual inspection.
A CD spectrum was recorded before application of the magnetic field for all three DFx forms. After applying the field
parallel to the direction of light propagation, MCD-spectra were recorded at T= 82, 61.9, 35.3, 18.8, 10.6, 7.9 and 6.6 K. The magnetic field was then reversed and the spectra at 6.6 and
82 K recorded again. The corrected pure MCD and CD spectra were calculated as half of the differences and sums, respectively,
of the parallel/antiparallel field spectral pairs.
EPR spectroscopy
A X-band EPR spectrum of grey DFx in glycerol/buffer 2 : 1
(v/v) at T = 9 K was recorded with a Bruker instrument (ESP 300 spectrometer, ER 083 Microwave Bridge, and ER 083 (200/60) magnet) combined with an Oxford Instruments liquid helium flow cryostat. The microwave frequency was 9.403 GHz.
DFx was oxidized with K2[IrCl6] and excess [IrCl6] 2⫺/3⫺
removed by a three-fold solvent exchange in a Centricon concentration cell. Mixing of glycerol and DFx was carried out directly in
the NMR-tube used for the EPR spectrometer. The final DFx
concentration was ≈500 µ.
Optical spectral analysis
Optical spectral data were recorded as absorbance, A, versus wavelength, λ (nm). Background-data were subtracted point by point with use of no interpolations. The spectra were corrected for nitrogen gas refraction and converted to A versus wave-number-in-vacuo, ν˜/µm⫺1. The molar absorption coefficients, ε,
and DFx-concentrations were determined via the RT 495 nm peak absorbance and molar absorption coefficient, ε495= 4980 ⫺1 cm⫺1 (498 m2 mol⫺1).4 An overview of absorption-,
MCD-and CD- spectral observations of DFx at T= 78 K in the grey, pink and colourless forms is given in Table 1.
The files were transformed to molar-absorption-coefficient
per wavenumber (εν˜⫺1/10⫺3 m3 mol⫺1 versus ν˜/µm⫺1) prior to
bandshape analysis. Spectral data were analysed on the basis of optical bandshape theory for CT transitions in condensed media (see later). In the following we shall refer to spectral bands via their wavelengths at T= 78 K. An overview of all
fitted Gaussian bands is given in Tables 2 and 3.
Results and discussion
General optical spectral properties of the three redox states of DFx
Figs. 3–5 show VT absorption, MCD, and CD spectra of grey, pink and colourless DFx. Absorption spectra were recorded in the T-range 78 to 298 K, VT-MCD and CD spectra in the range 6.6 to 82 K. Grey (Fig. 3) and pink DFx (Fig. 4) show strong visible (Fe3⫹
cys-S⫺
) CT absorption bands in the range 800 nm to 300 nm with maxima at 495 and 368 nm at RT.9 These
peaks follow closely those of Dg Dx (508 and 372 nm),23 Clostridium pasteurianum (Cp) Dx (495 and 380 nm)24
and Cp rubredoxin (Rd) (487 and 378 nm),25 which can be regarded as
reference molecules for FeI. Grey DFx exhibits additional broad
RT contributions at 635 and 335 nm.9 These can be assigned to
(Fe3⫹
cys-S⫺
) transitions in FeII and have analogues in Archaeoglobus fulgidus (Af) Neelaredoxin (Nlr) (648 and 318 nm),26Treponema palladium (Tp) Nlr (656 and 320 nm)27
and Pf SOR (635 and 335 nm),19 which constitute a second
group of reference molecules. The absorption spectrum of colourless DFx (Fig. 5), shows little absorption in the VIS region, but several near-UV transitions of the (Fe2⫹
cys-S⫺
) type between 380 and 280 nm. This picture has been confirmed
by recombinant techniques where the Dv DFx domains I and II have been expressed separately and characterised optically and in other ways.17
Much more detail is disclosed at low temperature and in combination with VT-MCD and CD. Common to the UV/VIS spectra in Figs. 3–5 is a clear increase in band resolution and a weak shift in band position as the temperature is lowered. We refer to band positions particularly at T= 78 K in the following. Peaks at 440 nm and 565 nm in the grey DFx spectrum, largely hidden at RT emerge. These transitions are not apparent in pink DFx and can be associated with FeI. The spectral
features of pink DFx are less resolved at low temperature, per-haps in part due to difficulties in controlling the redox level of
this form. The VT MCD and CD spectra are, however, much better resolved. The spectral detail in Fig. 3 warrants band-shape analysis of grey DFx. A feature of several of the bands is a transition from almost temperature independent bandwidth at low temperatures to approximately √T-dependence at higher temperature. This could reflect a change in the mode of nuclear
displacement that accompanies the transitions, from thermal motion at high temperatures to nuclear tunnelling at low temperatures.2 Several of the apparent coupling factors are,
Table 1 Spectral characteristics (UV/VIS absorption, MCD and CD) of grey, pink, and colourless (Col) DFx
Absorption MCD CD
Wavelength/nm
Wavenumber/µm⫺1 Wavenumber/µm⫺1 Wavenumber/µm⫺1
Grey Pink Col Grey Pink Col Grey Pink Col Assignment
280 3.57 3.57 3.57 π* π
299 3.35sh 3.35sh NaG
0, CaG0
304 3.30sh 3.29⫺ 3.30⫹ 3.30⫹ redI
312 3.21sh 3.18⫺ A⫺ redII, CaG
1
319 3.13 3.14sh 3.15⫹ 3.13⫹ 3.15⫺ 3.15⫹ oxII, NaG
1
326 3.07⫺
335 2.94 2.95sh 2.98⫺ 2.98⫹ 2.95sh 2.98⫹ 2.95⫹ oxII
364 2.75 2.74⫹ 2.72⫺ oxI, oxII, NaG
2
370 2.70sh 2.70sh 2.70⫹ 2.70sh CaG
2
385 2.60⫹
392 2.55sh⫺ 2.55⫺
408 2.46⫹ 2.45⫹ oxI, NaG
3, CaG3
417 2.40⫺ 2.40⫺
426 2.35sh 2.35sh⫺ 2.35⫺
440 2.27 2.26⫹ 2.28⫺ oxI, NaG
4, CaG4
461 2.17⫺
476 2.10sh⫺ 2.10sh⫺
490 2.04
500 2.00 A⫺ 2.00⫺ oxI, NaG
5, CaG5
521 1.92⫹ 1.93⫹
543 1.85sh 1.83⫹ oxII, CaG
6
565 1.77 1.78⫹ 1.77⫹ 1.78sh⫺ oxI, NaG
6, CaG7
610 1.64⫺ oxII, NaG
7
625 1.60sh 1.60⫺ CaG
8
641 1.56sh 1.56sh⫹ oxII, NaG
8
654 1.53sh⫹
694 1.45sh 1.44⫹
714 1.40sh 1.40⫺ (d d)
769 1.30⫹
833 1.20sh
Wavelengths (nm at 78 K) are listed to the left. Wavenumbers (µm⫺1) for absorption maxima and local maxima or minima in MCD and CD are
shown in the middle part. “sh” indicates a shoulder and “⫹” or “⫺” indicate local MCD or CD extrema. These are in MCD mostly due to C-terms but an “A” indicates the presence of an A-term.
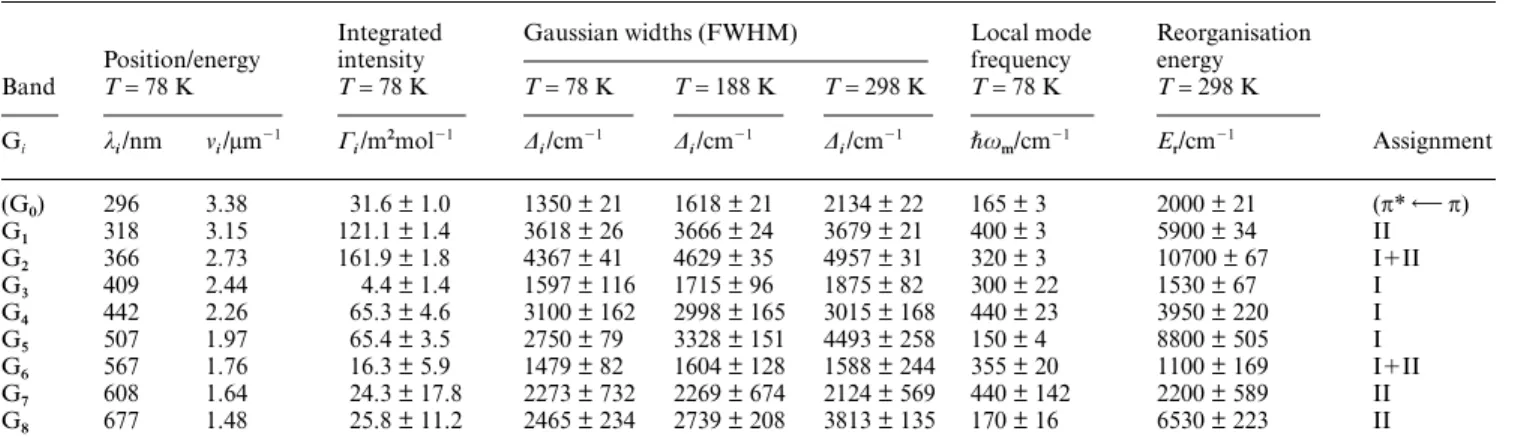
Table 2 Gaussian bandshape parameters of the UV/VIS absorption spectra of grey DFx
Band
Position/energy
Integrated intensity
Gaussian widths (FWHM) Local mode frequency
Reorganisation energy
Assignment
T= 78 K T= 78 K T= 78 K T= 188 K T= 298 K T= 78 K T= 298 K
Gi λi/nm νi/µm
⫺1 Γ
i/m2mol
⫺1 ∆
i/cm
⫺1 ∆
i/cm
⫺1 ∆
i/cm
⫺1 បω
m/cm
⫺1 E
r/cm
⫺1
(G0) 296 3.38 31.6 ± 1.0 1350 ± 21 1618 ± 21 2134 ± 22 165 ± 3 2000 ± 21 (π* π)
G1 318 3.15 121.1 ± 1.4 3618 ± 26 3666 ± 24 3679 ± 21 400 ± 3 5900 ± 34 II
G2 366 2.73 161.9 ± 1.8 4367 ± 41 4629 ± 35 4957 ± 31 320 ± 3 10700 ± 67 I⫹II
G3 409 2.44 4.4 ± 1.4 1597 ± 116 1715 ± 96 1875 ± 82 300 ± 22 1530 ± 67 I
G4 442 2.26 65.3 ± 4.6 3100 ± 162 2998 ± 165 3015 ± 168 440 ± 23 3950 ± 220 I
G5 507 1.97 65.4 ± 3.5 2750 ± 79 3328 ± 151 4493 ± 258 150 ± 4 8800 ± 505 I
G6 567 1.76 16.3 ± 5.9 1479 ± 82 1604 ± 128 1588 ± 244 355 ± 20 1100 ± 169 I⫹II
G7 608 1.64 24.3 ± 17.8 2273 ± 732 2269 ± 674 2124 ± 569 440 ± 142 2200 ± 589 II
G8 677 1.48 25.8 ± 11.2 2465 ± 234 2739 ± 208 3813 ± 135 170 ± 16 6530 ± 223 II
In sodium cacodylate buffer/glycerol, 1 : 2 (v/v) (I= 30 m, pH = 7.0 before addition of glycerol) Fig. 6a. The eight Gaussian CT bands, Gi, i= 1–8 are
characterized by their maximum wavelength, λi, and frequency, νi, integrated band intensities, Γi, and bandwidths (FWHM), ∆i, at the three
temperatures indicated. The average vibrational frequency, ωm is determined by the temperature variation of the bandwidths (Fig. 9a). The total
reorganization free energy, Er, is obtained from the high-temperature form of the bandwidth in eqn. (7a) for ωm≥ 300 cm
⫺1. The T-independent
bands (G1, G4, and G7) can only provide one form, eqn. (7b).
of the CT spectra show vibrational fine-structure which is,
however, visible at low T in the strong 280 nm aromatic protein region (DFx contains 3 Trp, 3 Phe, 4 Tyr, and 9 His).
The VT-MCD spectra follow the low-T absorption spectra but also show differences, both from the absorption spectra and
from the spectra of monomeric reference molecules Dg Dx,23 Af Nlr22,27
and Pf SOR.19
The 641 nm and 335 nm con-tributions of grey DFx assigned to FeII correspond to positive
C-terms in the VT-MCD spectrum (Fig. 3). Other strong posi-tive C-terms are located at 565 nm, 521 nm and 370 nm. The
565 nm and 370 nm C-terms accord with the absorption bands for FeI at 565 nm and 364 nm, which become resolved at low
temperatures. The 565 nm band is also likely to hold a FeII
component, by comparison with the VT-MCD spectra of Pf SOR19 and with pink DFx (Fig. 4). The MCD band around 521
nm holds a T-dependent A-term as well. This transition accords with the 500 nm FeI absorption band disclosed at low
temper-atures and overlapping with the 440 nm band. The 521 and 440 nm FeI absorption bands are thus convoluted into the 495 nm
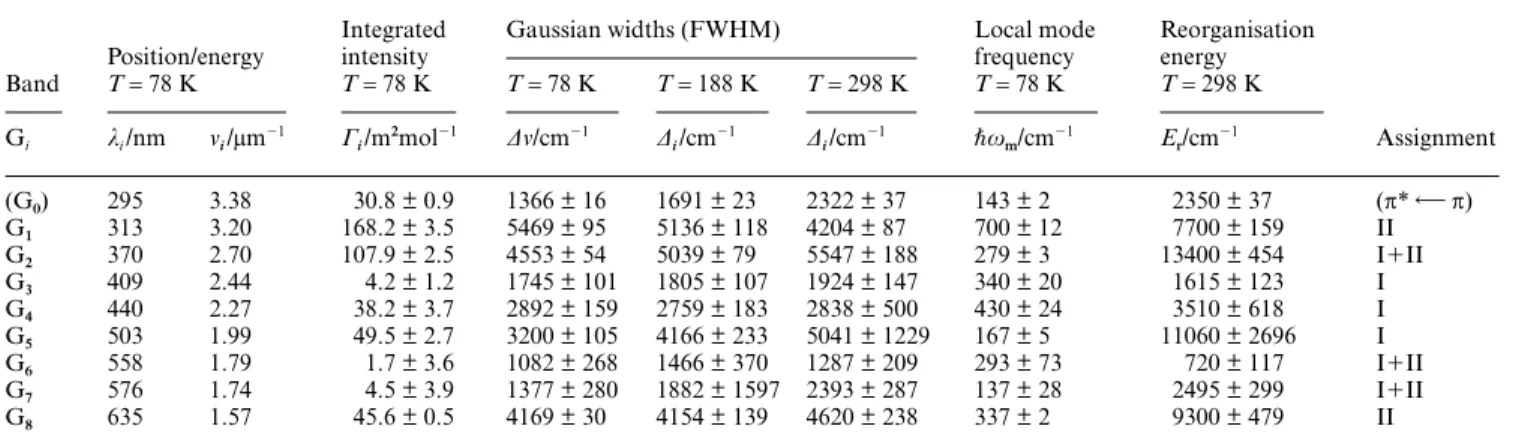
Table 3 Gaussian bandshape parameters of the UV/VIS absorption spectra of grey DFx
Band
Position/energy
Integrated intensity
Gaussian widths (FWHM) Local mode frequency
Reorganisation energy
Assignment
T= 78 K T= 78 K T= 78 K T= 188 K T= 298 K T= 78 K T= 298 K
Gi λi/nm νi/µm
⫺1 Γ
i/m2mol
⫺1 ∆v/cm⫺1 ∆
i/cm
⫺1 ∆
i/cm
⫺1 បω
m/cm
⫺1 E
r/cm
⫺1
(G0) 295 3.38 30.8 ± 0.9 1366 ± 16 1691 ± 23 2322 ± 37 143 ± 2 2350 ± 37 (π* π)
G1 313 3.20 168.2 ± 3.5 5469 ± 95 5136 ± 118 4204 ± 87 700 ± 12 7700 ± 159 II
G2 370 2.70 107.9 ± 2.5 4553 ± 54 5039 ± 79 5547 ± 188 279 ± 3 13400 ± 454 I⫹II
G3 409 2.44 4.2 ± 1.2 1745 ± 101 1805 ± 107 1924 ± 147 340 ± 20 1615 ± 123 I
G4 440 2.27 38.2 ± 3.7 2892 ± 159 2759 ± 183 2838 ± 500 430 ± 24 3510 ± 618 I
G5 503 1.99 49.5 ± 2.7 3200 ± 105 4166 ± 233 5041 ± 1229 167 ± 5 11060 ± 2696 I
G6 558 1.79 1.7 ± 3.6 1082 ± 268 1466 ± 370 1287 ± 209 293 ± 73 720 ± 117 I⫹II
G7 576 1.74 4.5 ± 3.9 1377 ± 280 1882 ± 1597 2393 ± 287 137 ± 28 2495 ± 299 I⫹II
G8 635 1.57 45.6 ± 0.5 4169 ± 30 4154 ± 139 4620 ± 238 337 ± 2 9300 ± 479 II
In calcium cacodylate buffer/glycerol, 1 : 2 (v/v) (I= 30 m, pH = 7.0 before addition of glycerol) Fig. 6b. Same notation and procedure as in Table 2.
absorption spectra and in the VT-MCD spectra at 500 nm. Two strong negative MCD features at 417 and 461 nm are likely to accord with two components of the 440 nm absorption band.
In summary, grey DFx displays two broad absorption bands at 500 nm (RT 495 nm) and 370 nm (RT 368 nm) associated with FeI, and two other absorption contributions at 641nm (RT
635 nm) and 335 nm (RT 335 nm) which also appear directly as MCD bands, associated with FeII. The 500 nm absorption band
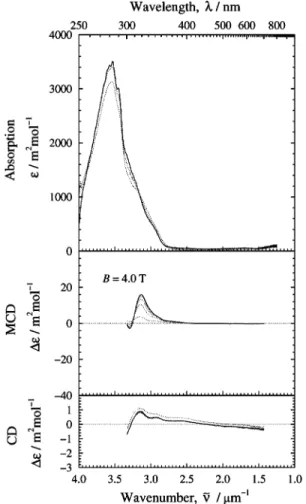
is resolved into three bands at 440 and 500 nm at low temper-atures where the additional band at 565 nm is also disclosed. Fig. 3 Spectra of fully oxidised, grey Desulfovibrio desulfuricans DFx. Top scale: wavelength λ/nm. Left scales: molar absorption coefficient and the corresponding difference; ε/m2 mol⫺1 and ∆ε/m2 mol⫺1,
respectively. Bottom scale: in-vacuo wavenumber ν˜/µm⫺1. Upper panel:
absorption spectra at 78 K (—); spectra at 188 and 298 K are also shown (. . .). Sodium cacodylate buffer pH 7.0, I= 30 m mixed with glycerol, in the ratio 1 : 2 (v/v). Middle panel: MCD spectra at T= 80 K (small intensity —), and 6.6 K (large intensity —). Lower panel: CD spectrum at T= 6.6 K (—). The buffer for the MCD and CD spectra was sodium phosphate pH 7.0, I= 30 m mixed with glycerol, 1 : 2 (v/v).
The sub-band at 440 nm of the 500 nm FeI band is further
composite as seen by a negative C-term VT-MCD band at 417 nm and a negative A-term band at 500 nm but VT-MCD contributions from FeII may also contribute here. The 335 and
641 nm FeII assigned absorption contributions remain largely
unresolved in both absorption and VT-MCD spectroscopy (see, however, later and Table 2) but the strong A-term MCD feature at 500 nm and C-term feature at 565 nm are likely to contain contributions from both centres.
Fig. 4 Spectra of half-reduced, pink Desulfovibrio desulfuricans DFx. Top scale: wavelength λ/nm. Left scales: molar absorption coefficient and the corresponding difference; ε/m2 mol⫺1 and ∆ε/m2 mol⫺1,
respectively. Bottom scale: in-vacuo wavenumber ν˜/µm⫺1. Upper panel:
The absorption bands of pink DFx, Fig. 4, are less well resolved than for grey DFx, with little improved resolution at low temperatures. As noted, both the absorption spectra and the VT-MCD spectra may contain contributions from grey DFx. Bandshape analysis is therefore focused on grey DFx but the absorption and VT-MCD spectra of pink DFx offer other
observations. Broad absorption bands at 490 to 543 nm, 370, 335 and 319 nm can be identified. The former two bands
are associated with oxidised FeI but clearly broadened and
red-shifted compared with grey DFx. The 319 nm band is likely to hold components from both oxidised FeI and reduced FeII.
The strong VT-MCD features in the 520 to 560 nm and 400 to 500 nm regions, Fig. 4, accord with the absorption spectra and are dominated by contributions from oxidised FeI, as colourless
DFx only displays VT-MCD in the 310 to 340 nm region (Fig. 5, cf. below). The A-term VT-MCD transition of oxidised FeI has, interestingly, disappeared but a significant negative
C-term at ≈ 476 nm remains. Both a FeII A-term and a FeI
C-term therefore contribute to the strong VT-MCD feature at
≈ 500 nm in grey DFx. The VT-MCD band intensities are, however, significantly reduced compared with the similar bands
of grey DFx and less resolved than the corresponding VT-MCD bands for oxidised Cp Rd and Dg Dx.24,27 The former
effect substantiates that oxidised FeII contributes significantly
to the VT-MCD bands in the whole 450 to 641 nm range in grey Fig. 5 Spectra of fully reduced, colourless Desulfovibrio desulfuricans
DFx. Upper panel: wavelength λ/nm. Left scales: molar absorption coefficient and the corresponding difference; ε/m2 mol⫺1 and ∆ε/m2
mol⫺1, respectively. Bottom scale: in-vacuo wavenumber ν˜/µm⫺1. Sodium
dithionite background spectra have been subtracted. Upper panel: absorption spectra at 78 K (—); spectra at 188 and 298 K are also shown (. . .). Sodium cacodylate buffer pH 7.0, I= 30 m mixed with glycerol in the ratio 1 : 2 (v/v). Middle panel: MCD spectra with increasing peak height at T= 80 K (. . .), 16.6 K (. . .), 10.2 K (. . .), 7.9 K (. . .), and 6.6 K (—). Lower panel: CD spectrum with increasing peak height at T= 80 K (. . .), 16.6 K (. . .), 10.2 K (. . .), 7.9 K (. . .), and 6.6 K (—). The buffer for the MCD and CD spectra was sodium phosphate pH 7.0, I= 30 m mixed with glycerol, 1 : 2 (v/v).
DFx, as anticipated from the VT-MCD spectra of oxidised Pf SOR where a positive MCD-feature emerges at 526 nm.19
The 370 nm FeI VT-MCD feature in grey DFx is significantly
blue-shifted to 335 nm in pink DFx. Together with the drastically changed character of the negative 417 and 476 nm VT-MCD features between grey and pink DFx, the notable absorption band shifts are indications that major conform-ational reorganisation extending to the whole region between the centres, or temperature dependent monomer–dimer equilibrium shifts accompany reduction of FeII. Major
con-formational reorganisation also emerges from the absorption spectral analysis in the next section.
Colourless DFx has absorption shoulders at 304, 312 and 335 nm, most likely associated with (Fe2⫹
S⫺
) transitions. The
first and last can be assigned to FeI, the middle to FeII. This is
matched by the VT-MCD spectrum, which shows a single strong positive feature at 319 nm with a shoulder at 335 nm and a moderate negative feature at 304 nm (Fig. 5). Dithionite has a MCD band in the same region but much weaker than those in Fig. 5. Three MCD features of colourless DFx (304 nm ⫺,
319 nm ⫹ and 335 nm ⫹) match similar bands of reduced Pf
SOR (280 nm ⫺, 295 nm ⫹ and 321 nm ⫹)19 but are red-shifted
compared with the Pf SOR bands. The different Fe–ligand
distances in Pf SOR28 (here the Cys-S corresponding to Cys115
is significantly more distant while the His corresponding to
His48 and His74 are closer and His68 and His118 are more distant) could explain both the different energies and intensity
ratios. The latter may also be indicative of a component from FeI such as expected from a similar VT-MCD band of reduced Dg Rd (306 nm ⫺ and 333 nm ⫹).29 The band shift again
suggests that other conformational changes accompany the conversion of pink to colourless DFx.
Fig. 6a and b show the UV/VIS absorption spectra of grey DFx, in εν˜⫺1/10⫺3 m3 mol⫺1, versus ν˜/µm⫺1 form, in NaCcd and
CaCcd buffers, respectively, at T = 78, 188, and 298 K. The
dimeric form of DFx is likely to be promoted in CaCcd buffer.
The CT transitions are broadly the same as in NaCcd buffer but
changes in width and maximum of some bands are conspicuous in the analysis below. This also applies to pink DFx (not shown).
EPR spectroscopy
An EPR-spectrum of grey DFx was also recorded, Fig. 7, upper panel. It consists of contributions from both centres. The resonances at geff= 7.88, 5.8, ≈ 4 (clearly of composite nature)
and 1.8 are also found in pink DFx and are caused by oxidised FeI.
6 The resonance at
geff= 9.11 and further contributions to
the resonance at ≈ 4.3 are observed only in grey DFx and accordingly, assigned to oxidised FeII.
11 Later work has con-firmed this assignment.17
The simulated EPR-spectra are shown in Fig. 7, lower panel, which shows the generated spectra of the two oxidised centres separately and their sum. Each spectrum was generated assuming a 6A ground state of a d5 electron system using the
spin-Hamiltonian
where µB is the Bohr magneton, ge the Landé g-factor for the
free electron, B the applied external magnetic field, Sˆ the total spin angular momentum operator and Hzfs the zero-field
splitting Hamiltonian. The latter comprises here only quadratic terms
where D and E are the zero-field splitting parameters. It follows
from early work30 that a E/D ratio can always be chosen within
the interval ⫺1/3 < E/D < ⫹1/3 with E positive and D either
positive or negative. Further, close to the limiting cases E/D=
Hspin=µBgeBⴢSˆ⫹Hzfs (1)
±1/3, the sign of D cannot be determined by an EPR experi-ment. Sometimes in the literature the case E/D= 1/3 has been called “isotropic”, but the zero field splitting is always isotropic
and the external magnetic field splitting is only isotropic when D and E vanish, i.e. in cubic or icosahedral symmetry.
EPR-spectra of either DFx centre in oxidised form were simulated using a published PC-programme31
and optimised parameters from previous work.6,11,17 The generic parameters of
oxidised FeI were D= 0.75 cm
⫺1 and E/D= 0.083. The simulated
EPR-spectrum of oxidised FeII was similarly generated using D=⫺1.40 cm⫺1 and E/D=⫺0.31. This value of the D parameter
was found from Mössbauer spectral data.11 In the absence of
an external magnetic field the three doublets are equally spaced
by the amount 4√7D/3 = 4.94 cm⫺1. Diagonalisation of the
energy matrix of the spin Hamiltonian, eqn. (1), within the
6A manifold shows that the resonance at g
eff≈ 4.3 is due to a
transition within the middle doublet, and that it is virtually isotropic up to B≈ 1 T but not beyond.
Temperature dependent optical charge transfer bandshapes
Clues to the electronic–vibrational coupling pattern of the CT bands of DFx and possible structural inhomogeneity come Fig. 6 Top scale: wavelength λ/nm. Left scale: molar absorption coefficient per wavenumber εν˜⫺1/10⫺3 m3 mol⫺1. Bottom scale: in-vacuo
wavenumber ν˜/µm⫺1. Spectra at three temperatures (T= 298 K, 188 K,
and 78 K; increasing sharpness) are shown (. . .). The individual Gaussians (Gi) and their sum are shown (—). Vertical lines (. . .) indicate
the fitted data range. (a) Gaussian band analysis of the spectra of fully oxidised grey Desulfovibrio desulfuricans DFx in sodium cacodylate buffer pH 7.0, I= 30 m mixed with glycerol, 1 : 2 (v/v). (b) Gaussian band analysis of the spectra of fully oxidised grey Desulfovibrio desulfuricans DFx in calcium cacodylate buffer pH 7.0, I= 30 m mixed with glycerol, 1 : 2 (v/v).
from multiphonon absorption bandshape analysis. We shall use the formalism below, which is appropriate for strong electronic– vibrational couplings and the basis for the bandshape analysis in the next section.2,21,32
The molar absorption coefficient ε at the frequency ν, is given
by
where c is the speed of light in the solvent and h Planck’s constant. The bandshape functions for CT between the ground (“g”) and excited (“e”) state, Keg, will be taken as Gaussians
Fig. 7 Upper panel: the EPR spectrum of fully oxidized grey Desulfovibrio desulfuricans DFx in sodium cacodylate buffer pH 7.0, I=
30 m mixed with glycerol, 1 : 2 (v/v). T= 8.2 K, microwave frequency
ν= 9.403 GHz. geff= 9.11, 7.88, 5.8, ≈4 (clearly of composite nature),
1.8. The signal at geff= 2.1 is due to a slight excess of [IrCl6]2
⫺
used to ensure that DFx was completely oxidised. Lower panel: simulated EPR spectra:31 Top: sum of EPR spectra, each simulated by the
spin-Hamiltonian, eqn. (1), within the 6A ground term of Fe(). Middle:
simulation of EPR spectrum of centre I, FeI(): geff= 7.8, 5.8, ≈4.0, and
1.8. Spin-Hamiltonian parameters E/D= 0.062/0.75 = 0.083. Bottom: simulation of EPR of centre II, FeII(): geff = 9.3, ≈4.3 (with fine
structure); Spin-Hamiltonian parameters ε/D= 0.43/(⫺1.40) =⫺0.31.
(3)
where νmax is the frequency at the Gaussian maximum, ∆env the
full width at half maximum (FWHM) for homogeneous environmental broadening, and Meg the electronic transition
dipole. The whole CT spectrum is represented by sums of individual Keg(ν) (eqn. (4)) inserted into eqn. (3).
Eqn. (3) and (4) imply the following about the mechanism of the transition:
a) The analysis includes the absorption frequency in the pre-exponential factor (eqn. (3)). This affects the bandshape
parameters for broad absorption bands such as for grey and pink DFx.
b) Electronic–vibrational coupling to a manifold of continu-ous, linear solvent or protein modes, or to local harmonic low frequency modes is the dominating broadening mechanism. Specific nuclear modes are metal–ligand stretching modes, but
many of the bandwidths correspond to much larger reorganiz-ation free energies than for coupling solely to these modes in thermal ET.33 Significantly larger bond reorganization, as well
as protein and solvent reorganization are therefore likely to accompany the optical transitions. Conversion between diff
er-ent conformational states, such as suggested from Mössbauer spectroscopy11 could also be important for some of the
transitions.
c) Bandshape features determined by excited state lifetimes are disregarded. This would give Lorentzian or Voigtian spectral profiles.
d) A suitable, homogeneous bandwidth form is2,21
where ωm is the frequency at the maximum of the nuclear frequency distribution coupled to the transition, Er the overall
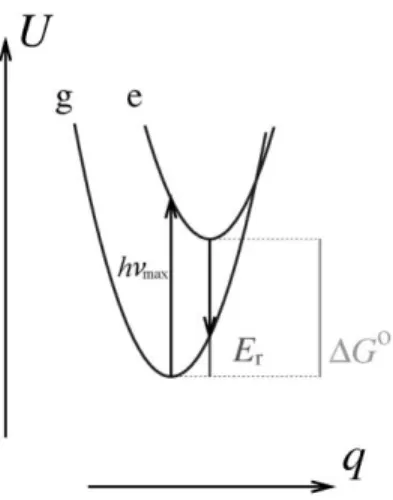
nuclear reorganization free energy (electronic-vibrational coupling factor), k Boltzmann’s constant, and T the temper-ature. The relation between the energy maximum of the optical transition, hνmax, and Er, is (Fig. 8)
where ∆G⬚ is the thermodynamic free energy gap between the
ground and excited states.
e) The bandwidth takes the following limiting forms at high (“h”) and low (“l”) temperatures
(5)
Fig. 8 Potential Gibbs free energy surfaces of the ground “g” and excited state “e” of optical CT transitions. The free energy gap, ∆G⬚, and total nuclear reorganisation energy Er (local and environmental)
corresponding to eqn. (4) are shown.
hνmax=Er⫹∆G⬚ (6)
(7a)
∆env thus depends linearly on √T at high T and is independent
of T at low T. Eqn. (7a) and (7b) represent different physical
behaviour of the nuclear displacement, i.e. thermal activation in the high-T limit, and activationless nuclear tunnelling in the low-T limit.
f ) Inhomogeneous broadening and distributions of conform-ational states are also formally represented by eqn. (4) and (5). The width then represents the conformational distribution, convoluted with homogeneous Gaussian broadening. Conform-ational mode freezing around the glass transition temperature rather than transition between nuclear tunnelling and thermal activation is then a feature of the T-pattern of the bandwidth. This seems to be the case for several transitions in grey and pink DFx.
g) Eqn. (3)–(7) constitute a formal frame adequate for grey and pink DFx, rather independently of the broadening mech-anism. The frame can be extended to multi-mode dynamics, anharmonic modes, etc. as warranted.2,21,32 Harmonic local
modes would be particularly the metal–ligand (250–400 cm⫺1)
and Cys-S–Cβ stretching modes, cf. below. These would be
incorporated in the homogeneous bandwidths at room tem-perature. At low temperatures they would be converted to vibrational progressions broadened by the protein/solvent. Since the protein/solvent broadening is strong and the many electronic transitions already need a large number of param-eters the vibrational progressions can be regarded as part of the temperature dependent homogeneous bandwidth in eqn. (5) and (7) which also represent the nuclear tunnelling behaviour inherent in the vibrational progression.
Charge transfer bandshape analysis and vibronic coupling patterns of grey DFx
The following analysis is based on a 27-parameter system comprising eight Gaussians (no. 1–8) accounting for the CT region of grey DFx in NaCcd and CaCcd buffers, respectively,
in addition to an extra Gaussian (no. 0) accounting for the near-UV (π* π) band wing (Fig. 6a and b). This numerical system converged when applied to each of the 45 recorded spectra, beginning with the spectrum for the lowest temper-ature, resulting in 27 × 45 parameters. With this number of parameters numerical instability was occasionally encountered for the spectra at higher temperatures. The wavelengths of all band maxima depend weakly on the temperature. This excludes the fact that vibrational frequency changes and other non-linear electronic–vibrational features are important. Focus is instead on the temperature dependence of the bandwidths.
DFx charge transfer spectra in sodium cacodylate buffer. The bandshape parameters are collected in Table 2, and Fig. 9a shows the T-dependence of the CT bandwidths. The “zeroth” Gaussian included to account for the absorption of aromatic residue band wing ensured convergence of the 27 spectral-parameter system for each of the 45 spectra. The data prompt the following observations:
a) The RT bandwidths span a wide range from 1500 to 5000 cm⫺1. The T-dependence seems to fall into three kinds of
behaviour. The widths of G5 and G8 exhibit a pronounced
increase as the temperature is raised. G8 is a component of the
641 nm FeII assigned RT band. The very broad band at 641 nm
seems to hold two Gaussian components, G7 and G8, with
rather different T-patterns. The G5 and G8 RT widths are
4493 and 3813 cm⫺1, respectively. E
r can be estimated to 8800
and 6530 cm⫺1, respectively. The corresponding coupling
frequencies are 150 and 170 cm⫺1. The low coupling frequencies
solvent or protein modes, with lower frequencies than local molecular modes.
b) The second group comprises G2 and G3 assigned to FeI
which show a moderate but systematic bandwidth increase of ≈15% in the temperature range applied. The limiting G2
width at low T approaches more than 4000 cm⫺1. This calls
for inhomogeneous broadening mechanisms and inclusion of conformational sub-states of DFx whereas the G3 1597 cm
⫺1
width accords with homogeneous broadening. The weak T-dependence indicates that higher coupling frequencies are important.
c) The T-dependence of the widths of G1 (FeII), G4 (FeI), G6
(FeI and FeII), and G7 (FeII) nm is clearly weaker. This indicates
that both inhomogeneous broadening and coupling to high-frequency local modes could be important. The almost com-plete T-independence is, however, puzzling, as protein and Fig. 9 (a) Temperature dependence of the bandwidths in the Gaussian analysis (Fig. 6a) for the sodium cacodylate buffer case. Top scale: temperature T/K. Left scale: Gaussian bandwidth at half maximum (FWHM) ∆½/cm
⫺1. Bottom scale: square root of temperature √T/√K.
The vertical line indicates the glass transition temperature Tg= 163 K
of the glycerol/buffer mixture. Each band is denoted with a Gi
corresponding to the Gaussians in Fig. 6a and Table 2. (b) Temperature dependence of the bandwidths in the Gaussian analysis (Fig. 6b) for the calcium cacodylate buffer case. Top scale: temperature T/K. Left scale: Gaussian bandwidth at half maximum (FWHM) ∆½/cm
⫺1. Bottom
scale: square root of temperature √T/√K. The vertical line indicates the glass transition temperature Tg= 163 K of the glycerol/buffer mixture.
Each band curve is denoted with a Gi corresponding to the Gaussians
Fig. 6b and Table 3.
other soft modes would be expected to contribute significantly
in addition to local modes around the metal centres, cf. below. The weakly “inverse” T-dependence of the G6 and G7
band-widths is straightforwardly in keeping with the formalism but the effect is too small for specific conclusions. The critical
vibrational frequency, which would control the transition between nuclear mode displacement by thermal activation and by nuclear tunnelling, would be in the range 280 to 430 cm⫺1
which is the range of the iron–Cys stretching frequencies.11
From local mode reorganisation energies for thermal ET from DFT calculations33
these modes only contribute ≈ 0.15 eV or 1200 to 1300 cm⫺1 but this could be larger for the optical
transition where cysteinyl radical formation is involved. Con-tributions from the higher-frequency 700 cm⫺1 Cys-S–C
β stretching mode can also be envisaged as this mode shows a strong resonance Raman signal on excitation in the CT region.11
The apparent electronic–vibrational couplings, i.e. the optical nuclear reorganization free energies, are about 1.09 eV (8800 cm⫺1) for G
5 (FeI) and 1.33 eV (10700 cm
⫺1) for G
2 (FeI and
FeII). It is ≈ 0.73 eV for the G1 (FeII) and 0.81 eV for G8 (FeII).
They are smaller, 0.14 to 0.49 eV for G3 (FeI), G4 (FeI), G6
(FeI and FeII), and G7 (FeII). Most of these values are close
to values for homogeneous broadening of single transitions accompanied by local mode and protein reorganization. The widths of G5 (FeI) and G2 (FeI and FeII), which approach
or exceed 1 eV are, however, unphysical for homogeneously broadened transitions and must reflect temperature dependent
conformational equilibria, distributions of conformational states, or more than a single transition. The notion of con-formational equilibria for DFx was introduced early based on Mössbauer and other spectroscopy.11
The following other observations are appropriate:
d) The transitions between low- and high-temperature behaviour in Fig. 9a appear around the glass transition tem-perature of the glycerol–water solvent, Tg ≈ 163 K. The CT
transitions of grey DFx therefore suggest that protein/solvent melting around the glass transition is reflected strongly in the
transitions particularly corresponding to the G5 (FeI) and G8
(FeII) Gaussians.
e) The CT widths of the G5 (FeI) and G8 (FeII) Gaussians
follow roughly a ∆env/√T-dependence above the transition
temperature. This accords with conformational relaxation, but formally also with homogeneous broadening in local low-frequency modes. As noted, the bandwidths are, however, far too large for the latter mechanism.
In conclusion all the CT bands of grey DFx in NaCcd buffer
display strong electronic–vibrational coupling. The widths and the temperature dependence for the G3 (FeI), G6 (FeI and FeII),
and G7 (FeII) Gaussians are small enough to accord with
homogeneous broadening and significant homogeneous
collect-ive protein and solvent mode coupling (the 408 nm CD (FeI)
band, the 565 nm (FeI) band and the 610 nm (FeII) CD feature).
The widths of the other Gaussians are so large that broad conformational distributions and/or monomer–dimer equi-libria must be involved. Both these features depend on the temperature and are coupled to the solvent structural changes such as noted by the bandwidth features at the glass transition temperature.
The CT bands of pink DFx display similar temperature dependent broadening features but these bands are not well resolved compared to those of grey DFx even at the lowest temperature (78 K). We do not, therefore, provide a bandshape analysis for pink DFx.
Analysis of DFx charge transfer spectra in calcium cacodylate buffer. Ca2⫹
-ions are indispensable for crystallisation of DFx.9
With a view to illuminating the role of Ca2⫹
band-shape analysis as above was undertaken for grey DFx in CaCcd buffer.
The spectra and the Gaussian bandwidths (Figs. 6b, 9b and Table 3) exhibit basically the same features and transitions as for grey DFx in NaCcd buffer, Figs. 3 and 9a. Eight Gaussians
together with one Gaussian for the protein-band, fit the spectra
in the whole CT region for all 45 applied temperatures. Positions of the maxima and intensities and widths of the Gaussian bands are similarly summarised in Table 3. The following differences of the grey DFx spectrum in CaCcd buffer,
where the protein is to a certain extent in the dimer form, compared with NaCcd buffer can be distinguished:
a) G1 at 318 nm (FeI and FeII) and G8 at 677 nm (FeII) in
NaCcd buffer are blue-shifted to 313 and 635 nm, respectively,
while G2 at 366 nm (FeI) is red-shifted to 370 nm (FeI) in CaCcd
buffer. The 677 nm (FeII) band is not resolved such as for
NaCcd buffer but the large width is strongly indicative that
more than one transition is involved.
b) The temperature dependence of the bandwidths accord largely with the observations for NaCcd buffer. The G1(FeI and
FeII), G4 (FeI), and G8 (FeII) Gaussians are, however, all notably broader than in NaCcd buffer.
c) The effects of Ca2⫹
-ions on grey DFx in aqueous buffer
solution seem to induce some conformational freezing but broad inhomogeneous distributions of “frozen” conformations remain. This may be related to a shift in the monomer–dimer equilibrium as reflected in the strong relaxational features of
two of the Gaussians at the glass transition temperature, i.e. G5 (FeI) and G7 (FeI and FeII).
Conclusion
We have provided a comprehensive spectroscopic investigation of the two-centre modular non-heme redox protein DFx from Desulfovibrio desulfuricans. The investigation rests on variable-temperature UV/VIS absorption spectroscopy and bandshape analysis, MCD, and CD spectroscopy, and EPR spectroscopy of DFx in all the three oxidation states (EPR only for grey DFx). The spectroscopic characterisation has enabled disclosure par-ticularly of the electronic–vibrational coupling features, and conformational relaxation patterns, which accompany all the CT transitions in the visible, near-UV, and NIR spectral regions of grey and pink DFx. Other issues addressed are the electronic coupling between FeI and FeII, and the deconvolution of local
molecular and homogeneous protein/solvent nuclear motion from conformational inhomogeneous broadening caused by the protein and solvent, and conformational and monomer–dimer equilibria between different molecular species.
Absorption spectral recordings at variable temperatures have disclosed several grey and pink DFx CT bands in the visible spectral region, which are congested by thermal broadening at higher temperatures. This has enabled a detailed bandshape resolution in the whole temperature range from 78 to 298 K. The minimal band assignment pattern discloses eight CT bands involving the metal centres. To this comes the strong 280 nm (π* π) band that is vibrationally resolved at the lowest temperatures. The following observations refer to the CT bands. The best resolution was obtained for grey DFx, and most of the discussion refers to this form.
All the CT bands can be assigned to (Fe3⫹
S⫺
) transitions in oxidised FeI and FeII. The central electronic process thus
involves photo-induced formation of a Cys-Sⴢ–Fe() unit in the
excited electronic state(s). This implies that the accompanying nuclear reorganisation Gibbs free energy can be significantly
larger than for thermal electron transfer processes of FeI and
FeII. The Fe–S bonds are thus left intact in the latter case apart
from minor bond adjustments. The optically induced reorgan-isation Gibbs free energies are expected to exceed significantly
the values of 0.15 to 0.2 eV estimated for thermal electron transfer on the basis of quantum chemical computations.33
The following conclusions referring to NaCcd buffer then
emerge:
(i) Three of the Gaussians, i.e. G3 (FeI), G6 (FeI) and G7 (FeII)
accord with homogeneous electronic–vibrational couplings dominated by local nuclear modes (Er≈ 0.2 eV). The G6 and G7
widths are largely independent of the temperature, while the G3
width increases moderately with increasing temperature. This suggests that there is strong electronic coupling to a high-frequency mode such as the 700 cm⫺1 Cys-S–C
β stretching mode for the bands related to G6 and G7 and stronger coupling to
lower-frequency modes such as metal–ligand stretching modes for the bands related to G3 (FeI).
(ii) Three other Gaussians, i.e. G1 (FeII), G4 (FeI) and G8
(FeII) exhibit RT widths of 0.3–0.4 µm
⫺1 or apparent nuclear
reorganisation Gibbs free energies of about 1 eV. The tem-perature dependence of all the bands is weak compared to expectations from the theoretical bandshape formalism used. If about 0.5 eV of nuclear reorganisation can be assigned as a maximum for homogeneous local and protein/solvent mode broadening corresponding to 0.2–0.25 Å Fe–S-Cys band stretch on optical CT excitation, then up to 0.2 eV is left for other broadening mechanisms. The notable increase of the G8 (FeII)
width around the solvent glass transition temperature and the approximate √T-dependence above this temperature suggest that T-dependent conformational equilibria and conform-ational interactions between the monomers in temperature-dependent monomer–dimer equilibria is involved. Strong coupling to solvent-controlled conformational modes and relaxation of these modes as the glycerol/water solvent relaxes above the glass transition temperature is thus implied. This transition, therefore, appears to emerge as a sensitive probe for long-range and bulk conformational dynamic effects, in the
glycerol/water/protein environment.
(iii) Two transitions are related to G2 and G5 (both FeI) that
are particularly broad. These Gaussians are resolved com-ponents of even broader low-temperature bands. G2 and G5
may, however, be further composite as the MCD spectra seem to hold both C- and A-terms in this spectral region.
(iv) The overarching spectral effects of dimer
structure-promoting Ca2⫹
ions on the local electronic features of the metal centres are small. Apart from minor blue- and red-shifts of the individual charge transfer bands the most conspicuous difference is in the temperature dependence of the G1 (FeII)
(blue-shifted by 5 nm compared to the NaCcd buffer)
band-width, which increases strongly with increasing temperature above the solvent glass transition temperature. Both centres appear sensitive to protein conformational relaxation features, which are in turn strongly coupled to the external solvent dynamics.
(v) The importance of conformational relaxation is, finally,
notably illuminated by the changes in VT-MCD patterns of the (Fe3⫹
S⫺
)-based transitions in grey and pink DFx. This is particularly apparent in the weaker and less well resolved bands in pink DFx in the 400–500 nm range associated with FeI.
Acknowledgements
Financial support from the Danish Natural Science and Tech-nical Science Research Councils is acknowledged. We wish to give our special thanks to Frode Galsbøl who provided both 2{Λ-(⫹)-[Co(en)3]Cl3}ⴢNaClⴢ6H2O and K2[IrCl6] for our use.
References and notes
1 R. A. Marcus and N. Sutin, Biochim. Biophys. Acta, 1985, 811, 265–322.
2 J. Ulstrup and A. M. Kuznetsov, Electron Transfer in Chemistry and Biology, Wiley, Chichester 1999.
4 I. B. Coutinho and A. V. Xavier, Methods Enzymol., 1994, 243, 119–140.
5 L. S. Conrad, J.-J. Karlsson and J. Ulstrup, Eur. J. Biochem., 1995, 231, 133–141.
6 I. Moura, P. Tavares, J. J. G. Moura, N. Ravi, B. H. Huynh, M.-Y. Liu and J. LeGall, J. Biol. Chem., 1990, 265, 21596–21602. 7 M. F. J. M. Verhagen, W. G. B. Voorhorst, J. A. Kolkman, R. B. G.
Wolbert and W. R. Hagen, FEBS Lett., 1993, 336, 13–18.
8 D. Apiyo, K. Jones, J. Guidry and P. Wittung-Stafshede,
Biochemistry, 2001, 40, 4940–4948.
9 A. V. Coelho, P. M. Matias, M. A. Carrondo, P. Tavares, J. J. G. Moura, I. Moura, V. Fülöp, J. Hadju and J. LeGall, Protein Science, 1996, 5, 1189–1191.
10 B. Devreese, P. Tavares, J. Lampreia, N. Van Damme, J. LeGall, J. J. G. Moura, J. Van Breumen and I. Moura, FEBS Lett., 1996, 385, 138–142.
11 P. Tavares, N. Ravi, J. J. G. Moura, J. LeGall, Y.-H. Huang, B. R. Crouse, M. K. Johnson, B. H. Huynh and I. Moura, J. Biol. Chem., 1994, 269, 10504–10510.
12 A. Coelho, P. Matias, V. Fülöp, A. Thompson, A. Gonzales and M. A. Carrondo, J. Biol. Inorg. Chem., 1997, 2, 680–689.
13 M. Archer, R. Huber, P. Tavares, I. Moura, J. J. G. Moura, M. A. Carrondo, L. C. Sieker, J. LeGall and M. J. Romão, J. Mol. Biol., 1995, 251, 690–702.
14 C. V. Romão, M. Y. Liu, J. LeGall, C. M. Gomes, V. Braga, I. Pacheco, A. Xavier and M. Teixeira, Eur. J. Biochem., 1999, 261, 438–443.
15 M. Lombard, M. Fontecave, D. Touati and V. Nivière, J. Biol. Chem., 2000, 275, 115–121.
16 E. D. Coulter, J. P. Emerson, D. M. Kurtz, Jr. and D. E. Cabelli,
J. Am. Chem. Soc., 2000, 122, 11555–11556.
17 C. Ascenso, F. Rusnak, I. Cabrito, M. J. Lima, S. Naylor, I. Moura and J. J. G. Moura, J. Biol. Inorg. Chem., 2000, 5, 720–729. 18 A. P. Yeh, Y. Hu, F. E. Jenney, M. W. W. Adams and D. C. Rees,
Biochemistry, 2000, 39, 2499–2508.
19 M. D. Clay, F. E. Jenney, Jr., P. L. Hagedoorn, G. N. George, M. W. W. Adams and M. K. Johnson, J. Am. Chem. Soc., 2002, 124, 788–805.
20 M. A. Carrondo, personal communication.
21 E. M. Itskovich, J. Ulstrup and M. A. Vorotyntsev, in The Chemical Physics of Solvation. Part B. Spectroscopy of Solvation., ed. R. R. Dogonadze, E. Kálmán, A. Kornyshev and J. Ulstrup, Elsevier, Amsterdam, 1986, ch. 6, pp. 223–310.
22 http://www.jasco-europe.com/trep.htm, Standards for CD, report 043. 2{Λ-(⫹)-[Co(en)3]Cl3}ⴢNaClⴢ6H2O was provided by,
F. Galsbøl, Department of Chemistry, University of Copenhagen, synthesis unpublished.
23 I. Moura, A. V. Xavier, R. Cammack, M. Bruschi and J. LeGall,
Biochim. Biophys. Acta, 1978, 533, 156–162.
24 V. S. Oganesyan, S. J. George, M. R. Cheesman and A. J. Thomson,
J. Chem. Phys., 1999, 110, 762–777.
25 W. Lovenberg and B. E. Sobel, Proc. Natl. Acad. Sci. USA, 1965, 54, 193–199.
26 I. A. Abreu, L. M. Saraiva, C. M. Soares, M. Teixeira and D. E. Cabelli, J. Biol. Chem., 2001, 276, 38995–39001.
27 T. Jovanovic´, C. Ascenso, K. R. O. Hazlett, R. Sikkink, C. Krebs, R. Litwiller, L. M. Benson, I. Moura, J. J. G. Moura, J. D. Radolf, B. H. Huynh, S. Naylor and F. Rusnak, J. Biol. Chem., 2000, 275, 28439–28448.
28 A. P. Yeh, Y. Hu, F. E. Jenney, Jr., M. W. W. Adams and D. C. Rees,
Biochemistry, 2000, 39, 2499–2508.
29 A. J. Thomson, M. R. Cheesman and S. J. George, Methods Enzymol., 1993, 226, 199–232.
30 J. S. Griffith, Mol. Phys., 1964, 8, 213–216.
31 J. Glerup and H. Weihe, Acta Chem. Scand., 1991, 45, 444–448.
32 A. M. Kjaer and J. Ulstrup, J. Am. Chem. Soc., 1987, 109, 1934–1942.