Mariana Miguel Sabino Oliveira
Bachelor in Biochemistry
Cross
-
presentation by WASp deficient
B cells and dendritic cells
Thesis for the Master degree in Biochemistry
Supervisor: Lisa Westerberg, Senior Researcher, Karolinska Institutet
Co-supervisor: Marisa Baptista, Doctoral Student, Karolinska Institutet
Jury:
President: Prof. Doctor José Ricardo Ramos Franco Tavares
Examiner: Prof. Doctor Paula Alexandra Quintela Videira
Cross-presentation by WASp deficient B cells and dendritic cells Mariana Oliveira
i
Mariana Miguel Sabino Oliveira
Bachelor in Biochemistry
Cross
-
presentation by WASp deficient B cells and
dendritic cells
Thesis for the Master degree in Biochemistry
Supervisor: Lisa Westerberg, Senior Researcher, Karolinska Institutet
Co-supervisor: Marisa Baptista, Doctoral Student, Karolinska Institutet
Jury:
President: Prof. Doctor Prof. Doctor José Ricardo Ramos Franco Tavares Examiner: Prof. Doctor Paula Alexandra Quintela Videira
ii
Cross-presentation by WASp deficient B cells and
dendritic cells
Copyright © Mariana Miguel Sabino Oliveira, Faculdade de Ciências e
Tecnologia, Universidade Nova de Lisboa.
iii
v Acknowledgements
I would to say thank you to my supervisor Lisa Westerberg for, first of all, have accepted me as master student in her lab. You were always a good boss and an awesome teacher. Almost
everything I know about immunology, I learned in “our” group.
To my co-supervisor, Marisa Baptista, for introducing me Sweden and the group. Thank you for teach me so many things about dendritic cells. I have to say thank you for being my friend all these months besides the work. Keep like that and do not miss your laughter.
All WASp group: Paul for sharing your German jokes. Jaime for being the “English
dictionary”. Magda-Liz for your Latin spirit and for spread your happiness. Nikolai for general
culture about Portugal and Russia and for being always available to help. Carin for your kindness. Joanna, thank you for teach me a lot of things about B cells. Your parties are always really nice too. Marton for being the most enthusiastic person that I ever met. Anton for your medicine knowledge and for being an expert to take blood.
All LeGroupe: Mikael Karlsson, Amanda, Anna-Maria, Kiran, Kajsa, Kiran, Eva, Emma, Thomas, Silke and Vanessa for sharing your knowledge mainly in the joint meetings but also for always be available to help whenever I need. Your friendly spirit make your group a really
nice “neighbour”.
Aos meus pais Maria Rosa e Valdemar que sempre me apoiaram em todas as minha decisões encorajando-me mesmo nas alturas menos boas. Ao meu irmão João por ser quem é. És o melhor irmão do mundo e sei que posso contar contigo sempre que precisar.
A toda a minha família: tios Dulce e Joaquim Artur, Manuel e Maria Dolores. Obrigada por tudo o que fizeram por mim. O meu percurso também ficou marcado pelas vossas boas ações; primos Catarina e Miguel, Diogo, Flávia e Tiago por serem como irmãos para mim. Sei que quando preciso é só dizer e estarão disponíveis para me ouvir e ajudar; ao meu avô Casimiro pelos seus conselhos; aos meus padrinhos Célia e Justino por todo o apoio e carinho que sempre me deram; Luísa por seres tão especial e tão carinhosa comigo. Obrigada por tudo. Ana, Luís pela vossa amizade e por sempre me convidarem para ter férias com vocês. Aos
“pequeninos” Pedro e Rafael, Manuel e Henrique e Gonçalo por trazerem alegria à família.
vii Abstract
The immune system comprises of different cell types whose role is to protect us against pathogens. This thesis investigates a very important mechanism for our organism protection in a specific disorder: cross-presentation in Wiskott-Aldrich Syndrome (WAS). WAS is caused by loss-of-function mutations in the cytoskeletal regulator WASp and WAS patients suffer from eczema, thrombocytopenia, and immunodeficiency. X-linked neutropenia (XLN) is caused by gain-of-function mutations in WASp and XLN patients suffer from severe congenital neutropenia and immunodeficiency. This thesis was focused on the role of B and T lymphocytes
and dendritic cells (DCs). This work will be divided into two main topics:
1) In the first part I studied the capacity of B cells to take up, degrade and present antigen. Moreover I studied the capacity of B cells to induce T cell proliferation.
2) In the second part, I studied T cell proliferation induced by dendritic cells. To increase our understanding about this mechanism, additional experiments were performed, including acidification capacity of CD8+ and CD8- DCs, reactive oxygen species (ROS)
production since it is directly connected to acidification. These assays were measured by flow cytometry. Localization of Rac1 and Rac2 GTPases was assessed by confocal microscopy. Proliferation, acidification and ROS production assays were performed also with cells from X-linked neutropenia (XLN) mice.
From this study we concluded that B cells cannot induce CD8+ T cell proliferation
however they take up and present antigen. Moreover I have shown that increased cross-presentation by WASp KO DCs with ovalbumin is associated with decreased capacity to acidify endosomal compartment; and WASp KO CD8- DCs have increased Rac2 localization to the
phagosome. XLN dendritic cells have similar acidification and ROS production capacity than wildtype cells. In conclusion, our data suggests that WASp regulates antigen processing and presentation in DCs.
ix Resumo
O Sistema imunitário compreende diferentes tipos de células cuja função é proteger-nos contra agentes patogénicos. Esta tese averigua um mecanismo bastante importante na proteção do nosso organismo relacionado com uma desordem específica: apresentação cruzada no Síndrome de Wiskott-Aldrich. Síndrome de Wiskott-Aldrich é causada por mutações na qual se perde a função do regulador do citoesqueleto WASp e pacientes com WAS sofrem de eczema, trombocitopenia e imunodeficiência. Neutropenia relacionada com o cromossoma X é causada por mutações na qual se ganha a função de WASp e estes pacientes sofrem de neutropenia congénita severa e imunodeficiência. Esta tese foca a função de linfócitos B e T e de células dendríticas no mesmo. Este trabalho será dividido em dois tópicos principais:
1) Numa primeira parte foi estudada a capacidade de células B captar, degradar e presentar antigénio. Além disso, foi estudada a capacidade de células B para induzir proliferação de células T.
2) Na segunda parte, foi estudada a proliferação de células T induzida por células dendríticas. De forma a melhor compreendermos este mecanismo, foram feitos experiências adicionais, incluindo a capacidade de acidificação de células dendríticas CD8+ e CD8- e
respetiva produção de espécies reativas de oxigénio, uma vez que esta está diretamente ligada a acidificação. Estas experiências foram monitorizados por citometria de fluxo. A localização das GTPases Rac1 e Rac2 foi avaliada através de microscopia confocal. A proliferação, acidificação e produção de ROS foram verificados também em células provenientes de ratos com Neutropenia ligada ao cromossoma X (XLN).
A partir deste estudo concluímos que as células B não conseguem induzir a proliferação de células T CD8+, no entanto têm a capacidade de internalizar e apresentar o antigénio. Para
além disso, foi mostrado também que o aumento de apresentação cruzada por WASp KO DCs com ovalbumina está associada com uma diminuição da capacidade de acidificar o compartimento endossomal; e que WASp KO CD8- DCs possuem um aumento da localização
de Rac2 no fagossoma. Células dendríticas XLN têm similar capacidade de acidificação e produção de ROS que células normais. Em conclusão, os dados mostram que WASp regula a apresentação e o processamento de antigénio em DCs.
xi Contents
Chapter 1. Introduction ... 1
1.1 The immune system ... 2
1.2. Cross-presentation ... 3
1.3. Wiskott-Aldrich syndrome ... 5
1.4. WASp-associated disorders ... 6
1.5. Aims of this study ... 7
Chapter 2. Materials and Methods ... 13
2.1. Mice... 14
2.2. T-B cell co-culture assay. ... 14
2.3. Dendritic cell culture. ... 14
2.4. Carboxyfluorescein succinimidyl ester (CFSE) OT-I/OT-II cell proliferation assay. ... 14
2.5. Dihydrorhodamine 123 (DHR) and pH rodo assay. ... 14
2.6. Rac1 and Rac2 detection. ... 15
2.7. Data and statistical analysis. ... 15
Chapter 3. Results and Discussion ... 17
3.1. B cell cross-presentation ... 18
3.2. Ovalbumin uptake by B cells ... 22
3.3. T cell proliferation induced by dendritic cells ... 23
3.3.1. OT-I proliferation with WASp KO dendritic cells ... 23
3.3.2. Acidification in CD8+ and CD8- WT and WASp KO dendritic cells ... 28
3.3.3. OT-I proliferation with XLN dendritic cells ... 34
3.3.4. Acidification capacity by CD8+ and CD8- WT and XLN dendritic cells ... 36
3.3.5. ROS production in XLN mice ... 39
Chapter 4. Conclusions ... 41
xiii Figures
Figure 1 Schematic figure of cross-presentation pathways in dendritic
cells..………...4
Figure 2 Domain structure of Wiskott-Aldrich syndrome protein (WASp). This is composed by PH, WH1, BR, GBD, Pro and VCA domain. ... 6
Figure 3 Domain structure of Wiskott-Aldrich syndrome protein (WASp). When is inactive, the complex Arp2/3 is not bound to the VCA domain and do not recruit monomeric actin. When Cdc42-GTP bound GBD domain, Arp2/3 links to VCA domain and recruit monomeric actin to assemble actin filaments... 6
Figure 4 Structural changes in Wiskott-Aldrich syndrome protein. In a normal patient both forms of WASp (active or inactive) are present, in Wiskott-Aldrich syndrome patients lack WASp and in X-linked neutropenia patients, a mutation in GBD domain case constitutive active WASp. ... 7
Figure 5 Schematic model of B cell and the components involved in B cell cross-presentation assay. Ovalbumin is recognized by B cell receptor (BCR) and then internalized and the OVA derived peptides are loaded in MHC class I or MHC class II. The peptides can be SIINFEKL or 323-339, respectively. ... 8
Figure 6 CFSE dilution in T cells. T cell are labelled with carboxyfluorescein succinimidyl ester and according to proliferation this dye is diluted to half in first cell generation and each of these cells can divide again being the CFSE diluted again. ... 9
Figure 7 NADPH oxidase complex in the phagosome membrane. ... 10
Figure 8 pH rodo assay. Dendritic cells are incubated with OVA pH-rodo. pH rodo shows
increasing signal as the pH decreases………...………10
Figure 9 DHR assay. Dendritic cells are incubated with DHR coated beads. DHR shows green
fluorescence and this is proportional to ROS production………...11
Figure 10 CD8+ T cell proliferation induced by B cells. T cells are CFSE labelled and is shown four proliferative peaks. B cells were cultured with ovalbumin ... 18
Figure 11 CD8+ T cell proliferation induced by B cells. T cells were CFSE labeled with CFSE wich resulted in four proliferative peaks as shown in histogram. B cells were cultured with SIINFEKL. ... 19
Figure 12 CD8+ T cell proliferation induced by B cells. T cells where SIINFEKL was not added to the culture are represented in red, whereas in blue are the T cells that proliferated in the presence of SIINFEKL. ... 19
Figure 13 T cell proliferation. In this data is shown CD8+ T cells co-cultured with B cells and CD4+ T cells (in black is shown the sample irradiated with 1000 rad after 4 days of B cell
xiv Figure 14 T cell proliferation. In this data is shown CD8+ T cells co-cultured with B cells and CD4+ T cells (black); CD8+ T cells with the supernatant in which B cells were cultured (red);
CD8+ T cells with anti-CD40 (blue). SIINFEKL was added to all samples. ... 21
Figure 15 B cell model to monitor ovalbumin uptake, degradation and presentation. To the B cells was added anti-IgM F(ab)2-biotin to which we linked anti-Biotin-OVA-FITC. ... 22
Figure 16 Ovalbumin degradation and SIINFEKL presentation. This data shows ovalbumin degradation in black and consequent SIINFEKL presentation in red. The samples were measured at time points 0, 30 min, 2, 4 and 6 hours. A control sample was measured in which B cells were stimulated for 6 hours with anti-CD40. ... 23
Figure 17 Proliferation of CD8+ T cells induced by CD8+ dendritic cells. This is a
representative histogram for all ovalbumin concentrations used in this assay and it was obtained by flow cytometry. In black is shown the proliferative peaks induced by wildtype (WT) DCs and in red the proliferative peaks induced with WASp KO (WKO) DCs. ... 24
Figure 18 CD8+ T cell proliferation. CD8+ T cell number are shown in presence of 16, 50 and 150 µg/ml of ovalbumin. Cells induced by wildtype (WT) DCs are represented in black and by WASp KO (WKO) DCs are represented in red. ... 25
Figure 19 Proliferation of CD8+ T cells induced by CD8- DCs. This is a representative histogram for all ovalbumin concentrations used in this assay and it was obtained by flow cytometry. In black is shown the proliferative peaks induced by wildtype (WT) DCs and in red the proliferative peaks induced by WASp KO (WKO) DCs. ... 25
Figure 20 Proliferation of CD8+ T cells induced by CD8- DCs. CD8+ T cell number is shown in presence of 16, 50 and 150 µg/ml of ovalbumin. Cells induced by wildtype (WT) DCs are represented in black and by WASp KO (WKO) DCs are represented in red. ... 26
Figure 21 Proliferation peaks of CD8+ T cells induced by CD8+ DCs (left) and CD8- DCs (right). This was performed with 50 µg/ml of ovalbumin and it was obtained by flow cytometry. In black is shown the proliferative peaks induced by wildtype (WT) DCs and in red the proliferative peaks induced with WASp KO (WKO) DCs. ... 27
Figure 22 CD8+ T cell proliferation. CD8+ T cell number is shown for both DC subsets from
wildtype (WT) and WASp KO (WKO) DCs. CD8+ T cell co-cultured with WT DCs are
representing in grey; co-cultured with CD8+ WKO DCs are representing in pink; co-cultured
with CD8- WT DCs are representing in black; and co-cultured with CD8- WKO DCs are
representing in red. ... 27
Figure 23 Cross-presentation and acidification by DCs. CD8- dendritic cells tend to acidify more and present peptides in MHC class II inducing CD4+ T cell proliferation; while CD8+
dendritic cells tend to acidify less and present peptides in MHC class I inducing CD8+ T cell
proliferation. ... 28
xv Figure 25 pH rodo high of CD8+ dendritic cells. This is a representative histogram for all time points in this assay and it was obtained by flow cytometry. In black is shown the pH rodo in wildtype dendritic cells (WT) and in red the pH rodo in WASp KO dendritic cells (WKO). .... 29
Figure 26 pH rodo signal of CD8- dendritic cells. This is a representative histogram for all the time points in this assay and it was obtained by flow cytometry. In black is shown the pH rodo in wildtype (WT) DCs and in red the pH rodo in WASp KO (WKO) DCs. ... 30
Figure 27 Acidification in CD8+ dendritic cells. pH rodo intensity was measured after 2 and 6 hours of incubation with ovalbumin-coated latex beads. Wildtype (WT) DCs are represented in grey and WASp KO (WKO) DCs are represented in pink. ... 31
Figure 28 Acidification in CD8- dendritic cells. pH rodo intensity was measured after 2 and 6
hours of incubation with ovalbumin-coated latex beads. Wildtype (WT) DCs are represented in black and WASp KO (WKO) DCs are represented in red. ... 31
Figure 29 Confocal microscopy images of Rac1 and Rac2 expression in wildtype (WT) and WASp KO (WKO) CD8+ and CD8- DCs. DCs were stained for Rac1-FITC (green) and
Rac2-Alexa555 (red) antibodies. The phagocytosed bead is marked with an asterisk. ... 32
Figure 30 Acidification model of wildtype (WT) and WASp KO DCs. WASp KO DCs shows increased acidification and Rac2 localization in phagosome compared with WT DCs. Altogether this leads to increase CD8+ T cell proliferation ... 34
Figure 31 CD8+ T cell proliferation. CD8+ T cell number is shown in presence of 16, 50 and 150 µg/ml of ovalbumin. Cells induced by wildtype (WT) DCs are represented in black and by X-linked neutropenia (XLN) DCs are represented in blue. ... 35
Figure 32 CD8+ T cell proliferation. CD8+ T cell number is shown in presence of 16, 50 and 150 µg/ml of ovalbumin. Cells induced by wildtype (WT) DCs are represented in black and by X-linked neutropenia (XLN) DCs are represented in blue. ... 35
Figure 33 CD8+ dendritic cells acidification. pH rodo high was measured after 2 and 6 hours of incubation with ovalbumin-coated latex beads. Wildtype (WT) dendritic cells are represented in grey, WASp KO (WKO) dendritic cells are represented in pink and X-linked neutropenia (XLN) dendritic cells are represented in light blue. ... 36
Figure 34 Acidification in CD8- dendritic cells. pH rodo intensity was measured after 2 and 6
hours of incubation with ovalbumin-coated latex beads. Wildtype (WT) DCs are represented in black, WASp KO (WKO) DCs are represented in red and X-linked neutropenia (XLN) DCs are represented in blue. ... 37
Figure 35 Acidification in CD8+ dendritic cells. pH rodo high was measured after 2 and 6 hours of incubation with ovalbumin-coated latex beads. Wildtype (WT) DCs are represented in grey and X-linked neutropenia (XLN) DCs are represented in light blue. ... 38
xvi Figure 37 Reactive oxygen species (ROS) production in CD8+ dendritic cells. ROS production was measured after 1 hour and 2 hours of incubation with ovalbumin-coated latex beads. Wildtype (WT) DCs are represented in grey, WASp KO (WKO) DCs are represented in pink and X-linked neutropenia (XLN) DCs are represented in light blue. ... 39
xvii Tables
xix List of abbreviations
APC ARP BCR BR CD40 CFSE CTL DC DHR DPI ER FBS FITC GBD Ig IL-4 LPS MHC NADPH NOX OVA PIP2 Rac1 Rac2 ROS SH3 TAP TCR TLR WAS WASp WH1 WIP WKO WT XLN Antigen-presenting cell Actin-related proteins B cell receptor Basic region
Cluster of differentiation 40
Carboxyfluorescein succinimidyl ester Cytotoxic T lymphocytes
Dendritic cell
Dihydrorhodamine 123 Diphenyleneiodonium Endoplasmic reticulum Fetal bovine serum Fluorescein isothiocyanate GTPase binding domain Immunoglobulin Interleukin 4 Lipopolysaccharide
Major histocompatibility complex
Nicotinamide adenine dinucleotide phosphate NADPH oxidase
Ovalbumin
Phosphatidylinositol 4,5-bisphosphate Ras-related C3 botulinum toxin substrate 1 Ras-related C3 botulinum toxin substrate 2 Reactive oxygen species
SRC Homology 3
Transporter associated with antigen processing T cell receptor
Toll-like receptor
Wiskott-Aldrich syndrome
Wiskott-Aldrich syndrome protein WASp homology 1
WASP-interacting protein WASp knock-out
Wildtype
1
Chapter 1
2 1.1 The immune system
The immune system is a collection of structures and processes within our body. This a very important mechanism and should work properly so it can protect us against disease or other potentially damaging foreign bodies.[1], [2]
We can distinguish two types of immune responses: the innate or natural immunity that is not specific and is essential in the first stages of an infection and since is not specific does not require previous exposure to an antibody; and acquired or adaptive immunity that is specific against a particular pathogen so is needed a previous exposure to the pathogen and is important because acts with memory.[3], [4]
B and T lymphocytes belong to the adaptive immune system and their study and understanding is very useful to know better and connect several diseases.
B lymphocytes or B cells are produced in the bone marrow from where they migrate to the spleen and other secondary lymphoid organs and became mature. Here, B cells are responsible for producing antibodies against specific antigens that are binding through B cell receptors (BCR). Antibodies are exclusively synthetized by B cells and could have different forms with different amino acid sequence and different antigen-binding site. These antibodies or immunoglobulins are the most abundant protein in the blood and each of which mediates a characteristic biological response following antigen binding.[3], [5]
T lymphocyte or T cell is another type of cell from the adaptive immune system. They have several differences from B cells and are equally important in an immune response. B cells recognize intact antigen, whereas T cells recognize fragments of protein antigens that have been partly degraded inside the antigen-presenting cell (APC). In an antigen-presenting cell, these fragments, after degraded, are carried to the cell surface and present on special molecules called major histocompatibility complex (MHC) to the T cells. Another difference between B cell and T cell is that B cells can act far away since they secrete antibodies whereas T cells interact directly with another cell, which they either kill or signal in some way.[3], [6]
There are two different types of T cells: CD4+ T cells and CD8+ T cells, as mature known
as helper T lymphocytes and cytotoxic T lymphocytes (CTLs), respectively. Both types of cells use their T-cell receptors (TCRs) to recognize peptide antigens presented by molecules encoded by the MHC complex. However, CD4+ T cells recognize peptides presented to MHC class II
and CD8+ T cells recognize peptides presented to MHC class II. This difference in antigen
presentation is related with the pathway of each antigen. Whereas MHC class I molecules present antigens synthesized within the cell presenting antigen, MHC class II molecules present peptides from exogenous antigens that enter the cell by endocytic route.[6]
3 one important step in this activation is the contact between a T cell and a DC to allow the T cell be activated, proliferate and differentiate firstly and after this be able to enter peripheral tissues to fight the invading pathogen.[6]
1.2. Cross-presentation
T cell activation can occur in two ways: if an APC is already infected, it can induce T cell proliferation without capture the antigen; if an APC is not infected, it should follow the three steps described above (capture, process and present the antigen).
We can find the term cross-presentation to describe two processes: the processing of exogenous antigens into the MHC class I pathway; or, more complex, the capture and presentation of cell associated antigen in either the MHC class I or MHC class II pathways.[6], [7]
We could call to these two different pathways to present antigens, the classical antigen presentation. To be present in MHC class I, the intracellular antigen needs first to be degraded by the cytosolic proteasome. The resulting peptides are then transported through the transporter associated with antigen processing (TAP) complex into the endoplasmic reticulum (ER). To be present in MHC class II, exogenous proteins are taken up into the dendritic cells by endocytosis and then degraded by lysosomal proteases in lysosomal compartment.[8], [9]
Apart from these classical presentation pathways, a process termed cross-presentation allows the presentation of extracellular antigens also on MHC I molecules.[1]
4
Figure 1 Schematic figure of cross-presentation pathways in dendritic cells.
5 DCs can obtain peptides from neighbouring cells via gap junctions. These peptides are thought to subsequently enter the endogenous MHC I-restricted presentation pathway in the ER.[1]
Under normal circumstances, cross-presentation is probably less efficient than direct presentation, since cross-presentation requires the additional step of transfer from one cell to another. So, to detect cross-presentation in a model system, it is important that the donor tissue expresses sufficient antigen.[6]
And it is this process that is studied in this thesis in Wiskott-Aldrich syndrome (WAS).
1.3. Wiskott-Aldrich syndrome
Wiskott-Aldrich syndrome (WAS) is a rare X-linked immunodeficiency cause by mutations in the WAS gene that encodes for a protein (WASp) involved in cytoskeleton
organization in hematopoietic cells. Absence of WAS leads to impairment in immune cell
migration, a process that requires a dynamic cytoskeleton.[5], [11]
The estimated incidence of WAS is between 1 and 10 cases per million males worldwide; this condition is absent in females, since this condition is inherited in an X-linked pattern.[12]
The clinical phenotype in WAS is characterized by congenital thrombocytopenia, combined with immunodeficiency and eczema. Several studies in patients with WAS and in WASp knock-out (WKO) mice have shown that WASp plays a critical role in the function of T and natural killer lymphocytes and dendritic cells. However, the importance of WASp in B cell development and function is less clearly defined.[11]
WASp is composed by the carboxyl terminus, consisting of the verpolin homology (V) domain, the cofilin homology (C) domain and the acidic region (A).VCA domain is mostly conserved among WASp family members. The WASp family VCA regions bind a complex formed of actin-related proteins (ARPs), the ARP-ARP3 complex, and recruits monomeric actin to stimulate and localize nucleation of branched actin filaments, as shown in Figure 2 and Figure 3.[13]
6 possible following docking by transducer of Cdc42-dependent actin assembly 1 (TOCA1). Downstream to the GBD there is a polyproline rich region where interacts a SRC Homology 3 domain (SH3) and profilin protein. This components help the Arp2/Arp3 complex to recruit monomeric actin to produce a new actin filament.[13], [14]
Figure 2 Domain structure of Wiskott-Aldrich syndrome protein (WASp). This is composed by PH,
WH1, BR, GBD, Pro and VCA domain.
Figure 3 Domain structure of Wiskott-Aldrich syndrome protein (WASp). When is inactive, the complex
Arp2/3 is not bound to the VCA domain and do not recruit monomeric actin. When Cdc42-GTP bound GBD domain, Arp2/3 links to VCA domain and recruit monomeric actin to assemble actin filaments.
1.4. WASp-associated disorders
The importance of WASp-mediated cytoskeletal regulation in hematopoietic cells is shown by two human diseases that are caused by mutations in WAS gene (which encodes
7 X-linked neutropenia (XLN) is as a clinically and biologically distinct WASp-associated disorder. This results from the presence of mutations that confer constitutive WASp activation – Figure 4. XLN is however much rarer than WAS and only four mutation were reported until now: Leu270Pro, Ser270Pro, Ile276Ser and Ile294Thr. This disorder is characterized by neutropenia that results in bacterial infection, and other clinical features, including myelodysplasia and other cytopenias.[13]
Figure 4 Structural changes in Wiskott-Aldrich syndrome protein. In a normal patient both forms of
WASp (active or inactive) are present, in Wiskott-Aldrich syndrome patients lack WASp and in X-linked neutropenia patients, a mutation in GBD domain case constitutive active WASp.
1.5. Aims of this study
In the first part of this thesis, was studied the capacity of B cells cross-present. As referred before, B cells are not specialized in cross-presentation so the pathways and machineries through this happens is not known yet. This mechanism is not well-studied but since the number of B cells in the spleen (55%) are so much bigger than the number of dendritic
L270P
S270P
I276S
8 cells in the same organ (less than 1%), our central aim was to study if B cells could cross-present antigen.[15], [16]
From the literature it is known that B-cell-mediated antibody responses are activated by signals generated from BCR and from T helper cells through antigen presentation.[5]
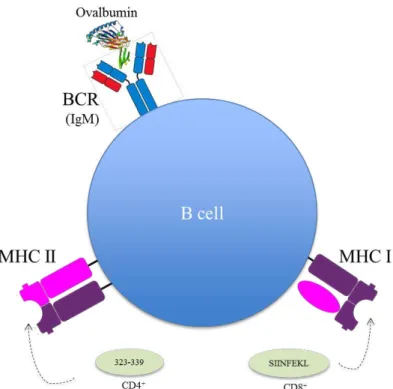
T helper cells contact directly to B cells through cluster of differentiation 40 (CD40) that is required for B cell activation, and released cytokines like interleukin 4 (IL-4). With this information, we developed a model with B cells without T helper cells. It was added to the medium, a-CD40 and IL-4 or lipopolysaccharide (LPS) to stimulate B cells. B cells, should present the antigen as shown in Figure 5.
Figure 5 Schematic model of B cell and the components involved in B cell cross-presentation assay. Ovalbumin is recognized by B cell receptor (BCR) and then internalized and the OVA derived peptides
are loaded in MHC class I or MHC class II. The peptides can be SIINFEKL or 323-339, respectively.
In this study, was added to the culture ovalbumin (the antigen), and B cell should internalize and process it to present SIINFEKL in MHC class I or the peptide OVA 323-339 in MHC class II. Both peptides, SIINFEKL and OVA 323-339 are derived peptides from ovalbumin but whereas the first one induce CD8+ T cell proliferation, the other induce CD4+ T
9 In the second part of this thesis, it was studied the same mechanism but with dendritic cells as written before as professional APC.
So, to monitor the proliferation capacity of CD4+ and CD8+ T cells by B cells and
dendritic cells, before were added to the culture, they were dyed with carboxyfluorescein succinimidyl ester (CFSE).
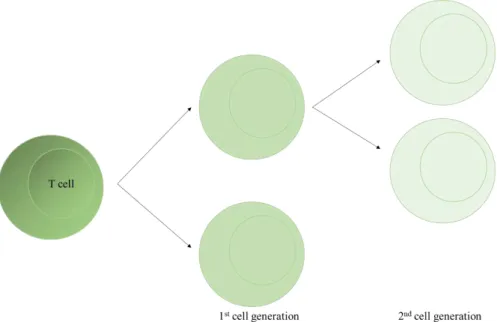
CFSE is a dye that binds covalently to all free amines on the surface and inside of cells and shows little cytotoxicity. The proliferation is monitored by dye dilution as shown in Figure 6.[17], [18]
Figure 6 CFSE dilution in T cells. T cell are labelled with carboxyfluorescein succinimidyl ester and
according to proliferation this dye is diluted to half in first cell generation and each of these cells can divide again being the CFSE diluted again.
Some studies report a connection between T cell proliferation by CD8+ and CD8- DCs
and the pH. The endosomal and phagosomal acidification should be tightly controlled once for cross-presentation is needed some antigen degradation but not excessive degradation, otherwise the antigen will be denatured and not cross presented. Acidification is mainly mediated by the vacuolar ATPase (V-ATPase), which translocates protons from the cytosol into the lumen of endosomes, lysosomes, and phagosomes.[19], [20]
Together with V-ATPase, NADPH oxidase pumps O2•- in the same direction. So, if the
10
Figure 7 NADPH oxidase complex in the phagosome membrane.
.
Therefore, it was studied the acidification capacity of each DC subset in wild type (WT) and WASp knock out (WKO) mice. In addition, we measured ROS production in DCs.
In acidification assay –Figure 8, DCs were incubated with pH-rodo linked to ovalbumin (OVA pH-rodo). pH rodo is a dye non-fluorescent at neutral pH and shows increasing signal as the pH decreases.
Figure 8 pH rodo assay. Dendritic cells are incubated with OVA pH-rodo. pH rodo shows increasing
signal as the pH decreases.
In reactive oxygen species assay – Figure 9, dihydrorhodamine 123 (DHR) was incubated with dendritic cells for different incubation times and measure ROS production by flow cytometry. Dihydrorhodamine 123 is an uncharged and nonfluorescent ROS indicator that can passively diffuse across membranes where it is oxidized to cationic rhodamine 123 and exhibits green fluorescence. This fluorescence can be measure and is proportional to ROS production.[21]
11 These methods are a good way to study these components and specifically the phagosome, since it was incubated the indicators with latex beads and DCs are able to phagocyte them coupled to pH rodo or DHR.
Figure 9 DHR assay. Dendritic cells are incubated with DHR coated beads. DHR shows green
fluorescence and this is proportional to ROS production.
13
Chapter 2
14 Mice.
Mouse were housed and maintained at the animal facility of the Department of Microbiology, Tumor and Cell Biology, Karolinska Institutet under specific pathogen-free conditions. Animal experiments were carried out after approval from the local ethical committee (North Stockholm district court). The mice used in the experiments had WASp KO and XLN I296T genotype with background C57Bl/6 or 129Sv. They were ready for experiments at 6-13 weeks of age.
T-B cell co-culture assay.
Splenic B cells were activated with anti-CD40 and IL-4 for 2 days. Cells were harvested, and
incubated with affinity purified biotinylated F(ab’)2 goat anti-mouse IgM (25 ng/ml; Jackson
ImmunoResearch). B cells were then incubated with ovalbumin antigen delivery reagent (Miltenyi Biotec) diluted at 1:10. B cells and CD4+ OT-II T cells and CD8+ OT-I T cells (2:1
ratio) were co-cultured for 3 days and measure by flow cytometry. The T cells were labelled with CFSE (Invitrogen) 2 µM.
Dendritic cell culture.
Dendritic cells were isolated from the spleen of mice mentioned before. CD8+ and CD8- DCs
were isolated follow the Fisher protocol for CD8α+ DC isolation kit followed by CD11c positive
selection (Milteny Biotec). The purity of each population was determined by flow cytometry. To get more DCs some mice were injected subcutaneously with 1x10⁶ Flt3-ligand B16
melanoma cells and DCs were purified after 7-10 days. All experiments have been repeated in naïve and Flt3-ligand injected mice. When experiments with naïve mice are performed, the spleens were injected with collagenase 1 mg/ml and incubate for 40 minutes at 37ºC.
Carboxyfluorescein succinimidyl ester (CFSE) OT-I/OT-II cell proliferation assay.
After DCs isolation, CD8+ and CD8- were cultured with ovalbumin 50 µg/ml or SIINFEKL
peptide 2 µg/ml in RPMI 1640 medium (Sigma-Aldrich) with 10% fetal bovine serum (FBS), 1% sodium pyruvate, 1% penicillin streptomycin and 1x betamercaptoethanol for 24 hours at 37ºC. After this time, were added CD8+ T cells from OT-I mice or CD4+ T cells from OT-II
mice at 1:10 DC:T cell ratio. The T cells were labelled with CFSE (Invitrogen) 2 µM and the proliferation was measured by flow cytometry after 72 hours.
Dihydrorhodamine 123 (DHR) and pH rodo assay.
15 with 20 mg/ml ovalbumin for a final concentration of 6,67 mg/ml and incubate at room temperature for 1 hour. After this time, this mixture is incubated with 3 µm latex beads at 4ºC overnight for complete coating.
Rac1 and Rac2 detection.
Enriched DCs were incubated with ovalbumin-coated latex beads for 2 hours to allow phagocytosis, transferred to fibronectin-coated glass and stained for Rac1-FITC and Rac2-Alexa555 (BIOSS) and analysed using a Zeiss LSM 780 confocal microscope.
Data and statistical analysis.
For comparison between wildtype and WASp KO or XLN, data passed the normality test and
was analyzed by unpaired student’s t-test using GraphPad Prism 5.0 software and a two-tailed p
17
Chapter 3
18 3.1. B cell cross-presentation
Cross-presentation is a very important mechanism to fight against bacteria and virus in our organism. B lymphocytes are a key component of the immune system and responsible for generating antibody responses against foreign invaders. B-cell-mediated antibody responses are activated by signals generated form BCR and from T helper cells through antigen presentation.[5]
With this information, we thought that if B cells are activated by T helper cells, maybe in the same conditions, B cells could activate T cytotoxic cells.
We performed an assay in which B cells were incubated with T cells (both helper and cytotoxic T cells) in presence of ovalbumin or SIINFEKL (ovalbumin-derived peptide) and the results described above.
First, B cells were incubated with CFSE labelled CD8+ T cells and proliferation was
measured after 4 days after adding T cells. The data is shown above in Figure 10.
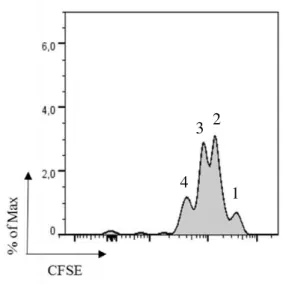
Figure 10 CD8+ T cell proliferation induced by B cells. T cells are CFSE labelled and is shown four
proliferative peaks. B cells were cultured with ovalbumin.
By CFSE dilution it is possible monitor cells proliferation. In Figure 10, we can see four peaks that means the OT-I (CD8+ T cells) cells divided three times since the first peak with
higher CFSE correspond to the cells that did not proliferate. With this result we could see an evidence of B cell cross-presentation.
Another way to check proliferation without cross-presentation is given to the cells SIINFEKL. This peptide binds directly to the MHC class I without being internalized by the B cell.
1 2 3
19
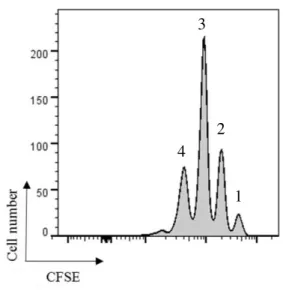
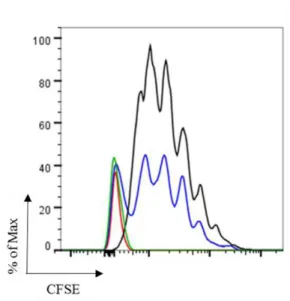
Figure 11 CD8+ T cell proliferation induced by B cells. T cells were labelled with CFSE which resulted
in four proliferative peaks as shown in histogram. B cells were cultured with SIINFEKL.
According to this data showed in Figure 11, T cells proliferate the same amount of times in both cases but we can see a big difference in the number of cells that proliferate. If is given to the B cells the full ovalbumin antigen instead of the ovalbumin-derived peptide, the amount of cells that proliferate are approximately 50 times less, indicating that B cells are week to internalize ovalbumin antigen and cross-present it. For both experiments, B cells were stimulated with a-CD40 and IL-4 or LPS and the results were similar.
To make sure that what was measured in this experiment was SIINFEKL, the cells were stained with the antibody H-2kb-SIINFEKL. This antibody recognize the connection between SIINFEKL and MHC class I receptor so everything that is not binding even if it is free SIINFEKL is not recognized (free SIINFEKL does not induce proliferation).
Figure 12 CD8+ T cell proliferation induced by B cells. T cells where SIINFEKL was not added to the
culture are represented in red, whereas in blue are the T cells that proliferated in the presence of SIINFEKL.
1 2 3
20 In this data – Figure 12, we can see one peak in red corresponding the same sample but without the derived peptide and that is the negative control. In blue is possible to see the cells with higher concentration of H-2Kb-SIINFEKL which means that some B cells having in their surface SIINFEKL that bound the MHC class I. This result is according to previous graph as the amount of detected SIINFEKL is proportional to the amount of proliferative OT-I cells.
After this experiment we thought that even if B lymphocytes cross-present poorly, since they are abundant in our organism, it would be important study this mechanism in this type of cells. So this experiment was repeated two more times in which we could not detect any proliferation. But it is possible that to induce CD8+ T cytotoxic cells, the presence of CD4+ T
helper cells is needed. So we performed an assay in which we co-cultured OT-I and OT-II cells with B cells. We did some samples irradiated with 1000 rad after 4 days and duplicates non-irradiated. The cells were irradiated to arrest cell proliferation, so T cells adding then have enough space to proliferate more.[22]
Figure 13 T cell proliferation. In this data is shown CD8+ T cells co-cultured with B cells and CD4+ T
cells (in black is shown the sample irradiated with 1000 rad after 4 days of B cell incubation; in blue the non-irradiated sample). In red and green represents B cells co-cultured with CD4+ T cells, non-irradiated
and irradiated, respectively.
In this assay - Figure 13, to the samples that we added ovalbumin, neither of the OT-I and OT-II cells did not proliferate. To the samples with SIINFEKL added, it is possible to observe that the samples that were irradiated has less T cells proliferated. This could be due to a space issue, since the cells irradiated stop to grow and proliferate.
The samples only with B cells and CD4+ T cells do not show any CFSE because only
CD8+ T cells were labelled with CFSE. These samples were negative controls.
21 resuspended in a new medium. B cells are counted and co-cultered with T cells. As we changed the medium, all components released by B cells for two days are discarded too. To check if these components could interfere in T cell proliferation, we performed two more assays: one of each we changed the medium but added again anti-CD40; in the other assay, we saved the old supernatant to be used in final culture.[23]
Figure 14 T cell proliferation. In this data is shown CD8+ T cells co-cultured with B cells and CD4+ T
cells (black); CD8+ T cells with the supernatant in which B cells were cultured (red); CD8+ T cells with
anti-CD40 (blue). SIINFEKL was added to all samples.
In this assay – Figure 14, in some samples were added a-CD40 or the supernatant of B cells culture. We can see that in both samples, T cells proliferate the same amount of times and approximately the same amount of cells. The data shows that even with the presence of OT-II cells, the number of times that cells proliferate are the same as the amount of cells.
So, in summary, it is possible to conclude that all changes made in this experiment induce the same amount of proliferation and the same amount of cycle division, we can predict that none of this aid T cells proliferation.
22 3.2. Ovalbumin uptake by B cells
To ascertain if the problem of T cell proliferation is due to the antigen internalization or consequent degradation and cross-presentation, it was developed a system in which we can monitor ovalbumin uptake.
To the B cells is added anti-IgM F(ab)2-biotin follow addition of
anti-Biotin-OVA-FITC according to Figure 15.
Figure 15 B cell model to monitor ovalbumin uptake, degradation and presentation. To the B cells was
added anti-IgM F(ab)2-biotin to which we linked anti-Biotin-OVA-FITC.
23
0 0 .5 2 4 6 6 ( s tim )
0 2 0 4 0 6 0 8 0 1 0 0
B cell u p tak e
T im e ( h o u r s )
% o f li v e B 2 2 0 + c e ll s
O V A
H 2 k b -S IIN F E K L
Figure 16 Ovalbumin degradation and SIINFEKL presentation. This data shows ovalbumin degradation in black and consequent SIINFEKL presentation in red. The samples were measured at time points 0, 30 min, 2, 4 and 6 hours. A control sample was measured in which B cells were stimulated for 6 hours with
anti-CD40.
3.3. T cell proliferation induced by dendritic cells
According to the data obtained before, T cell proliferation induced by B cells is a process that works poorly despite this type of cells can uptake ovalbumin and present your derived peptide.
Dendritic cells are professional APCs and for this reason, added to the fact that cross-presentation is an important mechanism to generate immune responses against pathogens, part of my work in this thesis was studying the cross-presentation capacity in CD8+ and CD8- DCs.
These process was studied in WASp KO and X-linked neutropenia mice compared with wiltype mice.[24]
One of the steps in cross-presentation by DCs is the exogenous antigen degradation in endosomal/phagosomal compartment. As additional studies to understand this mechanism, it was measured the acidification in phagosome compartment and reactive oxygen species for both DCs subsets CD8+ and CD8- in WASp KO and XLN mice.[25]
3.3.1. OT-I proliferation with WASp KO dendritic cells
24 added to the medium and the proliferation induced by CD8+ and CD8- DCs was measured. 16
µg/ml, 50 µg/ml and 150 µg/ml of ovalbumin was added.
As described in materials and methods, CD8+ T cells proliferation was monitored by
CFSE dilution and measured by flow cytometry.
In Figure 17, is shown the histogram obtained by flow cytometry of CD8+ T cells proliferation induced by wildtype and WASp KO. The histogram shows the number of cells in each generation, in other words, for CD8+ DCs, it possible to see 6 peaks in which the peak with
CFSE higher correspond to the cells that did not proliferate and the peak with CFSE lower correspond to the number of cells that proliferate more. The histograms show too that CD8+
WASp KO DCs have more proliferative cells than in wildtype DCs, so the three lowest CFSE are higher.
Figure 17 Proliferation of CD8+ T cells induced by CD8+ dendritic cells. This is a representative
histogram for all ovalbumin concentrations used in this assay and it was obtained by flow cytometry. In black is shown the proliferative peaks induced by wildtype (WT) DCs and in red the proliferative peaks
induced by WASp KO (WKO) DCs.
From the histograms, it was quantified the number of cells for each ovalbumin concentration. This quantification is shown in Figure 18.
With CD8+ DCs, it is possible to see that for all different ovalbumin concentration,
WKO DCs induce more CD8+ T cell proliferation comparing with WT. This difference become
significant when is added to the medium 150 µg/ml of ovalbumin. It is shown too, an increase of CD8+ T cell proliferation as is increased the amount of antigen given to the cells, since the
uptake, internalization and presentation is bigger than with low amount of antigen.
CD8 DCs
25
Figure 18 CD8+ T cell proliferation. CD8+ T cell numbers are shown in presence of 16, 50 and 150
µg/ml of ovalbumin. Cells induced by wildtype (WT) DCs are represented in black and by WASp KO (WKO) DCs are represented in red.
It was done the same procedure with CD8- DCs – Figure 19. With this DC subset,
looking through the histograms, it is possible count 6 proliferative peaks as well as CD8+
dendritic cells in which the CFSE higher peak correspond to the cells that did not proliferate and the CFSE lower peak correspond to the cells that proliferate more. CD8+ T cells proliferate
more when induced by WKO DCs than when are induced by WT.
One difference between CD8- DCs and CD8+ DCs shown in histogram and is not
possible to detect when is represented in graphs is that the highest CFSE peak for both WT and WKO is higher than as in CD8+ DCs. This means that despite has a lot of proliferative cells,
there are some that did not proliferate. And this peak is not so prominent for CD8+ DCs.
Figure 19 Proliferation of CD8+ T cells induced by CD8- DCs. This is a representative histogram for all
ovalbumin concentrations used in this assay and it was obtained by flow cytometry. In black is shown the proliferative peaks induced by wildtype (WT) DCs and in red the proliferative peaks induced by WASp
26 The Figure 20 shows the number of CD8+ T cells co-cultured with CD8- DCs. It shows the number of cells measured for 16, 50 and 150 µg/ml.
The data shows that for all ovalbumin concentration, CD8+ T cells induced by WASp
KO DCs proliferate more than by WT mice and this number are significant for 50 µg/ml and 150 µg/ml of ovalbumin.
Figure 20 Proliferation of CD8+ T cells induced by CD8- DCs. CD8+ T cell number is shown in presence
of 16, 50 and 150 µg/ml of ovalbumin. Cells induced by wildtype (WT) DCs are represented in black and by WASp KO (WKO) DCs are represented in red.
Comparing the data from CD8+ and CD8- DCs, it is possible to see that the number of
proliferative cells are similar for 16 µg/ml and 150 µg/ml. However, in 50 µg/ml, the amount of CD8+ T cells proliferated are almost the double. One reason for this, could be the amount of
CD8- DCs is much bigger than CD8+ DCs and this amount of antigen is enough to induce
proliferation in more cells. Besides CD8- DCs being more than CD8+ DCs as written in
introduction, it was observed that some of CD8+ DCs die overnight. For this reason, after 24
hours, there are more CD8- DCs available to induce T cell proliferation than CD8+ DCs.
With this data it is possible to conclude that both CD8+ and CD8- DCs induce CD8+ T
cell proliferation and this proliferation is proportional to the amount of antigen added to the medium. This proliferation does not reach the saturation with the amount of ovalbumin used.
To complement this experiments, it was performed an experiment in which was used ovalbumin 50 µg/ml to compare CD8+ T cell proliferation between WASp KO and WT DCs.
So, these experiments were performed with CD8+ and CD8- sorted DCs which were co-cultured
with CFSE labelled CD8+ T cells and proliferation was measured after 72 hours of T cell
incubation. The DCs were pre-incubated overnight with ovalbumin-coated latex beads.
Looking to the histograms obtained – Figure 21 – it is possible to see that WKO CD8 -DCs induce more CD8+ T cell proliferation than WT, while CD8+ DCs induce the same
27
Figure 21 Proliferation of CD8+ T cells induced by CD8+ DCs (left) and CD8- DCs (right). This was
performed with 50 µg/ml of ovalbumin and it was obtained by flow cytometry. In black is shown the proliferative peaks induced by wildtype (WT) DCs and in red the proliferative peaks induced by WASp
KO (WKO) DCs.
In Figure 22 is shown the number of CD8+ T cells co-cultured with WT and WASp KO CD8+ DCs and CD8- DCs. This data shows that WKO CD8+ DCs induce the same amount of T
cell proliferation while WKO CD8- DCs induce more proliferation than WT CD8- DCs. This
result is statistically significant.
Figure 22 CD8+ T cell proliferation. CD8+ T cell number is shown for both DC subsets from wildtype
(WT) and WASp KO (WKO) DCs. CD8+ T cells co-cultured with CD8+ WT DCs are representing in
grey; co-cultured with CD8+ WKO DCs in pink; co-cultured with CD8- WT DCs in black; and
co-cultured with CD8- WKO DCs in red.
WT WKO
WT WKO
28 This data shows that WKO CD8- DCs induce more T cell proliferation than WT mice.
The next important step is to ascertain why this happen and try to study the mechanism.
3.3.2. Acidification in CD8+ and CD8- WT and WASp KO dendritic cells
It is know from literature that DCs can acidify their pH between 5 and 3 and in this case, they present the antigen in MHC class II. Some DCs keep their pH around 7 and present the antigen in MHC class I promoting the CD8+ T cell proliferation, according to Figure
23.[26]
Figure 23 Cross-presentation and acidification by DCs. CD8- dendritic cells tend to acidify more and
present peptides in MHC class II inducing CD4+ T cell proliferation; while CD8+ dendritic cells tend to
acidify less and present peptides in MHC class I inducing CD8+ T cell proliferation.
So, one important step to try to find an explanation for what was shown first, is study the acidification in both DC subsets from WT and WASp KO mice. For that, it was given to the DCs beads coupled with ovalbumin and pH rodo. DCs are able to phagocyte the beads, and it is possible to monitor the phagosome acidification by pH rodo, according to Figure 24.
MHCI
CD8 T
DC
TCR +
MHCII
TCR
+
CD4 T
pH7
29
Figure 24 Acidification model. Latex beads coated with pH-rodo ovalbumin were exploited to monitor
the phagosome acidification in both CD8+ and CD8- DCs.
The histograms from flow cytometry are shown in Figure 25 and Figure 26, for CD8+ DCs and CD8- DCs, respectively.
In these histograms are shown the percentage of cells in each amount of pH rodo. Higher pH rodo concentration means that the cell acidify more. Both histograms show a main peak similar for WT and WASp KO DCs and smallest peaks corresponding to the pH rodo high. This part of the histogram is the determinant part to measure the acidification since is different in both WT and WKO and in both DCs subsets. pH rodo high was measured after 2 and 6 hours of incubation.
According to the histogram, for CD8+ DCs – Figure 25, it is possible to see a small
difference between wildtype and WASp KO in pH rodo high in which wildtype shows a slightly increase in this component.
Figure 25 pH rodo signal of CD8+ DCs. This is a representative histogram for all the time points in this
assay and it was obtained by flow cytometry. In black is shown the pH rodo in wildtype (WT) DCs and in red the pH rodo in WASp KO (WKO) DCs.
pH 5-3 pHrodo-OVA
CD8+DC
WT WKO
30 For CD8- DCs – Figure 26, the histogram shows as for the other DC subset, a main
peak similar between WT and WASp KO, however in pH rodo high is possible to see that WASp KO has less pH rodo than WT.
Figure 26 pH rodo signal of CD8- DCs. This is a representative histogram for all the time points in this
assay and it was obtained by flow cytometry. In black is shown the pH rodo in wildtype (WT) DCs and in red the pH rodo in WASp KO (WKO) DCs.
Comparing the histograms, at the first looking is not possible see any difference between WASp KO and WT for CD8+ DCs but for the CD8- DCs, it is possible to see that
WKO DCs have lower pH rodo that means they acidify less.
From all histograms it was measured pH rodo high at 2 hours and 6 hours incubation for CD8+ and CD8- DCs from WT and WASp KO.
CD8-DC
WT WKO
31
Figure 27 Acidification in CD8+ dendritic cells. pH rodo intensity was measured after 2 and 6 hours of
incubation with ovalbumin-coated latex beads. Wildtype (WT) DCs are represented in grey and WASp KO (WKO) DCs are represented in pink.
According to the data – Figure 27 – is shown that there is no difference between WT and WASp KO after 2 hours of incubation but after 6 hours incubation, both WT and WASp KO acidify more comparing to time point 2 hours and WT acidify more than WASp KO CD8+
DCs. This difference is statistical significant.
According to the Figure 28, it is possible to see that for both time points, WASp KO DCs acidify less than WT. And for both results, there is statistical significance.
Figure 28 Acidification inCD8- dendritic cells. pH rodo intensity was measured after 2 and 6 hours of
32 Comparing CD8+ and CD8- DCs, the data shows the percentage of cells that are able to
acidify is much higher in CD8- subset for both WT and WKO. Relatively to the mice, the data
shows that WASp KO DCs acidify less in both CD8+ and CD8- DCs.
However, CD8- DCs seems to acidify more and faster than CD8+ DCs because the
percentage of cells that are able to acidify are similar at 2 hours incubation and 6 hours incubation while the CD8+ DCs have an increase at 6 hours time point.
Together, NADPH oxidase and V-ATPase control both acidification and reactive oxygen species in the cytosol and phagosome.
Rac1 and Rac2 are small Rho GTPases and is described in literature that participate in phagocytosis.[27],[28]
For this reason, the Rac GTPases expression is another subject needed to be studied in DCs acidification since they belong to the NADPH oxidase complex. In this assay, it was given to CD8+ and CD8- DCs beads coupled with ovalbumin allowed DCs to phagocyte the beads.
They were, after, stained for Rac1 and Rac2 and analysed by confocal microscopy, as shown in Figure 29.
Figure 29 Confocal microscopy images of Rac1 and Rac2 expression in wildtype (WT) and WASp KO
(WKO) CD8+ and CD8- DCs. DCs were stained for Rac1-FITC (green) and Rac2-Alexa555 (red)
antibodies. The phagocytosed bead is marked with an asterisk.
According to the images obtained is possible to see that Rac1 is localized around all cell while Rac2 is localized around the phagosome where the bead is. Both WT and WASp WKO CD8+ DCs have increased localization of Rac1 comparing CD8- DCs but between WT and
WASp KO it is similar. For CD8- DCs, Rac1 is showed more intense in WASp KO cell
comparing to the wildtype.
33 Concerning to the Rac2 localization, in CD8+ DCs, the amount of this GTPase is similar
in WT and WASp KO cells but in CD8- DCs, it is possible to see that WKO CD8- DCs has
increased amount of Rac2 and this is localized around the phagosome while for WT is more spread.
Is described in literature that CD8+ DCs, compared with CD8- DCs, have higher
capacity to cross-present exogenous antigens. [29]
This is shown in our data related to the OT-I proliferation in the histograms corresponding to the Figure 17 and Figure 19 in which is possible to see one peak with CFSE high corresponding to the cells that did not proliferate.
In our data, is shown that CD8- DCs acidify more and this could be a reason for less
proliferation. It was shown before that one cell is able to cross-present an antigen if this has the right degradation, in other words, the cell should have the right pH so the antigen is degraded enough to the cell is able to present it but should not be too much acidic otherwise the antigen will be denatured. For this reason, DCs are better in cross-presentation than macrophages.[30], [31]
As CD8- DCs acidify more than CD8+ DCs, probably the antigen is more degraded and
for this reason, they are not able to present a peptide able to induce T cell proliferation.
In our data is shown too that WASp KO CD8- DCs have decreased capacity to acidify
endocytic vesicles than in wildtype, so this could be the reason to they induce more CD8+ T cell
proliferation since the ovalbumin antigen suffer less enzyme degradation.
So, our main conclusion is that increased cross-presentation by WASp KO DCs is due to decreased capacity to acidify phagosomes.
CD8+ DCs are equipped with a machinery that makes them specialized in
cross-presentation of antigens. This machinery involves localization of Rac2 to the phagosomal membrane to assembly the NADPH oxidase complex (NOX2) that is responsible for maintaining a neutral pH of the phagosome. [7],[29]
According to our data, it is possible to conclude that WASp KO CD8- DCs have
increased Rac2 localization to the phagosome.
34
Figure 30 Acidification model of wildtype (WT) and WASp KO DCs. WASp KO DCs shows increased
acidification and Rac2 localization in phagosome compared to WT DCs. Altogether this leads to increase CD8+ T cell proliferation.
3.3.3. OT-I proliferation with XLN dendritic cells
As written before, X-Linked Neutropenia is a WASp related disorder in which actin is constitutively expressed, being the opposite to Wiskott-Aldrich syndrome in which actin is not expressed.
So, for this reason, it was done some experiments with XLN I296T to compare wiltdtype and XLN mice.
Since T cell proliferation is a very important step in the immune response, it was the first experiment done. It was sorted CD8+ and CD8- DCs and co-cultured with CD8+ T cells
labelled with CFSE. After 72 hours of T cells incubation, it was measured T cell proliferation. It was measured CFSE low that means was quantified the cells that proliferate more. The results are shown in Figure 31 and Figure 32.
WT DC
MHCI
CD8 T
TCR
+
MHCII
TCR
+
CD4 T
pH7pH5-3
WASp KO DC
MHCI
pH7
pH5-3
35 1 6g /m l 5 0g /m l 1 5 0g /m l
0 2 0 0 0 0 4 0 0 0 0 6 0 0 0 0
O T 1 p ro lifera tio n w ith C D 8- D C s
c e ll n u m b e r W T X L N
Figure 31 CD8+ T cell proliferation. CD8+ T cell number is shown in presence of 16, 50 and 150 µg/ml
of ovalbumin. Cells induced by wildtype (WT) DCs are represented in black and by X-linked neutropenia (XLN) DCs are represented in blue.
1 6g /m l 5 0g /m l 1 5 0g /m l 0
5 0 0 0 1 0 0 0 0 1 5 0 0 0 2 0 0 0 0
O T 1 p ro lifera tio n w ith C D 8+ D C s
c e ll n u m b e r W T X L N
Figure 32 CD8+ T cell proliferation. CD8+ T cell number is shown in presence of 16, 50 and 150 µg/ml
of ovalbumin. Cells induced by wildtype (WT) DCs are represented in black and by X-linked neutropenia (XLN) DCs are represented in blue.
36 For both CD8+ and CD8- DCs, the amount of T cells that proliferate are approximately
the same for each ovalbumin concentration.
To compare XLN and WASp KO DCs and your capacity to induce proliferation, was done an assay to compare their acidification as done for WASp KO DCs.
3.3.4. Acidification capacity by CD8+ and CD8- WT and XLN dendritic cells
In this assay, it was incubated CD8+ and CD8- dendritic cells with OVA-pHrodo and
was measured the acidification of each DC subset after 2 and 6 hours. As seen before, WKO DCs have less pH rodo in both subsets.
For CD8+ XLN DCs, the data – Figure 33 shows that the amount of pH rodo is higher
than wildtype and WASp KO. This data is according to Mean Fluorescence Intensity (MFI) and that means WASp KO DCs have less fluorescence intensity and XLN DCs have more.
Note: In incubation time 6 hours, WKO DCs were very few so the error bar is bigger than the other samples.
W T W K O X L N W T W K O X L N C t r C t r C t r
0 2 0 0 0 4 0 0 0 6 0 0 0 8 0 0 0 1 0 0 0 0
p H r o d o C D 8+ D C s
M
F
I
2 h o u rs 6 h o u rs
** *
*** ***
Figure 33 Acidification in CD8+ dendritic cells. pH rodo intensity was measured after 2 and 6 hours of
37 For CD8- XLN DCs, the data – Figure 34 shows that the amount of pH rodo is higher
than WASp KO and similar to the wildtype for both incubation time. This data is according to Mean Fluorescence Intensity (MFI) and that means WASp KO DCs have less fluorescence intensity and XLN DCs have more.
W T W K O X L N W T W K O X L N C t r C t r C t r
0 5 0 0 0 1 0 0 0 0 1 5 0 0 0 2 0 0 0 0
2 h o u rs 6 h o u rs
** **** **** **
p H r o d o C D 8- D C s
M
F
I
Figure 34 Acidification in CD8- dendritic cells. pH rodo intensity was measured after 2 and 6 hours of
incubation with ovalbumin-coated latex beads. Wildtype (WT) DCs are represented in black, WASp KO (WKO) DCs are represented in red and X-linked neutropenia (XLN) DCs are represented in blue.
However, when is measured the percentage of cells as done to compare wildtype and WASp KO DCs, for CD8+ DCs it is possible to see that has no difference between them as
shown in Figure 35. This data is consistent with Figure 32, where is shown CD8+ T cells proliferation.
That figure shows that CD8+ T cells proliferate the same when induced by WASp KO
DCs or XLN DCs. Since this proliferation is directly connected to the acidification compartments in the cells, we showed that the capacity of XLN mice to induce CD8+ T cell
38
W T X LN W T X LN
0 2 0 4 0 6 0 8 0
p H r o d ohi C D 8+D C s
% o f c e ll s
2 h o u rs 6 h o u rs
Figure 35 Acidification in CD8+ dendritic cells. pH rodo intensity was measured after 2 and 6 hours of
incubation with ovalbumin-coated latex beads. Wildtype (WT) DCs are represented in grey and X-linked neutropenia (XLN) DCs are represented in light blue.
When we analyse the acidification in CD8- DCs, the type of DCs with higher capacity
to acidify, the data – Figure 36,shows that after 2 hours incubation XLN DCs acidify less than WT DCs with statistical significance but after 6 hours incubation the acidification is the same in WT and XLN. This shows a delay in DCs acidification and could be the reason for the CD8+ T
cells proliferate the same than when induced by WT DCs, since after 6 hours, the acidification capacity is the same.
W T X LN W T X LN
0 2 0 4 0 6 0 8 0
p H r o d ohi C D 8-D C s
% o f c e ll s
2 h o u rs 6 h o u rs *
Figure 36 Acidification in CD8- dendritic cells. pH rodo intensity was measured after 2 and 6 hours of