Daniel José Rossa Gralheira
Bachelor in Biochemistry
Tyrosinase-Based Phenol Remediation
Dissertation for the obtention of the Master Degree in Biotechnology
Supervisor: Doctor João Marques Cortez,
Auxiliary Researcher, REQUIMTE
Co-supervisor: Doctor Marco Silva, Auxiliary Professor, FCT/
UNL
Jury:
President: Doctor Pedro Miguel Ribeiro Viana Batista, Aggregate Auxiliary Professor , FCT/ UNL Examiner(s): Doctor Maria Gabriela Machado, Auxiliary Researcher, FCT/ UNL
iii Tyrosinase-based Phenol Remediation Copyright © 2012
Daniel Gralheira
Faculdade de Ciências e Tecnologia – Universidade Nova de Lisboa Universidade Nova de Lisboa
The Faculdade de Ciências e Tecnologia and the Universidade Nova de Lisboa have the right, perpetual and without geographic limits, to file and publish this dissertation by mean of printed copies reproduced in paper or by a digital form, or by any other known or to be invented mean,
and to divulge through scientific repositories and to admit its coping and distribution with educational and research purposes, non commercial, as long credit is given to the author and
the editor.
A Faculdade de Ciências e Tecnologia e a Universidade Nova de Lisboa têm o direito, perpétuo e sem limites geográficos, de arquivar e publicar esta dissertação através de exemplares impressos reproduzidos em papel ou de forma digital, ou por qualquer outro meio conhecido ou que venha a ser inventado, e de a divulgar através de repositórios científicos e de admitir a sua cópia e distribuição com objectivos educacionais ou de investigação, não comerciais, desde
v
Acknowledgements
This dissertation is the product of innumerous contributions that cannot be resumed to the author name on the cover.
I would like to start by emphasizing my deepest appreciation for the indisputable scientific correctness (that will surely guide me beyond this project), vision for this dissertation and the vast support of my supervisor, Dr. João Cortez.
The kind acceptance of Dr. Marco Silva to be my supervisor enhanced the significance of the undertaken task and brought an inestimable know-how on analytical methods. To this respect it is not possible to forget the guidance of Dr. Eduardo Mateus on the initial approach to gas chromatography and the kind treatment by the members of the analytical group.
The companionship of all my laboratory colleagues was of most importance to get through the most difficult days and, in special, the practical advices from Master João Luz were a valuable asset.
I also need to acknowledge Dr. José Gomes and Dr. Fábio Chalub, from Mathematics Department, for their eagerness to help solving the protein/nanoparticle ratio problem.
I am thankful for all my family, particularly to Hélder, my father; Cremilde, my mother and Ricardo, my brother. They gave me the necessary support to study in this fantastic university and, not helping in the work, they were crucial by not causing me much trouble.
T. Pernes, V. Correia, I. Camacho; you were laugh and suffering friends all the way and one could not wish for more.
vii
Abstract
Nanobiotechnology is an emerging area full of potentialities to explore and reshape instituted knowledge. In this work, the main goal was to design and test biological remediation systems (a total of three) taking advantage of nanotechnology features, as a step towards future progress of sense-and-shoot combined systems. This task involved the development of active bionanoconjugates (BNC) with two different tyrosinases (Agaricus bisporus - AbT, and
Tricoderma reesei - TrT) to be implemented in three suggested phenol remediation systems. AuNP-MUA (gold nanoparticles capped with11-mercapto-1-undecanoic acid) 1:5000 colloid was shown to be stable up to 100 mM ionic strength (sodium cloride) and able to form active BNCs with AbT. TrT:AuNP ratio for BNC formation is recommended as 100, supported by zeta potential and agarose gel mobility experimental data which, in turn, atone with the proposed theoretical estimation.
The incubation of 100 ppm phenol with BNC-MUA-AbT for 60 minutes achieved 50% substrate conversion (the efficiency of the systems were also investigated using ultraviolet-visible spectrophotometry (UV-Vis) complemented by standard addition method and solid-phase microextraction - gas chromatography (SPME-GC)).
ix
Resumo
A nanotecnologia é uma área emergente cheia de potencialidades a explorar e capaz de redefinir o conhecimento instituído. Neste trabalho, o principal objetivo consistiu em desenhar e testar sistemas biológicos de remediação (um total de três) tirando proveito das capacidades nanotecnológicas, sendo um passo em direção ao futuro progresso de sistemas de deteção-e-eliminação. Esta tarefa envolveu o desenvolvimento de bionanoconjugados (BNC) activos com duas tirosinases diferentes (Agaricus bisporus- AbT, e Tricoderma reesei- TrT) a serem implementados nos três sistemas de remediação de fenóis sugeridos.
O coloide AuNP-MUA (nanopartículas de ouro revestidas com ácido 11-mercapto-1-undecanóico) 1:5000 foi demonstrado ser estável até 100 mM de força iónica (cloreto de sódio) e apto a formar BNCs activos com AbT. O rácio TrT:AuNP para formação de BNC é recomendado como 100, de acordo com dados experimentais de potencial zeta e mobilidade em gel de agarose, os quais, por sua vez, corroboram a estimativa teórica proposta.
Métodos analíticos para avaliar a eficiência dos sistemas foram também investigados: espectrofotometria ultravioleta-visível (UV-Vis) utilizando-se o método da adição padrão; e microextracção de fase-sólida - cromatografia gasosa (SPME-GC). A incubação de 100 ppm de fenol com BNC-MUA-AbT durante 60 minutos alcançou 50% de conversão de substrato.
xi
Table of Contents
Abstract ... vii
Resumo ... ix
Table of Contents ... xi
Table of Figures ... xiii
Table of Tables ... xvii
Symbols and notations ... xix
1- Introduction, ambit and objectives ... 1
1.1- Nanotechnology ... 1
1.1.1- Nanobiotechnology and Bionanotechnology ... 3
1.1.2- Bottom-up and bottom-down approaches ... 5
1.2- Metallic nanoparticles ... 7
1.2.1- General mechanism for metallic nanoparticles formation ... 7
1.2.2- Metallic nanoparticles synthesis ... 9
1.2.3- Capping agents ... 11
1.2.4- Proprieties of Metallic Nanoparticles ... 12
1.3- Bionanoconjugates ... 14
1.4- Tyrosinases ... 14
1.4.1- Tyrosinases- General considerations ... 14
1.4.2- Structure of Tyrosinases ... 16
1.4.3- Activity of Tyrosinases... 19
1.5- Bioremediation ... 21
1.5.1- Bioremediation concept ... 21
1.5.2- Phenol remediation ... 21
1.6- Phenol detection ... 23
1.6.1- Analytical methods... 23
2- Material and methods... 29
2.1- Reagents ... 29
2.1.1- General considerations ... 29
2.2- Bionanoconjugates preparation ... 29
2.2.1- Protein concentration – BCA Assays ... 29
2.2.2- Protein concentration – Activity determination ... 30
xii
2.2.4- AuNP capping ... 31
2.2.5- AuNP bioconjugation ... 31
2.3- TYR activity as ionic strength function ... 32
2.4- Chitosan preparation ... 32
2.5- Phenol detection ... 33
2.5.2- Standard addition – UV-Vis ... 33
2.5.3- Gas Chromatography ... 33
2.6- Bioremediation systems ... 34
2.6.1- Ultracentrifugation recovery batch system ... 34
2.6.2- Immobilized petri dish batch system ... 35
2.6.3- Plug-flow syringe ... 35
3- Results and discussion ... 38
3.1- Bionanoconjugates preparation ... 38
3.1.1- Protein concentration – BCA Assays ... 38
3.1.2- Protein concentration – Activity determination ... 39
3.1.3- Capping agent- MUA ... 40
3.1.5- Enzyme conjugation ratio ... 42
3.2- TYR activity as ionic strength function ... 49
3.3- Chitosan preparation ... 50
3.4- Phenol detection ... 52
3.4.1- UV-Vis phenol spectra ... 52
3.4.2- Standard addition – UV-Vis ... 54
2.4.3- Gas Chromatography ... 54
3.5- Remediation systems ... 56
3.5.1- Ultracentrifugation recovery batch system ... 56
3.5.2- Immobilized petri dish batch system ... 58
4- Conclusion ... 62
5-Bibliography ... 66
6-Appendixes ... 72
1.10- Appendix I- Protein quantification and activity ... 72
1.10- Appendix II- Protein concentration – BCA Assays ... 75
1.10- Appendix III- Protein concentration – Activity determination ... 77
1.10- Appendix IV- Ultrafiltration ... 80
xiii
Table of Figures
Figure 1- Comparative dimension scale from meter to nanometer. ... 1
Figure 2- Detail of the South Rose Window in (1260) the Notre Dame Cathedral, Paris. © Sacred Destinations ... 2
Figure 3- A Damascus saber. ... 2
Figure 4- “Ruby” gold colloid. ... 2
Figure 5- Nanotechnology spawn is expected to drive the next industrial growth cycle. ... 3
Figure 6- Nanobiotechnology example: magnetic resonance contrast effects of magnetic nanoparticles. Under an external field (B0), magnetic NPs are magnetized with a magnetic moment of µ and generate an induced magnetic field which perturbs the nuclear spin relaxation processes of the water protons. This perturbation leads to magnetic resonance contrast enhancement. ... 4
Figure 7- Proposed model for the formation of aligned peptide nanotube arrays. Images of the vertically aligned peptide nanotubes: (a) Scanning electron micrograph; (b) Cold field-emission gun high-resolution scanning electron micrograph; (c) High-magnification micrograph of (b). .... 5
Figure 8- Self-assembly examples. A- peptide-amphiphile nanofibers. B- Micrometer-sized metallic polyhedral folded from planar substrates. C- Aggregate of three millimeter size, rotating, magnetized disks interacting with one another. ... 6
Figure 9- Example methods for NPs assembly on surfaces and interfaces: A- Cadmium sulfide NPs arranged as well defined rings in chemical lithography. B- DNA-templated 1D AuNPs. C-Shape- controlled assembly of truncated octahedral magnetite NPs. D- A colloidosome: NP assembly on the interface of an emulsion droplet. E- Cross-linked cadmium selenide NP membranes at fluid/ fluid interfaces (confocal microscope image). ... 6
Figure 10- Self-assembled monolayer of thiols on a silica substrate, suitable for AuNP assembly. ... 7
Figure 11-(A) Stages of monodisperse colloid growth as described by Le Mer. (B) Schematic apparatus employed in the synthesis of monodisperse NPs in the study of Le Mer nucleation model. ... 8
Figure 12- Turkevich´s nucleation-growth-agglomeration mechanism of metallic nanoparticles formation. ... 9
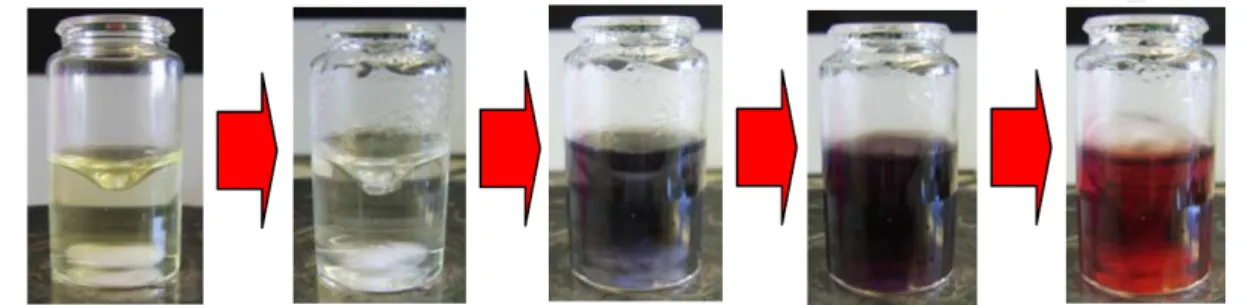
Figure 13- Colour changes during HAuCl4 reduction by citrate at boiling temperature. ... 10
Figure 14- Representation of a MUA capped NP. Not at scale: MUA´s length is at least 4 times smaller than the smallest NPs prepared by common methods. ... 11
Figure 15- Extinction spectra of AuNPs solutions prepared by the Turkevich method with
xiv increase order: red, black, green, blue.) According to Kimling et al., the diameter of the citrate prepared AuNPs is a function of the maximum wavelength of the plasmonic. ... 12
Figure 16- Surface plasmonic effect in a spherical nanoparticle. ... 13
Figure 17- Melanin biosynthesis starting from the natural substrate, tyrosine. Dopaquinone is
converted by the TYR to L-DOPA (which can also be the starting substrate) and dopachrome through auto-oxidation. ... 15
Figure 18- Top (A) and side (B) views of the Agaricus bisporus tyrosinase structure. The H2L2
tetramer structure was obtained by x-ray crystallography (2,6 Å resolution). H-L dimer interactions are between H1 (green) and L1 (cyan), and H2 (red) and L2 (magenta). ... 17
Figure19- Type III Copper centre representation. Dioxygen (white circles) in the peroxide form bounds to both copper ions (black circles) which are in turn coordinated by nitrogen atoms (striped circles) from histidine residues. In the oxi form, Cu(I) become Cu(II). ... 17
Figure 20- TrT activity on 15 mM L-dopa 300 - 400 nkat/mg (depending on the enzyme formula and preparation), Tris-HCl buffer pH 7.5. ... 18
Figure 21- Reaction rate at different tyrosine concentrations for AbT (black squares) and TrT
(white circles)... 19
Figure 22- Typical Michaelis-Menten kinetic curve: initial velocity (V0) vs. substrate
concentration ([S]). Vmax- maximum reaction rate ... 20
Figure 23- Glassy carbon- Gold nanoparticle-Tyrosinase (GC-AuNP-TYR) electrode approach for biosensing. ... 23
Figure 24- Molecular structure of chitosan. ... 25
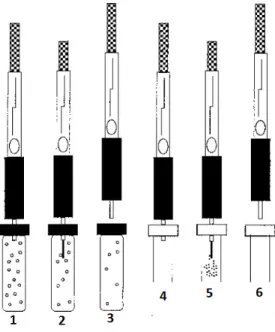
Figure 25- SPME typical sampler, extraction (1-3) and injection (4-6) stances. At 2nd and 4th frames, the extracting fiber is exposed from the needle to the sample and to the injector respectively. ... 26
Figure 26- Aqueous benzene (1 ppm) extraction outlines under different magnetic agitation
intensities. ... 26
Figure 27- After 1 hour reaction, the BNC were ultracentrifuge, and recovered in the filter to be
ressuspended and reused. ... 34
Figure 28- Petri dish containing a glass square with immobilized BNC/TYR immersed in a
tyrosine solution, under agitation... 35
Figure 29- A- Assembled plug-flow module and its three different parts. B- Shaped emboli with perfurations on top. ... 36
Figure 30-AuNP MUA 1:5000 produced by the new proposed method. Diluted 1:101 from the
recovered pellets. NP concentration estimated between 130-137±4 nM; diameter: 11,74±0,04 nm. ... 40
Figure 31– AuNP-MUA 1:5000 3 nM non ultracentrifuged. In order: non-centrifuged NP in
water, and phosphate buffer saline. ... 41
Figure 32–UV-Vis spectra for ultracentrifuged AuNP-MUA 1:5000. ... 41
xv
Figure 34– Correlation between experimental globular protein diameters and molecular weight.
Data from (from least to most heavy): cytochrome C; myoglobin; insulin hexamer; hemoglobin;
catalase. ... 43
Figure 35– Thomson´s Model approach to estimate AuNP maximum protein coverage. The minimum angle (red frame) is calculated and then tables for Thomson´s problem are used to find the maximum N (number of surface elements) ... 44
Figure 36– Agarose gel electrophoresis of AuNP-MUA incubated with progressively higher TrT concentrations. Values indicated are in nanomolar. Third sample was deposited without glycine. ... 45
Figure 37– Relative mobility (Rf) for each BNC (TrT) band in the agarose electrophoresis gel.45 Figure 38– Zeta Potential profile (General Purpose method) for a BNC sample with suboptimal TrT concentration (1:50). ... 46
Figure 39– Zeta Potencial variation for TrT conjugation with AuNP. Conjugation at pH 7 followed by a change to pH 9. The red line corresponds to the theoretical adjustment of the data. ... 47
Figure 40– Zeta Potential variation for TrT conjugation with AuNP. Blue lines: ∆ζ = mx; ∆ζ = ∆ζMax. Green lines: extrapolated lines from plateau and BNC growing zone. ... 48
Figure 41– Zeta Potential peak shift for BNC peak as function of passing days since conjugation with 100 nM TrT was started. ... 48
Figure 42– AbT and TrT activity rates at different ionic strengths. (100%= max act) ... 49
Figure 43– Chitosan (6 mg/mL) dry films. (Brown residue is a contamination) ... 51
Figure 44– AuNP-MUA 1 nM entrapped within chitosan beads (6 mg/mL in acetic acid). ... 51
Figure 45 – Chitosan (6 mg/mL) beads entrapped in an agarose matrix (0.5%). ... 51
Figure 46– UV-Vis spectra of 60 ppm at pH 7 (phosphate buffer 50 mM), before (dark blue) and after (light blue) incubation with AbT for 10 minutes. ... 52
Figure 47– Phenol calibration lines using phenol characteristic peak wavelengths. (1 mg/L ≈ 1 ppm phenol) ... 52
Figure 48– Phenol absorbance at characteristic peak wavelengths after AbT addition (10 minutes of reaction). (1 mg/L ≈ 1 ppm phenol) ... 53
Figure 49– Calibration line for phenol standards (0minutes reaction) and the same concentrations after 10 minutes incubation with AbT... 53
Figure 50– Standard addition method applied for a 20 ppm phenol solution incubated with AbT 1x. ... 54
Figure 51– Phenol adsorption curve obtained after representing the exposition time vs phenol area. ... 55
Figure 52– Calibration line for phenol concentration using hexan-1-ol as internal standard. .... 55
Figure 53– Phenol remaining in two sets of experiments, after incubation of 100 ppm phenol pH 7 solutions with AbT. ... 56
Figure 54– Ultracentrifugation recovery batch system activity performance. ... 57
xvi
Figure 56– Reaction profile of filtered BNC-MUA at 1699 G. ... 58
Figure 57 – Chitosan immobilized petri dish batch system reaction progress. ... 59
Figure 58– Chitosan immobilized petri dish batch system reaction progress. (magnification) .. 59
Figure 59– Sigma AbT activity protocol. (Page 1/3) ... 72
Figure 60– Sigma AbT activity protocol. (Page 2/3) ... 73
Figure 61– Sigma AbT activity protocol. (Page 3/3) ... 74
Figure 62– BCA calibration curve for Lot1. ... 75
Figure 63– BCA calibration curve for Lot2. ... 75
Figure 64– BCA calibration curve for Lot3. ... 76
Figure 65– BCA calibration curve for TrT. ... 76
Figure 66– Sigma assay for Lot1... 77
Figure 67– Sigma assay for Lot2... 78
Figure 68– Sigma assay for Lot3... 78
Figure 69– Activity assay for TrT. ... 79
Figure 70– Maximum activity rate zone for TrT. Magnification of Figure 69. ... 79
Figure 71– Distilled water filtrated volume as G force centrifugation function, using a Amicon Ultra-4 centrifugal unit 100 kDa cut-off(Millipore). ... 80
Figure 72– Percentage of activity retained by BNC-AbT after a single centrifugation [Amicon Ultra-4 centrifugal unit 100 kDa cut-off (Millipore)] at different velocities. Sigma activity protocol used to test the activity. 100% activity= BNC-AbT before centrifugation. ... 80
xvii
Table of Tables
Table 1- Protein content (wt /wt) in 3 commercial AbT (Sigma-Aldrich) Lots……….……38
Table 2- Protein content (µg /mL) in the commercial TrT (VVT) lot……….…..…...38
Table 3- Commercial AbT activity (U /mL). Total represents the results comparatively to labeled
data…...……….……….39
Table 4- Commercial TrT activity (nkatal). Total represents the results comparatively to labeled data...40
Table 5- Zeta potential data (General Purpose method) for a BNC sample with suboptimal TrT
xix
Symbols and notations
1x- TYR concentration enough to conjugate with 1 nM of AuNP ([AbT]= 9 mg/mmol AuNP;
[TrT]= 100 nmol/nmol AuNP)
AbT- Tyrosinase from Agaricus bisporus
AFM- Atomic Force Microscopy
APS- Ammonium persulfate
AuNP- Gold nanoparticle
BCA- Bicinchoninic Acid
BNC- Bionanoconjugate
BSA- Bovine Sorum Albumin
CALKK- pentapetide : Cysteine, Alanine, Leucine, Lysine (2x)
CALNN- pentapetide : Cysteine, Alanine, Leucine, Asparagine (2x)
Cit- Citrate
CWX- Carbowax
DHI- Dihydroxyindole
DHICA- Dihydroxyindole-2-carboxylic acid
EPA- United States Environmental Protection Agency
EPR- Electron Paramagnetic Resonance
FID- Flame Ionization Detector
GC- Gas Chromatography
GC/MS- Gas Chromatography–Mass Spectrometry
HBTA- 5-hydroxy-1,4-benzothiazinylalanine
HPLC-UV- High-Performance Liquid Chromatography- Ultraviolet
ICP- Inductively Coupled Plasma Atomic Emission Spectroscopy
Km- Michaelis constant
LSPR- Localized Surface Plasmon Resonance
L-DOPA- L-3,4-dihydroxyphenylalanine; IUPAC: (S)-2-amino-3-(3,4-dihydroxyphenyl) propanoic
acid; common name: L-dopamine
GHB-γ-glutaminyl-4-hydroxybenzen
MBTH- 3-methyl-2-benzothiazolinone hydrazone
MNP- Metallic Nanoparticle
MUA- 11-mercapto-1-undecanoic acid
N- Number of electrons on an atom surface
NADH- Reduced Nicotinamide Adenine Dinucleotide
NP- Nanoparticle
PA- Polyacrylate
PDMS- Polydimethylsiloxane
xx
SDS-PAGE- Polyacrylamide gel electrophoresis in sodium dodecyl sulfate
SPR- Surface Plasmon Resonance
SPME- Solid phase microextraction
STM- Scanning Tunneling Microscope
T3Cu- Type III copper centres (T3Cu)
TrT- Tyrosinase from Trichoderma reesei
TYR- Tyrosinase
UV-Vis- Ultraviolet and Visible
V0- Initial reaction rate
1
1- Introduction, ambit and objectives
1.1- Nanotechnology
The first documented mention to the nanotechnological concepts occurred in “There´s Plenty of Room at the Bottom”, a talk by the Nobel laureate physicist Richard P. Feynman, during the American Physical Society annual meeting in 1959. In this talk it was given emphasis to the idea that, at nanoscale, it would occur a change in the magnitude of the physical phenomena over the matter.1 The term “nano-technology” was first defined in a 1974 paper by Norio Taniguchi but still solely attached to the scale and dimension issues and, therefore, far from its actual conception. In the next decade, Dr. K. Eric Drexler promoted a much different idea for the term as he realized the technological significance of the nanoscale phenomena and so the term approached to its current sense.2
2 A lack of consensus about the nanotechnology concept arose in the scientific community leading to the foundation of committees in many countries, namely the United States National Nanotechnology Initiative with the purpose to understand, create and promote systems with fundamentally new proprieties due to its nanoscale composition. This committee established that nanotechnology is the study of matter ranging from about 1-100nm –between 102 and 107 atoms3- (a human air measures approximately 75x103 nm of thickness- Fig.14). The ISO (International Organization for Standardization) technical committee for Nanotechnologies stated nanotechnology´s scope as (quoting):
1. Understanding and control of matter and processes at the nanoscale, typically, but not exclusively, below 100 nanometers in one or more dimensions where the onset of size-dependent phenomena usually enables novel applications,
2. Utilizing the properties of nanoscale materials that differ from the properties of individual atoms, molecules, and bulk matter, to create improved materials, devices, and systems that exploit these new properties.5
In this document, the later, will be the definition in use however, for a deeper revision on the topic, reading Michael Decker´s Newsletter “Definitions of Nanotechnology – Who needs them?”(2003) is advisable6.
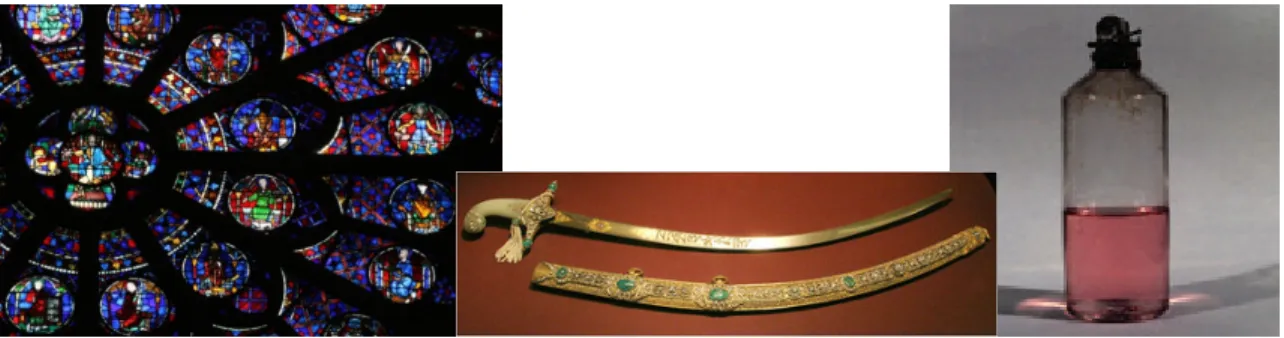
Materials with nanocomponents come from far beyond the Modern Age and have been used by the craftsmen at least since the Roman civilization (4th century). There are many examples described such as stained glass windows in European cathedrals (Fig. 2)2, 7 owing their rich colors to nanoparticles of gold chloride and other metal oxides and chlorides, and Damascus saber blades containing carbon nanotubes and cementite nanowires (Fig. 3).8
In 1857 Michael Faraday started the pathway into the depth of this knowledge as he discovered colloidal “ruby” gold proving that nanoscale gold could produce solutions with different colors from the metallic one (Fig. 4).8
Figure 2- Detail of the South Rose Window in (1260) the Notre Dame Cathedral, Paris. © Sacred Destinations
Figure3- A Damascus saber. (photo by Tina Fineberg for The New York Times).
3 In the early 1980s two key developments; the birth of cluster science and the invention of the scanning tunneling microscope (STM) enabled nanoscience the first major steps. Soon, in 1986, fullerenes were discovered, in 1991 the carbon nanotubes, in 1992 the atomic force microscope was invented and in 1993 the synthesis of semiconductor nanocrystals (Quantum Dots) was started. In the present, the market outcome of nanotechnology is expressed in improved products benefiting from a new material or in manufacturing processes. Moreover, the top down approach to create smaller components has gained more tools with this science and in the other hand, the bottom up approach is getting firm soil in self-assembly processes owing to nanotecnhological phenomena comprehension.2
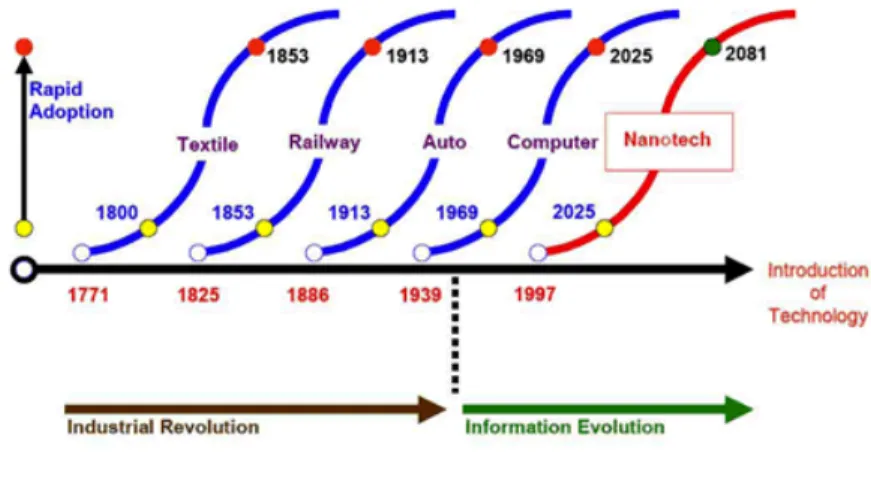
The possibility of rebuilding existing products (not mentioning the new ones) either with better performances, smaller parts and lower cost is very attractive to companies and “evolutionary nanotechonology” is predicted to run across many industries reshaping them (Fig 5)2. In spite of being a young field, the expectations are great and public awareness is rising due to marketing and popular culture references.2
Figure 5- Nanotechnology spawn is expected to drive the next industrial growth cycle.
1.1.1- Nanobiotechnology and Bionanotechnology
Classifying a work in a field of science is not critical to its integrity and do not mine its achievements but it is an important way to analyze them in the state-of-art perspective and therefore assess its impact.
4 (inorganic composites or not) from biological systems (e.g. nucleic acids, proteins and cell) and to study and develop biological processes using techniques originally designed to manipulate nanostructured materials.(Fig. 6)9
Figure 6- Nanobiotechnology example: magnetic resonance contrast effects of magnetic nanoparticles.
Under an external field (B0), magnetic NPs are magnetized with a magnetic moment of µ and generate an
induced magnetic field which perturbs the nuclear spin relaxation processes of the water protons. This perturbation leads to magnetic resonance contrast enhancement.
This goes from the use of matrixes with nanoscale order for the controlled release of bioactive molecules or tissue engineering, to the use of nanoscale fabrication and manipulation techniques to create more sensitive and far reaching diagnosis methods which by turn can enable concepts as the “lab-on-chip” and real time nanosensors.10
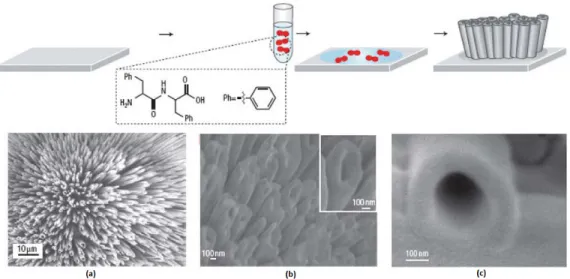
Bionanotechnology aims to impart new properties to materials from unique characteristics present in biomolecules. This includes the use of DNA oligomers, peptide nanotubes (Fig. 7)11, or protein fibrils for the fabrication of nanowires, interconnects and other
physical elements that can be used in molecular electronics or instead metal parts for their mechanical proprieties.10
5 Figure 7- Proposed model for the formation of aligned peptide nanotube arrays. Images of the vertically aligned peptide nanotubes: (a) Scanning electron micrograph; (b) Cold field-emission gun high-resolution scanning electron micrograph; (c) High-magnification micrograph of (b).
1.1.2- Bottom-up and bottom-down approaches
It has been demonstrated that multi-dimensional superlattices of nanoparticles (NPs) exhibit different proprieties from their individual elements.12 For example, it was reported that Ag
NPs organized in a two-dimensional hexagonal network, have their plasmon peak shifted towards higher wavelengths and an increase in the bandwidth is observed because the dielectric constant of the surrounding NPs is increased.12a Bearing this framework in mind and
the intention to any successful application, it becomes essential to find ways to secure the gathering of nanoparticles with controlled morphology in highly ordered nanostructures.
6 using lithography and microcontact printing where only the patterned areas with chemical functionalities create organized NP networks on substrates.12a
The term “self-assembly” has been overused as if any natural process or form of organization fits it, ranging from the non-covalent association of organic molecules in solution to the growth of semiconductor quantum-dots on solid substrate. In this dissertation the term self-assembly is considered as the autonomous organization of components into patterns or structures without human intervention being limited to processes that involve pre-existing components, being reversible, and able to control by proper design of the components.(Fig. 8)13
Figure 8- Self-assembly examples. A- peptide-amphiphile nanofibers. B- Micrometer-sized metallic polyhedral folded from planar substrates. C- Aggregate of three millimeter size, rotating, magnetized disks interacting with one another.
Self-assembly at molecular level involves weak interactions (van der Waals, electrostatic, hydrophobic interactions and hydrogen bonds)14
(Fig. 9)12a, but for meso- or macroscopic elements, interactions can include gravitational attraction, external electromagnetic fields, capillary and entropic interactions which are not relevant in the case of molecules. Non-covalent binding enables favorable free-energy changes as components equilibrate between aggregated and non-aggregated states or adjust their positions relative to one another once in an aggregate so the chosen substituents of the building components are a matter of concern.12a, 13
Figure 9- Example methods for NPs assembly on surfaces and interfaces: A- Cadmium sulfide NPs arranged as well defined rings in chemical lithography. B- DNA-templated 1D AuNPs. C- Shape- controlled assembly of truncated octahedral magnetite NPs. D- A colloidosome: NP assembly on the interface of an
emulsion droplet. E- Cross-linked cadmium selenide NP membranes at fluid/ fluid interfaces (confocal
7 The environment is crucial to the self-assembly since it can modify the interaction between the components and they need fluid phases or smooth surfaces to be mobile. Moreover, templates can reduce defects13and facilitate the creation of a core or scaffold that
can start oriented chain reactions of the components.14
Putting self-assembly apart, scanning probe microscopy (SPM) methods are also very effective for particle organization at nanoscale and, therefore, suitable for “bottom-up” manufacture but they are: not suitable for large-scale assembly, very time consuming and involve a costly equipment investment. In the present, research is focussed on generating simple nanostructures and exploring surface chemistry possibilities. Self-assembled monolayers (SAMs) (Fig. 10)12a are fairly studied (on gold and silicon oxide surfaces) but the goal is to reach
flexible and easy approaches able to create asymmetric and complex architectures from one or more types of nanostructures.
Figure 10- Self-assembled monolayer of thiols on a silica substrate, suitable for AuNP assembly.
1.2- Metallic nanoparticles
1.2.1- General mechanism for metallic nanoparticles formation
Finding new technologies recurring to NPs is highly dependent on the availability of synthetic methods capable of generating nearly monodisperse NPs in order to distinguish truly novel proprieties inherent to nanoscale structures from those associated with heterogeneities and polydispersity. Strictly, monodisperse particles are those indistinguishable from one another but in a more practical sense it can be used to refer do samples with standard deviations σ≤5%
in diameter.3
In spite of the application demands, key parameters usually also include adequate morphology, surface functionalization, size dispersion and high solubility in water.
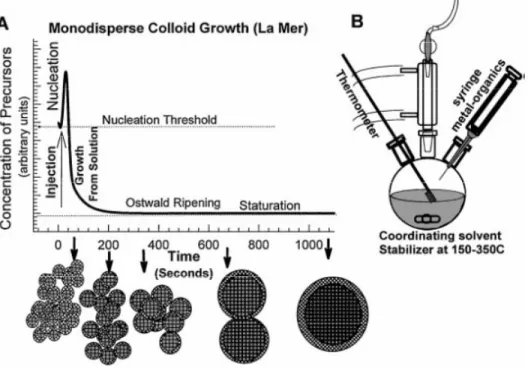
8 (Fig. 11A). A short nucleation burst partially relieves the supersaturation and can be accomplished by a rapid addition of reagents to the reaction vessel raising the precursor concentration above the nucleation threshold. The growth rate of all the NPs is similar, meaning their size distribution correlates to the nuclei initial size distribution. The nuclei initial size distribution is determined by the time over which the nuclei are formed.3
If the NPs growth during the nucleation period is smaller than the subsequent growth, NPs become more uniform over time and this phenomenon has been referred to as focusing of the size distribution. Another, yet longer, growth phase is often exhibited by NP synthesis methods, the Ostwald Ripening. While the high energy surface of the smaller NPs promotes their dissolution, larger NPs suffer material deposition. The outcome is a decreasing number of NPs with an average increasing size. Ostwald Ripening can be taken into account for the preparation of a size series of NPs: as the NPs growth goes on, periodic aliquots can be extracted from the reaction vessel, being obtained NPs with different sizes as illustrated in Figure 113.
Figure 11-(A) Stages of monodisperse colloid growth as described by Le Mer. (B) Schematic apparatus
employed in the synthesis of monodisperse NPs in the study of Le Mer nucleation model.
9 Figure 12- Turkevich´s nucleation-growth-agglomeration mechanism of metallic nanoparticles formation.
1.2.2- Metallic nanoparticles synthesis
Starting with M. Faraday´s (1857) chemical reduction of transition metal salts, the number of synthetics methods for the preparation of size series of monodisperse metallic colloids is surprisingly small in spite of having been studied for over a century3, 12a. Most of them
involve the aqueous reduction of metal salts (mainly Au or Ag) in the presence of citrate anions. According to Kimling et al., a size dispersion of just σ < 13-16% in diameter can be achieved
when AuNP´s (gold nanoparticles) diameter is inferior to 40 nm16 but in general metallic
nanoparticles (MNPs) can be obtained with distributions of 10 < σ < 15% in diameter (even so
they are usually presented as monodisperse) and then narrowed to 5% through size-selective processing.17 Other methods include the pioneering two-phase liquid-liquid reduction as
described by Brust et al.17 enabling the generation of stable AuNP self-assembled monolayers18; the inverse micelle method19 and higher temperature reduction of metal salts in the presence of stabilizing agents to generate monodisperse transition metal NPs (e.g. Co and Ni).3, 20 Monodisperse bimetallic NPs synthetic methods have achieved some progress and for
that matter the work of Bradley and co-workers is a relevant example.3
AuNPs synthesis described methods are mostly based on a chemical or electrochemical reduction of a gold precursor compound in the presence of a capping agent. In the case of a chemical reduction, the reduction and the capping functions can be assured by the same agent. A capping agent is a broad term used to describe a compound that covers a nanoparticle´s surface.
Among the several described methods for the preparation of AuNPs, a frequent reducing agent arises which is citrate.3 This is due to:
1- Citrate has a strong affinity for gold17 leading to lower size dispersion colloids.12a
2- Working pH enables citrate to be negatively charged (-3 at pH 7, pka3= 6,3921)
10 3- Negatively charged, can work as a linker by providing binding through electrostatic interactions.
4- Capping agents enabling solubility only in organic solvents, prevent interaction between the NPs and most biological targets presents in aqueous media.19
In general terms, the preparation of spherical size defined AuNPs is accomplished by: gold (III) salt reduction by citrate at 100 ºC; preparation in citrate at 25 ºC after UV irradiation, and particles prepared in an ascorbate solution at 25 ºC.22
Besides the reduction agent used, other parameters that must be considerate to ensure the size and mprphology outcome, including the reaction time and the medium temperature.
The first method, used to produce the nanoparticles utilized in this work, is known by the name of the researcher who described it, Turkevich15, and has been modified and optimized
over time.22 This is a simple, well characterized, reproducible, size tunable and very common method for the aqueous synthesis of spherical fairly monodisperse nanoparticles with high yield (Fig. 13)16. Starting from a gold salt, usually HAuCl
4 (chloroauric acid), its oxidation from Au3+
(auric) to Au0 (atomic gold) in aqueous solution is accomplished in the presence of sodium citrate (detailed protocol described in the Materials and methods chapter).16, 22
The proposed chemical reaction is a multi-step process15:
1- citrate oxidation C6H6O7 C5H4O5 + CO2 + 2H+ + 2e
-2- auric salt reduction AuCl3 + 2e- AuCl + 2Cl
-3- gold species 3AuCl 2Auo + AuCl3
dismutation and atomic gold production
Which is represented by the global reaction:
2 HAuCl4 + 3C6H6O7 2Auo + 3C5H4O5 + 6Cl
+ 8H+ + 3CO2
11 1.2.3- Capping agents
The most promising technological applications for MNPs appear to concern bioanalytical and biomedical problems thereby promoting stability, solubility in aqueous media and controllable surface chemical reactivity to key features.23 An easy strategy to accomplish these, is by using thiol ligands with hydrophilic end groups.
As mentioned before, a capping agent is a compound that binds to a nanoparticle covering its surface. This compound is critical to avoid the NP growth beyond the nanometer range, to stabilize the colloid in the solvent and can additionally bestow a functional group useful to bind some molecule of interest later.3 If the capping agent binds the molecule of interest to the NP, it is adding up the linker function, thus dismissing the use of another compound to play the task.
The surface derivatization of an arbitrary NP, featured by the synthesis capping agent, can be modified by ligand exchange. This may be accomplished by the exposure of the NPs to an excess of a competing capping agent. The previous capping group can them be sequestrated or the partially exchanged NPs isolated by precipitation and re-exposed to the new ligand again in successive cycles to maximize the exchange.3, 24 This is the principle followed in this dissertation´s experimental work to generate AuNPs with MUA (11-mercapto-1-undecanoic acid) capping (Fig. 14), starting from the synthetic citrate capped AuNPs.
Figure 14- Representation of a MUA capped NP. Not at scale: MUA´s length is at least 4 times smaller than the smallest NPs prepared by common methods.
12 MNPs production has to take into account that avoidance of aggregation is required to ensure their storage and some applications such as SAM production or functionalization for further use. Aggregation is usually undesirable still, it is the functional principle behind some types of bionanoprobes for rapid diagnostic.26 MNP´s plasmonic is sensitive to the refractive
index of the vicinity of the surface and as a result a color change occurs if MNP aggregates are formed. Strong aggregation can be noticed with the naked eye by a change to a blue colour, but UV-Vis (ultraviolet-visible) spectroscopy is a more appropriate method to assess its magnitude. The occurrence of this phenomenon causes the AuNPs plasmonic to become wider and to shift to higher wavelengths (Fig.15).16
Figure 15- Extinction spectra of AuNPs solutions prepared by the Turkevich method with constant Au concentration, showing shifted SPR due to a successive size increase. (Size increase order: red, black, green, blue.) According to Kimling et al., the diameter of the citrate prepared AuNPs is a function of the maximum wavelength of the plasmonic.
1.2.4- Proprieties of Metallic Nanoparticles
In the past fifteen years noble metal nanoparticles have been studied intensively unveiling interesting proprieties and applications, mainly for silver and gold nanoparticles.
13 Entering the nanoscale domain, the optical proprieties of the metallic nanoparticles are remarkably different for two reasons: the energy levels gap´s become wider and superficial plasmonic resonance (or surface plasmonic resonance) become a significant phenomenon.22, 27
The mass, and therefore the size, enables the wider energy levels that the electrons can undergo which explains the intense red colour of the AuNPs solutions and its deviations in the UV-Vis spectrum according to diameter: the smaller the particle, the bigger the energy oscillation implying a shift of the plasmonic to smaller wavelengths.16
The surface plasmonic resonance (SPR) occurs when the size of the metallic nanocrystal is inferior to the incident radiation wavelength. SPR is often referred as LSPR (localized surface plasmonic resonance) as it is a localized phenomenon. SPR is originated as follows (Fig.16)27. The electric field of an incident electromagnetic wave induces the polarization of the free electrons relative to the ionic nuclei with much higher mass. The difference in global charge is much more intense at the crystal surface and produces the oscillation of the electrons at a certain frequency. To sum up, the free electrons in the conduction band suffer an in phase oscillation with the incident electric field.27 This electronic collective movement excitation is called plasmon.
Figure 16- Surface plasmonic effect in a spherical nanoparticle.
SPR depends on the nearby dielectric surroundings and on the free electron density of the particle. The plasmon frequency depends on the metal dielectric function and on the shape of the nanoparticle (NP) and is responsible for the creation of an adimensional electric field with equal frequency at the particle´s surface.27 Furthermore, small changes in the plasmonic can occur due to refraction index of the solvent.
In fact, the most prominent propriety of metallic nanoparticles is their intense and well defined Ultraviolet-Visible (UV-Vis) spectrum which reflects the size, nature and shape of the nanoparticles in solution.22
14 evidence of associated toxicity.29 Depending on the capping/ functionalization, applications in
bioreactors30, biosensors12a, 30, bionanoprobes for quantification and clinic diagnostic12a, nanoelectronics12a, materials for affinity chromatography separation, and controlled pharmaceutics deliver can be met22.
1.3- Bionanoconjugates
This dissertation aims to study and apply the advantages of bionanoconjugates (BNCs) in a phenol remediation system. Therefore, BNCs must be obtained, compared to the non-conjugated enzyme and, at last, incorporated in a remediation system.
Having monodisperse NPs with the desired capping will usually mean they are stable and therefore reaction controlled and limited. Their usage is thus closely linked to other molecules that can be “added” to the NP for the application sought (such as tyrosinases in this work). Besides the linkage capability, the capping agent specifies the type of interaction that will be set with the intended molecules (e.g. proteins, antibodies): it can be chosen to enable the adequate conjugation to a compound that will bestow its function to the assembly. This whole assembly of a nanoparticle linked to specified molecules is referred as nanoconjugate and as bionanoconjugate if the linked molecules are biological.
Covalent interactions (in opposition to electrostatic interactions for instance) enable greater stability of the BNCs, but that can also imply more tension and less stereoliberty of the BNC and the active biomolecule. Namely, in the case of linked proteins, conformational changes can occur deriving in denaturation, loss/ gain of substrate specificity, increase/ decrease of activity.31 In some situations stronger binding may be desirable which tends to
ensure longer lifetime of the BNC and higher specificity to a certain substrate, but in general non-covalent binding is preferable, as it interferes less with the native structure of proteins.
In this dissertation it is studied the system composed for AuNP-MUA bound to two different tyrosinases (functional molecules).12a, 31
1.4- Tyrosinases
1.4.1- Tyrosinases- General considerations
Tyrosinases are part of the polyphenol oxidases (PPOs) enzymatic family, and are classified as monophenol, o-diphenol:oxygen oxidoreductase EC 1.14.18.1.32 These enzymes are widely distributed in nature (mammals, plants, bacteria, fungi) and play an essential role in melanin biosynthesis.(Fig.17)33 In fact, they catalyze both the o-hydroxylation of monophenols
15 activity).34 In aqueous solution, o-quinones are unstable and deteriorate over a period of
minutes to hours by a combination of nucleophilic reactions and further oxygen mediated oxidations, not all of which are understood.35
Melanin pigments are polyphenolic polymers ubiquitous in living organisms: in mammals they are responsible for skin, eye and hair pigmentation conferring protection by absorbing UV radiation33a, 36; in invertebrates tyrosinase interfaces with defense reactions and sclerotization37; in microorganisms it has been proposed that melanin has a role in the formation
of reproductive organs, spore formation, the virulence of pathogenic, and the tissue protection after damage34a; in plants tyrosinases assist the regulation of the oxidation-reduction potential
and the wound healing system.32b
Figure 17- Melanin biosynthesis starting from the natural substrate, tyrosine. Dopaquinone is converted by the TYR to L-DOPA (which can also be the starting substrate) and dopachrome through auto-oxidation. TYR- tyrosine IQ- indole-5,6-quinone; L-DOPA (L-3,4-dihydroxyphenylalanine); DHI- dihydroxyindole; DHICA- dihydroxyindole-2-carboxylic acid; ICAQ- indole-2-carboxylic acid-5,6-quinone; HBTA- 5-hydroxy-1,4-benzothiazinylalanine
The browning phenomenon in fruit and fungi that occurs after tissues injuries or harvest is also usually related to oxidative polymerization, similar to melanogenesis.33a This is an
undesirable phenomenon in fresh fruits, beverages, vegetables and mushrooms which decreases the commercial value of the products and compels research to comprehend the role of tyrosinases in biological metabolism.32b, 33a
16 and low-fat food and tailoring polymers in material science (grafting of silk proteins onto chitosan38) have been reported.32b, 33b
Besides PPOs, also peroxidases (EC 1.11.7.1) are known for oxidize polyphenols, however they are highly dependent on the use of hydrogen peroxide as oxygen donor and are unable to function in the presence of catalase.32a
Tyrosinases are cytosolic enzymes that are often partially bound to organelles or membranar structures such as: thylakoids of the chloroplasts mainly in higher plants and melanosome in mammalians.39 Gross tyrosinase extracts such as those used in this dissertation have a fair amount of issues that should be mentioned. They contain endogenous phenolic substrates already oxidized which can inhibit protein activity or lead to enzymatic artifacts, and raise the initial absorbance when colourimetrics assays are performed. The removal of these phenols by ion exchange resins usually result in an accentuated activity decline as result of the loss of some isoforms and co-factors. Another issue is the reproducibility of the activity of PPOs extracts due to variations in the development phase in which the mushroom is harvested and due to which tissue was used.32a
1.4.2- Structure of Tyrosinases
From both structural and functional point of view, the most studied tyrosinases are those from Streptomyces glausescens33a, Neurospora crassa34b and from Agaricus bisporus.32a Agaricus bisporus is a champignon mushroom and the tyrosinase extracted from this source is commercially available (the lyophilized extract can be used without further treatment) and is highly homologous with the mammalian ones. As a result, this tyrosinase has been used in almost all studies on tyrosinase inhibition and is well suited for studies on melanogenesis.33a
Astonishingly, considering the numerous studies based on it, only recently (2011) became available the crystallography structure for this protein (Fig.18).40
Sequence comparison of tyrosinases has demonstrated that exists a high heterogeneity concerning length and identity, but also that all tyrosinases have highly conserved regions at the active site.32b Tyrosinases are characterized by Type III copper centres (T3Cu) which consist of a pair cooper ions (Fig. 19)39, 41 within a domain containing strictly conserved aminoacid
residues33a, 42 (each copper is coordinated by three histidine residues).32b
17 Figure 18- Top (A) and side (B) views of the Agaricus bisporus tyrosinase structure. The H2L2 tetramer
structure was obtained by x-ray crystallography (2,6 Å resolution). H-L dimer interactions are between H1 (green) and L1 (cyan), and H2 (red) and L2 (magenta).
Brown spheres- cooper ions;
exogenous compounds: Black spheres- holmium ions; Yellow sticks- tropolone molecule in the active site
Comparative and complementary information can be obtained through the Streptomyces castaneoglobisporus tyrosinase structure obtained by Motoba et al.
The tyrosinase from Agaricus bisporus (AbT) usually presents as a tetrameric globular protein with a molecular mass of 120 kDa composed of two subunits of ~43 kDa (H subunit) and two subunits of ~14 kDa (L subunit).32a, 40 This is atypical among other PPOs that only present a
monomeric subunit similar to the H subunit mentioned. The monomeric tyrosinase (43 kDa) isolated from mushroom fruit bodies is active,40and the T3Cu centres solely appearance in the H-alike subunits regard this as the functional part, which define a tyrosinase. The function and origin of the L subunit is yet unknown.40
18 Agaricus bisporus copper mass represents 0.2% of its total mass, present in the H subunits. Copper is strongly bound and only dialysis against strong complexing agents (such as HCN) can remove it.
Besides the AbT a recently produced and promising32b tyrosinase was also studied in this dissertation. The tyrosinase from Trichoderma reesei (TrT), was recently (2006) overexpressed under a strong promoter in the native host and it is secreted into the culture supernatant. Until now, all plant, animal and fungal tyrosinases studied had intracellular origin, so the reported TrT expression is a new achievement within this enzyme class.44 TrT was
obtained much purer than AbT (close to 100% purity)45, available in Tris-HCl buffer pH 7.5
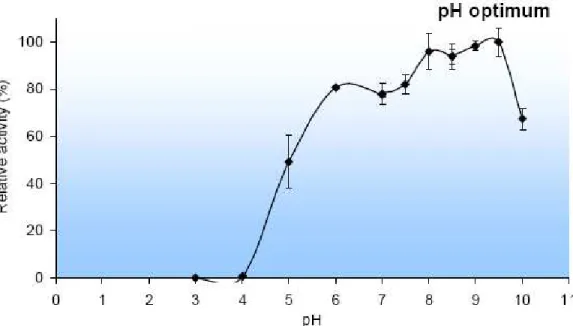
concentrated solutions from VTT, Finland. Its molecular mass is 43.2 kDa, but no structure is yet available and it revealed to have more activity and stability within a neutral and alkaline pH range, being greater at pH 944 (Fig. 2045).
Figure 20- TrT activity on 15 mM L-dopa 300 - 400 nkat/mg (depending on the enzyme formula and preparation), Tris-HCl buffer pH 7.5.
19 Figure 21- Reaction rate at different tyrosine concentrations for AbT (black squares) and TrT (white
circles).
1.4.3- Activity of Tyrosinases
The cresolase activity is the rate-limiting reaction (can be until 40 times slower than catecholase32a) in melanin synthesis (Fig. 22)46 and this makes biological sense because the
outcome of the reaction can proceed the pathway spontaneously at physiological pH value.33a In both cresolase and catecholase activities an oxygen atom from a dioxygen molecule is incorporated in the substrate while the other atom is reduced to water by a co-substrate (monophenol or similar molecule).32b There are also broad substrate specificities for both activities, but the enzyme has more affinity for L-isomers than for the corresponding D– isomers.33a The main endogenous substrates are L-tyrosine,
γ-glutaminyl-4-hydroxybenzen (GHB), and aminephenol39. In the case of phenol as substrate it can be converted directly to o -quinones by an undetermined process or can be processed trough cresolase and catecholase activities.47
The study of tyrosinase kinetics is usually assessed by Michaelis-Menten parameters (Fig. 22). Mainly because, experimental points have shown to fit Michaelis-Menten kinetics and its parameters have proven to be very sensitive to the nature of the substituents present on the aromatic rings.35 When cresolase activity is much slower than catecholase (as in the tyrosinases studied in this dissertation), the first reaction has a major weight in the kinetic parameters (Vmax
e KM) and, all together, tyrosinase´s global activity can be considered a classic two-substrates
20 Figure 22- Typical Michaelis-Menten kinetic curve: initial velocity (V0) vs. substrate concentration ([S]).
Vmax- maximum reaction rate
Km- Michaelis constant
The cresolase activity is characterized by an initial lag phase followed by a linear phase, so the observed Michaelis-Menten curve resembles a sigmoid. The lag phase can vary between one minute to two hours and is dependent on the concentration and nature of the enzyme, substrate and co-substrate concentrations33a, 46 and oxygen. Being well suited for the free
enzyme, these parameters are appropriated to compare its performance with the immobilized and conjugated forms, namely using chitosan and gold BNCs respectively. This assessment was not performed in this work, although it is a practical and moderately fast way to evaluate losses/ gains caused by immobilization and BNC.
AbT and TrT have been comparatively studied under the Vmax and Km parameters to a
variety of substrates and it was concluded that Km values were approximately ten times lower for
AbT than for TrT (the lower the Km, the bigger substrate affinity it suggests), while for the Vmax
parameter was found a high dependence on the substrate used.48 However, two remarks
21
1.5- Bioremediation
1.5.1- Bioremediation concept
According to the United States EPA (Environmental Protection Agency), bioremediation consists in the use of living organisms to clean up oil spills or remove other pollutants from soil, water or wastewater; use of organisms such as non-harmful insects to remove agricultural pests or counteract diseases of trees, plants and garden soil.49 This definition can be expanded
beyond whole living organisms and resumed as being the application of biological processes for the treatment of hazardous chemicals present in the environment.50 The treatment aims to transforms the hazardous compounds to an innocuous form or to degrade them to below the established concentration limit.
Bioremediation can be complemented with physical, chemical or mechanical methods but, alone, it presents the advantage of not generating toxic side products. Enzymatic bioremediation also enables enzyme in situ digestion by indigenous microorganisms after the treatment; enzymes can be produced at a higher scale than whole microorganisms, with enhanced stability and/or activity and at a lower cost by using recombinant-DNA technology, but it has some drawbacks such as the exposure to high stress and lack of cofactors outside a cell.
Enzymatic bioremediation can be explored simply by searching for a microorganism capable of feeding on a particular pollutant, identifying the enzyme responsible for the transformation and then improving it to sustain operating conditions.51
1.5.2- Phenol remediation
Aromatic compounds, including phenols and aromatic amines, are a major class of pollutants worldwide and many are classified as priority pollutants by the United States EPA52
and the European Union53 and subject to specific legislation. They are found in wastewaters of a large number of industries such as coal conversion, petroleum refining, resins and plastics, wood preservation, dyes, metal coating, chemicals, synthetic fibers, mining and paper pulp.54
Aromatic compounds are persistent and associated with toxic effects55 and, as result, wastewaters must be treated to decrease these compounds to a level suitable for discharging. Another, sometimes unsuspected, source of these compounds is the introduction of xenobiotics through agriculture promoting the contamination of underground water and household medication which end up in the sewers. To accomplish the legislation of each country, the methods synthesized below have received the most attention.
22 which can be removed by sedimentation after a coagulation step.56 This approach has the
prohibitive cost of the enzyme and the hydrogen peroxide as downside.57
2- Tyrosinases catalyze the oxidation of phenols to o-quinones using molecular oxygen as electron acceptor. This enzyme is widely available in nature and has a cost comparable to the peroxidases. It has been reported to have more than 50% of optimum activity at pH 5-8 with a maximum at pH 7, and instability under acidic conditions at elevated temperatures.57
3- Photocatalytic degradation of phenol in the presence of semiconductor oxide catalysts (ZnO and TiO2 for instance) using high potency UV irradiation.58 This process
mineralizes organic compounds into CO2 but it is very time consuming, lacks selectivity for
aromatic compounds (much less for phenol) and many variables (e.g. scale-up and degradation yield vs. light-wavelength/potency) are yet to be studied.
4- Activated charcoal has affinity for non or weekly polar compounds and can be regenerated by heat. Its high porosity confers a wide internal surface, also meaning high absorption capacity. It is considered a cheap and undemanding method.
Lately, enzymatic methods have received most attention because they require low retention times comparing to others. Conventional methods fall short of achieving the required degree of removal of these pollutants while enzymes can target specific pollutants even if diluted are becoming cheaper and customizable (by genetic engineering), and they are less likely to be inhibited by substances toxic to living organisms performing the same remediation.54bA promising feature of enzymatic systems is the possibility to combine pollutant quantification with pollutant degradation. This approach is called sense-and-shoot and nanotechnology plays an essential role in it.59 AuNPs particularly, provide a stable surface for
enzymatic immobilization and can act as nanoscale electrodes interchanging electrons between the enzymes and the electrode material (Fig. 23)60. This is expected to increase the detection limit (especially important for endocrine disruptors61) owing to a bigger responsive area in the
sensor; and, by modulating the current in the electrode, to improve the enzymatic activity without the need of external electron-transfer mediators.60, 62
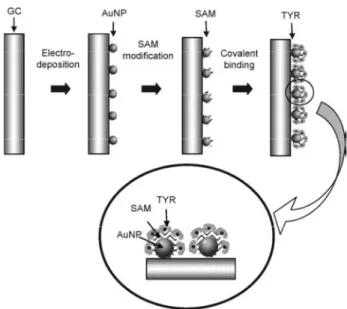
23 Figure 23- Glassy carbon- Gold nanoparticle-Tyrosinase (GC-AuNP-TYR) electrode approach for biosensing.
1.6- Phenol detection
1.6.1- Analytical methods
Accurate and highly sensitive detection of phenols is important to assess the quality of the available water sources and to ensure trustworthy investigation towards them.
Complex matrixes limit the analytical methods prone to be applied in practical situations. The elements of a matrix have very specific proprieties by their own but they are not necessarily known nor quantified by the operator, therefore the convenience of calling it “complex” in the situations where this happens. Not knowing sufficiently the composition of a matrix adds up the problem of the interaction within its elements because mutual inertness cannot be ensured. Assuming a global equilibrium is met; the physic-chemical processes can potentially be translated in a change of density and viscosity, and origin phases, emulsions and solid suspensions, in fluids. These factors are important for the selection of the analytical method/ necessity of a pre-treatment but, more importantly, the matrix elements themselves may mask the analytes detection.
Phenol contaminated wastewaters are complex matrixes rich in solvents and industrial sub-products and so, quantification analysis must attend to it. A simple way to contemplate the matrix influence in an analytical process is to complete it with the standard addition method. Considering now the simplest reaction mixtures obtained from TYR (tyrosinase) activity, they generate a panoply of unstable (short aqueous life-times) aromatic compounds (mainly quinones) that enter in a mutual equilibrium41 (in Fig. 13 only the most representative and stable
24 also be expected to already contain peptides, inactive proteins, cellular residues and various phenolic compounds.32a Because products are not stable and because an unique product cannot be singled out, the reaction rate assessment is more accurate by detecting the latent substrate.
Most available methods (gas/liquid chromatography, spectrophotometry) required demanding sample treatments and their operation is very time-consuming.59 Advances in the technology of amperometric tyrosinase-based biosensors proved them to be very simple, highly sensitive and effective for phenol assay. Regardless of all these potential advantages, many of them still are at the “proof-of-concept” phase and it can be pointed out that the measured signal is greatly susceptible to the matrix complexity and the molecular targeting is a major concern.60 63
To predict the efficiency of any remediation system using tyrosinases, it is important to study their kinetic proprieties. These proprieties are commonly evaluated by four methods: colorimetry; oxygen electrode; oxygen manometer and radiochemical liberation of 3H from a L-[2,6-3H]monophenol used as substrate.32a Oxygen measurements lack precision because products are easily oxidized and recycled multiple times using molecular oxygen cost. Colorimetry is the simplest method and it is very effective if the enzymatic extract is free from other oxidizing enzymes. The TYR´s activity can be measured at 280 nm (ε280= 1440 M-1cm-1)35
because the oxidation to L-DOPA contributes the most to absorption variations in this wavelength, however many other aromatic compounds absorb in this region and so a better alternative is to follow the formation of the final reaction product (o-quinones). To accomplish it, an indirect way is used consisting in reading the formation of the main product of the side reactions, the dopachrome, at 475 nm (ε475= 3600 M-1cm-1).41 For environmental legislation
purposes, there are standard procedures described to quantify trace (<100 ppm)64 and ultratrace (<1 ppb)64b levels of phenol that often occur.65 They typically comprehend a sample
extraction step by liquid-liquid extraction or evaporation of the extract to isolate and concentrate the analyte followed by GC/MS (Gas chromatography/mass spectrometry), GC (Gas chromatography) with electron capture detection in a dual-column set-up, or HPLC-UV analysis55, 66 The analysis using GC with sample detector is amenable as well.67
To favor the rate measurement exactitude, o-quinones can be recycled back to o -diphenol by an UV-absorbing reducing agent (ascorbate or NADH for instance) and the consumption of this agent monitored. Another process involves the formation of stable adducts which appearance can also be followed by colorimetry.32a Either way, none of these reactants could be used in this dissertation work because they would have an aggregation effect over the AuNPs/BNCs.
25 remediation because chitosan (Fig. 24) is a natural polymer derived from chitin (via deacetylation with alkalis) know for its nontoxicity and biocompability68but more work needs to be done concerning its inhibition preventing role.
Figure 24-Molecular structure of chitosan.
Sample preparation- SPME
Brute matrixes analysis often generates interferences and incompatibilities in the analytical equipments. To avoid these problems and to seek analyte isolation and concentration, sample preparation methods are chosen according to the analytic technique to be used.
Solid-phase microextraction (SPME) is a technique developed in 1990 that suits well gas chromatography demands, mainly because it has a high concentration potential adequate for GC detectors sensitivity, facilitates the transportation of the extracted material to the chromatographer and avoids the introduction of non-soluble particles from the matrix in the GC column.54b, 69 It is a rapid and solvent free extraction alternative technique used in
environmental, food and drug abuse fields nowadays.54b SPME equipment is based on a silica
baton with a 10 mm ending covered with a thin polymer film [e.g. polydimethilsyloxane (PDMS), polyacrylate (PA) or Carbowax (Cwx)] or with an adsorbent solid (e.g. activated charcoal).69(Fig.
25) The sample preparation by SPME is simple, reproducible as long as the adsorbent is consistently treated the same way, and fits general purpose analysis with few adjustments. Due to all the above mentioned, SPME is appropriated for this dissertation objectives.
26 Figure25- SPME typical sampler, extraction (1-3) and injection (4-6) stances. At 2nd and 4th frames, the extracting fiber is exposed from the needle to the sample and to the injector respectively.
In SPME the molecules in the matrix of the sample have to migrate and penetrate the coating adsorbent material which means that mass transfer and kinetic resistivity are important factors to the time required until partition equilibrium is achieved between the sample matrix and the solid-phase coating.67, 69 To reduce migration time and promote effective adsorption
impacts, matrix agitation is crucial.(Fig. 26)