Dissertation
Master in Civil Engineering – Building Construction
Analysis of reinforced concrete elements exposed to
fire after earthquake
Hugo Manuel Mendes Vitorino
Dissertation
Master in Civil Engineering – Building Construction
Analysis of reinforced concrete elements exposed to
fire after earthquake
Hugo Manuel Mendes Vitorino
Dissertation developed under the supervision of Doctor Hugo Filipe Pinheiro Rodrigues, professor at the School of Technology and Management of the Polytechnic Institute of Leiria and co-supervision of Doctor Carlos André Soares Couto, Post-doctoral Researcher at Aveiro University.
ii
iii
Dedication
iv
v
Acknowledgements
I want to express my deepest gratitude and appreciation to the Doctor Hugo Rodrigues for all the advice, help and teachings that made the development of this dissertation possible.
I will also want to express my gratitude and appreciation to Doctor Carlos Couto for all the explanations and clarifications regarding the numerical analysis and for the availability to help run the numerical simulations.
I am also grateful to Doctor Paulo Vila Real, for providing the access to the software SAFIR at the Aveiro University.
Lastly, I would like to thank my family, specially my grandfather, parents and brother for all the support throughout my life; without them it was not possible to develop this work.
vi
vii
Resumo
Os Sismos podem provocar uma cadeia de eventos, sendo que um deles pode ser a ocorrência de um incêndio. Os efeitos do incêndio após um sismo em áreas urbanas podem ser mais severos que os efeitos diretos do próprio sismo. Os edifícios podem não estar adequadamente dimensionados para a ação de incêndio após um sismo visto que a maioria dos regulamentos ignora essa possibilidade. O objetivo deste trabalho é perceber as consequências que o dano introduzido pela ação sísmica pode causar na resistência ao fogo em vários elementos de betão armado. Foram desenvolvidas várias análises numéricas com o programa SAFIR, considerando a análise térmica e mecânica da estrutura, tanto ao nível da secção como em elementos isolados (pilares, vigas e pórticos). As principais variáveis nas análises foram o tipo de dano nos elementos. As análises numéricas foram realizadas usando a curva de incêndio padrão ISO 834. Os resultados mostram que o dano nos elementos de betão armado reduz a resistência ao fogo, especialmente quando as armaduras ficam expostas ao fogo. Após um sismo, e dado o elevado número de ocorrências, as equipas de socorro vão ser muito solicitadas, pelo que os tempos de resposta serão consequente mais elevados. Esta situação associada a uma redução na resistência ao fogo dos elementos de betão armado pode originar a perda de vidas e o colapso de estruturas. Assim, é importante uma melhor compreensão sobre o comportamento em incêndio após um sismo, em particular em estruturas de maior importância, para que seja possível implementar algumas medidas prescritivas que possam garantir melhor desempenho das estruturas nestas circunstâncias.
Palavras-chave: Fogo após um sismo, Segurança Contra Incêndio, Resistência ao
Fogo, Estruturas de Betão Armado, Métodos Avançados de Cálculo, Elementos Finitos.
viii
ix
Abstract
Large earthquakes can cause a chain of catastrophic events, one of which can be fire after earthquake. The effects of fire after earthquake on urban areas can be even worse than the effects of the earthquake itself. Buildings are not adequately designed for fire after an earthquake since most standards ignore that possibility. The aim of the work is to better understand the consequences of the damage introduced by the seismic action on the fire resistance of several reinforced concrete elements. Several numerical analyses were performed using the SAFIR program, considering the thermal and mechanical analysis of the structure, both at section level and in structural elements (columns, beams and frames). The main variables in the analysis were the type of damage in the elements. The numerical analysis was performed using the standard fire curve ISO 834. The results show that damage to reinforced concrete structures reduces the fire resistance, especially if the cover of the elements is removed and the reinforcement is exposed to fire. After an earthquake, and given the high number of occurrences, the rescue teams will very solicitated, so the response times will consequently be higher. This situation together with the reduced fire resistance of the damaged reinforced concrete elements can lead to the loss of lives and structures. Thus, a better understanding of fire behaviour following an earthquake, particularly in major structures, is important so that it is possible to implement some prescriptive measures that can ensure better performance of structures in the circumstances.
Keywords: Fire after earthquake, Fire Safety, Fire Resistance, Reinforced Concrete
x
xi
List of figures
Chapter 2
Figure 2.1 – Involuntary creation of a leaked floor. a) Situation at the beginning of the earthquake. b) Situation after the collapse of the masonry walls in the ground floor.xxi
Figure 2.2 – Damage to reinforced concrete buildings with masonry walls [3]. ...6
Figure 2.3 – Damage at the beam-column joints. [2][4] ...7
Figure 2.4 – Poor detailing of the reinforcing steel [2]. ...8
Figure 2.5 – Fire tetrahedron. ...9
Figure 2.6 – Temperature-time curve for fully developed fire [6]...9
Figure 2.7 – Time temperature curves for post-flashover fires. ...12
Figure 2.8 – Fire spalling of the external wall [12]. ...15
Figure 2.9 – Fire spalling in the roof [12]. ...16
Figure 2.10 – Cutaway view of horizontal valve in normal operation [15]. ...18
Figure 2.11 – Cutaway view of horizontal valve after an earthquake [15]. ...19
Chapter 3 Figure 3.1 –Total thermal elongation of concrete [30]. ...24
Figure 3.2 – Specific heat, as function of temperature at 3 different moisture contents [30]. ...25
Figure 3.3 – Thermal conductivity of concrete, (1) upper limit, (2) lower limit [30]...26
Figure 3.4 – Thermal elongation of carbon steel as function of the temperature [30] [31]. 28 Figure 3.5 – Specific heat of carbon steel as a function of the temperature [31]. ...29
Figure 3.6 – Thermal conductivity of carbon steel as a function of the temperature [31]. .30 Figure 3.7 – Mathematical model for stress-strain relationships of concrete under compression at elevated temperatures [30]. ...31
Figure 3.8 – Coefficient kc,t(θ) allowing for decrease of tensile strength (fck,t) of concrete at elevated temperatures [30]. ...32
Figure 3.9 – Stress-strain relationship for carbon steel at elevated temperatures [30] [31]. ...33
xii
Chapter 6
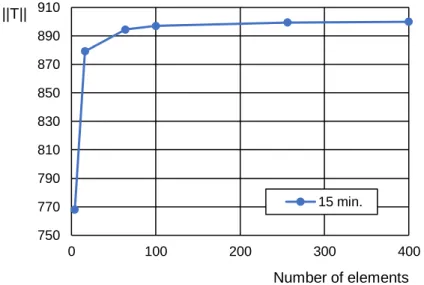
Figure 6.1 –Simplification of the section. a) Entire section. b) One fourth of the section. .45 Figure 6.2 –Mesh 1, location of the points being analysed and fire frontiers. ...46 Figure 6.3 –Mesh 1 to 6. ...47 Figure 6.4 – Root sum of squares of the temperatures in the different meshes for different
times. ...49 Figure 6.5 – Root sum of squares of the temperatures in the different meshes at 15
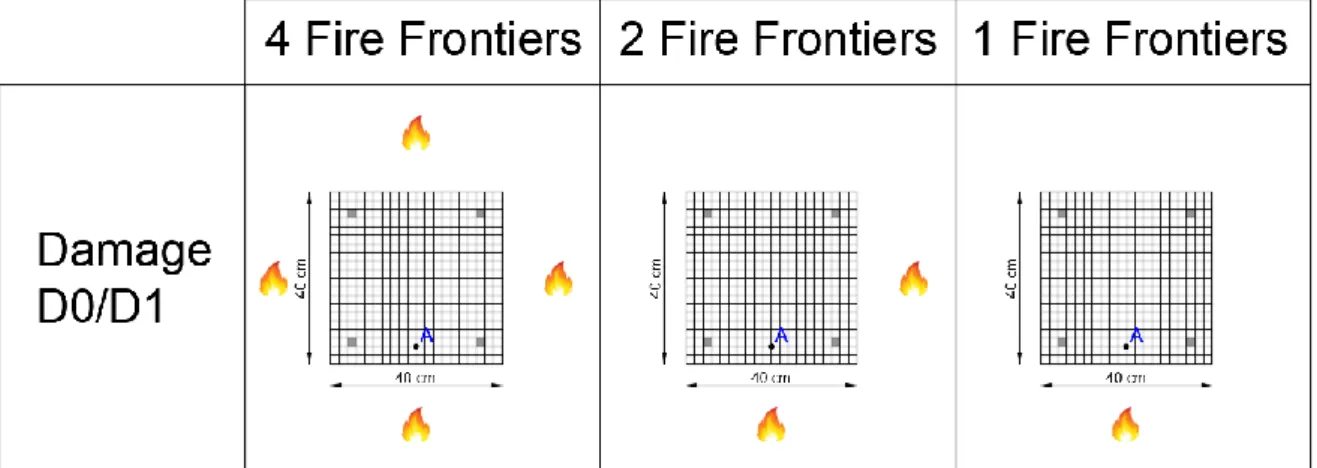
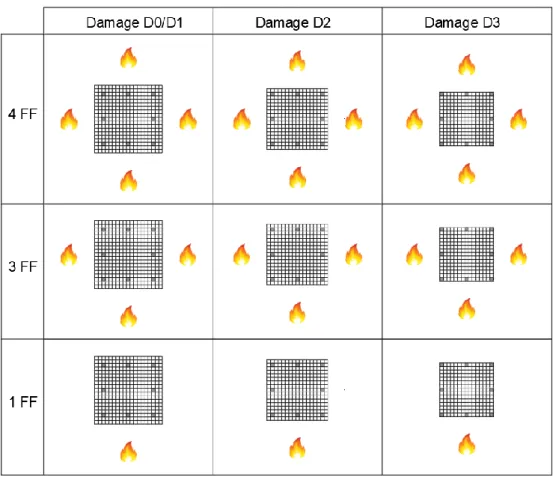
minutes. ...49 Figure 6.6 –Fire frontiers configuration in columns. ...51 Figure 6.7 –Numerical models with damage D0/D1 for 4, 2 and 1 fire frontiers. ...52 Figure 6.8 –Reduction factors evolution for a section with damage D0/D1 with 4, 2 and 1
fire frontiers ...52 Figure 6.9 – Numerical models with damage D2 for 4, 2 and 1 fire frontiers...53 Figure 6.10 –Reduction factors evolution for a section with damage D2 with 4, 2 and 1 fire frontiers ...53 Figure 6.11 –Numerical models with damage D3 for 4, 2 and 1 fire frontiers. ...54 Figure 6.12 –Reduction factors evolution for a section with damage D2 with 4, 2 and 1 fire
frontiers ...54 Chapter 7
Figure 7.1 – Column with fixed support: a) Column length and load applied; b)
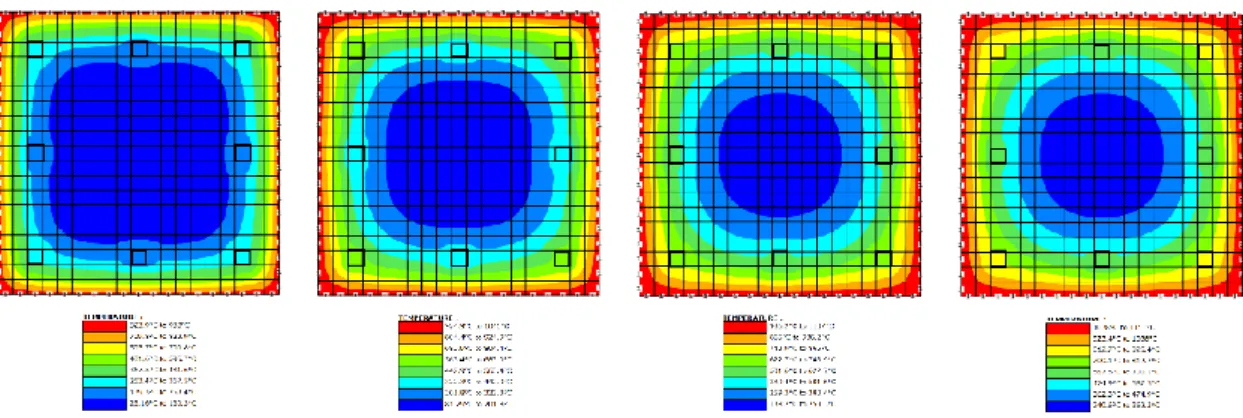
Characterization of the finite element mesh. ...55 Figure 7.2 –Column section. ...56 Figure 7.3 –Numerical models for damage D0/D1, D2 and D3 with four, three and one fire frontiers. ...57 Figure 7.4 – Temperature evolution in the columns corner reinforcing steel bars. ...60 Figure 7.5 –Temperature evolution in the columns middle reinforcing steel bars. ...60 Figure 7.6 –Temperature profiles of beam with damage D0/D1 at 60, 120, 180 and 240
minutes (left to right)...61 Figure 7.7 –Temperature profiles of beam with damage D2 at 60, 120, 180 and 240
minutes (left to right)...61 Figure 7.8 –Temperature profiles of beam with damage D3 at 60, 120, 180 and 240
minutes (left to right)...61 Figure 7.9 –Temperature profiles of column with damage D0/D1 at 60, 120, 180 and 240
xiii
Figure 7.10 –Temperature profiles of column with damage D2 at 60, 120, 180 and 240
minutes (left to right)...62
Figure 7.11 –Temperature profiles of column with damage D3 at 60, 120, 180 and 240 minutes (left to right)...63
Figure 7.12 –Temperature evolution in the columns reinforcing steel bars. ...63
Figure 7.13 –Temperature evolution in the columns reinforcing steel bars. ...63
Figure 7.14 –Temperature profiles of column with damage D0/D1 at 60, 120, 180 and 240 minutes (left to right)...64
Figure 7.15 –Temperature profiles of column with damage D2 at 60, 120, 180 and 240 minutes (left to right)...64
Figure 7.16 –Temperature profiles of column with damage D3 at 60, 120, 180 and 240 minutes (left to right)...65
Figure 7.17 –Temperature evolution in the columns reinforcing steel bars. ...65
Figure 7.18 –Temperature evolution in the columns reinforcing steel bars. ...65
Figure 7.19 –Time until collapse of the columns with 4 fire frontiers. ...68
Figure 7.20 –Time until collapse of the columns with 3 fire frontiers. ...68
Figure 7.21 –Time until collapse of the columns with a load of 1750 kN (n=0,547). ...69
Figure 7.22 –Time until collapse of the columns with a load of 2250 kN (n=0,703). ...69
Figure 7.23 –Time until collapse of the columns with a load of 2750 kN (n=0,859). ...70
Chapter 8 Figure 8.1 –Beam with fixed supports: a) Beam length and load applied; b) Characterization of the finite element mesh...73
Figure 8.2 –Beam section. ...74
Figure 8.3 –Different sections of the beam according to the type of damage. The fire frontiers are also represented. ...74
Figure 8.4 –Temperature evolution in the beams bottom reinforcing steel bars. ...76
Figure 8.5 –Temperature evolution in the beams top reinforcing steel bars. ...77
Figure 8.6 –Temperature profiles of beam with damage D0/D1 at 60, 120, 180 and 240 minutes (left to right)...77
Figure 8.7 –Temperature profiles of beam with damage D2 at 60, 120, 180 and 240 minutes (left to right)...78
Figure 8.8 –Temperature profiles of beam with damage D3 at 60, 120, 180 and 240 minutes (left to right)...78
Figure 8.9 – Evolution of the axial force in the beams. ...81
xiv
Figure 8.11 – Evolution of the moments in the supports in the beams...82
Figure 8.12 –Evolution of displacement in the mid-span of the beam. ...83
Chapter 9 Figure 9.1 –Frame model. ...85
Figure 9.2 –Finite element mesh for structural analysis with SAFIR. ...86
Figure 9.3 –Location of nodes in the finite element mesh. ...86
Figure 9.4 –Representation of the three zones where different types of damage are applied. ...88
Figure 9.5 –Time until collapse of the frames ...91
Figure 9.6 –Axial force in the bottom beam in frames A1, B1 and C1. ...93
Figure 9.7 –Axial force in the bottom beam in frames A2, B2 and C2. ...94
Figure 9.8 –Axial force in the bottom beam in frames A3, B3 and C3. ...94
Figure 9.9 –Axial force in the bottom beam in frames A4, B4 and C4. ...94
Figure 9.10 –Axial force in the bottom beam in frames A5, B5 and C5. ...95
Figure 9.11 –Moments in element 81 in frames A1, A2, A3, A4 and A5. ...96
Figure 9.12 –Moments in element 81 in frames B1, B2, B3, B4 and B5. ...97
Figure 9.13 –Moments in element 81 in frames C1, C2, C3, C4 and C5. ...97
Figure 9.14 –Moments in element 101 in frames A1, A2, A3, A4 and A5. ...98
Figure 9.15 –Moments in element 101 in frames B1, B2, B3, B4 and B5. ...99
Figure 9.16 –Moments in element 101 in frames C1, C2, C3, C4 and C5. ...99
Figure 9.17 –Moments in elements 1 and 20 in frames A1, B1 and C1. ... 101
Figure 9.18 –Moments in elements 1 and 20 in frames A2, B2 and C2. ... 101
Figure 9.19 –Moments in elements 1 and 20 in frames A3, B3 and C3. ... 102
Figure 9.20 –Moments in elements 1 and 20 in frames A4, B4 and C4. ... 102
Figure 9.21 –Moments in elements 1 and 20 in frames A5, B5 and C5. ... 103
Figure 9.22 –Shear force in elements 1 and 20 in frames A1, B1 and C1. ... 104
Figure 9.23 –Shear force in elements 1 and 20 in frames A2, B2 and C3. ... 104
Figure 9.24 –Shear force in elements 1 and 20 in frames A3, B3 and C3. ... 105
Figure 9.25 –Shear force in elements 1 and 20 in frames A4, B4 and C4. ... 105
Figure 9.26 –Shear force in elements 1 and 20 in frames A5, B5 and C5. ... 106
Figure 9.27 –Horizontal displacement in node 40 in frames A1, A2, A3, A4 and A5. ... 108
Figure 9.28 –Horizontal displacement in node 40 in frames B1, B2, B3, B4, and B5. .... 108
Figure 9.29 –Horizontal displacement in node 40 in frames C1, C2, C3, C4 and C5. .... 109
Figure 9.30 –Horizontal displacement in node 40 in frames A1, B1 and C1. ... 109
xv
Figure 9.32 –Horizontal displacement in node 40 in frames A3, B3 and C3. ... 110
Figure 9.33 –Horizontal displacement in node 40 in frames A4, B4 and C4. ... 111
Figure 9.34 –Horizontal displacement in node 40 in frames A5, B5 and C5. ... 111
Figure 9.35 –Vertical displacement in node 201 in frames A1, A2, A3, A4 and A5. ... 112
Figure 9.36 –Vertical displacement in node 201 in frames A1, A2, A3, A4 and A5. ... 113
Figure 9.37 –Vertical displacement in node 201 in frames A1, A2, A3, A4 and A5. ... 113
Figure 9.38 –Vertical displacement in node 201 in frames A1, B1 and C1. ... 114
Figure 9.39 –Vertical displacement in node 201 in frames A2, B2 and C2. ... 115
Figure 9.40 –Vertical displacement in node 201 in frames A3, B3 and C3. ... 115
Figure 9.41 –Vertical displacement in node 201 in frames A4, B4 and C4. ... 116
Figure 9.42 –Vertical displacement in node 201 in frames A5, B5 and C5. ... 116
Appendix A Figure A1 – a) Axial force diagram of beam A1 at 0 minutes. b) Shear force diagram of beam A1 at 0 minutes. c) Bending moment diagram of beam A1 at 0 minutes. d) Deformed shape (scaled 10 times) of beam A1 at 0 minutes. ... 125
Figure A2 – Axial force diagram of beam A1. a) At 0 minutes. B) At 120 minutes. c) At 240 minutes. ... 126
Figure A3 – Shear force diagram of beam A1. a) At 0 minutes. B) At 120 minutes. c) At 240 minutes. ... 127
Figure A4 – Bending moment diagram of beam A1. a) At 0 minutes. B) At 120 minutes. c) At 240 minutes. ... 128
Figure A5 – Deformed shape (scaled 10 times) of beam A1. a) At 0 minutes. B) At 120 minutes. c) At 240 minutes. ... 129
Figure A6 – Axial force diagram of beam A2. a) At 0 minutes. B) At 60 minutes. c) At 106 minutes. ... 130
Figure A7 – Shear force diagram of beam A2. a) At 0 minutes. B) At 60 minutes. c) At 106 minutes. ... 131
Figure A8 – Bending moment diagram of beam A2. a) At 0 minutes. B) At 60 minutes. c) At 106 minutes. ... 132
Figure A9 – Deformed shape (scaled 10 times) of beam A2. a) At 0 minutes. B) At 60 minutes. c) At 106 minutes. ... 133
Figure A10 – Axial force diagram of beam A3. a) At 0 minutes. B) At 20 minutes. c) At 49 minutes. ... 134
Figure A11 – Shear force diagram of beam A3. a) At 0 minutes. B) At 20 minutes. c) At 49 minutes. ... 135
xvi
Figure A12 – Bending moment diagram of beam A3. a) At 0 minutes. B) At 20 minutes. c) At 49 minutes. ... 136 Figure A13 – Deformed shape (scaled 10 times) of beam A3. a) At 0 minutes. B) At 20
minutes. c) At 49 minutes. ... 137 Appendix B
Figure B1 – Frame model. ... 139 Figure B2 – a) Schematic bending moment diagram of frame A1 at 0 minutes, b)
Deformed shape (scaled 10 times) of frame A1 at 0 minutes, c) Schematic shear force diagram of frame A1 at 0 minutes. ... 140 Figure B3 – Schematic bending moment diagram of frame A1: a) 120 minutes, b) 227
minutes. ... 140 Figure B4 – Deformed shape (scaled 10 times) of frame A1: a) 120 minutes, b) 227
minutes. ... 140 Figure B5 – Schematic shear force diagram of frame A1: a) 120 minutes, b) 227 minutes.
... 140 Figure B6 – Schematic bending moment diagram of frame A2: a) 60 minutes, b) 144
minutes. ... 140 Figure B7 – Deformed shape (scaled 10 times) of frame A2: a) 60 minutes, b) 144
minutes. ... 140 Figure B8 – Schematic shear force diagram of frame A2: a) 60 minutes, b) 144 minutes.
... 140 Figure B9 – Schematic bending moment diagram of frame A3: a) 45 minutes, b) 109
minutes. ... 140 Figure B10 – Deformed shape (scaled 10 times) of frame A3: a) 45 minutes, b) 109
minutes. ... 140 Figure B11 – Schematic shear force diagram of frame A3: a) 45 minutes, b) 109 minutes.
... 140 Figure B12 – Schematic bending moment diagram of frame A4: a) 45 minutes, b) 109
minutes. ... 140 Figure B13 – Deformed shape (scaled 10 times) of frame A4: a) 45 minutes, b) 109
minutes. ... 140 Figure B14 – Schematic shear force diagram of frame A4: a) 45 minutes, b) 109 minutes.
... 140 Figure B15 – Schematic bending moment diagram of frame A5: a) 60 minutes, b) 143
xvii
Figure B16 – Deformed shape (scaled 10 times) of frame A5: a) 60 minutes, b) 143 minutes. ... 140 Figure B17 – Schematic shear force diagram of frame A5: a) 60 minutes, b) 143 minutes.
... 140 Figure B18 – Schematic bending moment diagram of frame B1: a) 90 minutes, b) 180
minutes. ... 140 Figure B19 – Deformed shape (scaled 10 times) of frame B1: a) 90 minutes, b) 180
minutes. ... 140 Figure B20 – Schematic shear force diagram of frame B1: a) 90 minutes, b) 180 minutes.
... 140 Figure B21 – Schematic bending moment diagram of frame B2: a) 60 minutes, b) 171
minutes. ... 140 Figure B22 – Deformed shape (scaled 10 times) of frame B2: a) 60 minutes, b) 131
minutes. ... 140 Figure B23 – Schematic shear force diagram of frame B2: a) 60 minutes, b) 130 minutes.
... 140 Figure B24 – Schematic bending moment diagram of frame B3: a) 30 minutes, b) 54
minutes. ... 140 Figure B25 – Deformed shape (scaled 10 times) of frame B3: a) 30 minutes, b) 54
minutes. ... 140 Figure B26 – Schematic shear force diagram of frame B3: a) 30 minutes, b) 54 minutes.
... 140 Figure B27 – Schematic bending moment diagram of frame B4: a) 30 minutes, b) 78
minutes. ... 140 Figure B28 – Deformed shape (scaled 10 times) of frame B4: a) 30 minutes, b) 78
minutes. ... 140 Figure B29 – Schematic shear force diagram of frame B4: a) 30 minutes, b) 78 minutes.
... 140 Figure B30 – Schematic bending moment diagram of frame B5: a) 60 minutes, b) 127
minutes. ... 140 Figure B31 – Deformed shape (scaled 10 times) of frame B5: a) 60 minutes, b) 127
minutes. ... 140 Figure B32 – Schematic shear force diagram of frame B5: a) 60 minutes, b) 127 minutes.
... 140 Figure B33 – Schematic bending moment diagram of frame C1: a) 90 minutes, b) 173
xviii
Figure B34 – Deformed shape (scaled 10 times) of frame C1: a) 90 minutes, b) 173 minutes. ... 140 Figure B35 – Schematic shear force diagram of frame C1: a) 90 minutes, b) 173 minutes.
... 140 Figure B36 – Schematic bending moment diagram of frame C2: a) 60 minutes, b) 132
minutes. ... 140 Figure B37 – Deformed shape (scaled 10 times) of frame C2: a) 60 minutes, b) 132
minutes. ... 140 Figure B38 – Schematic shear force diagram of frame C2: a) 60 minutes, b) 128 minutes.
... 140 Figure B39 – Schematic bending moment diagram of frame C3: a) 30 minutes, b) 47
minutes. ... 140 Figure B40 – Deformed shape (scaled 10 times) of frame C3: a) 30 minutes, b) 47
minutes. ... 140 Figure B41 – Schematic shear force diagram of frame C3: a) 30 minutes, b) 47 minutes.
... 140 Figure B42 – Schematic bending moment diagram of frame C4: a) 30 minutes, b) 69
minutes. ... 140 Figure B43 – Deformed shape (scaled 10 times) of frame C4: a) 30 minutes, b) 69
minutes. ... 140 Figure B44 – Schematic shear force diagram of frame C4: a) 30 minutes, b) 69 minutes.
... 140 Figure B45 – Schematic bending moment diagram of frame C5: a) 60 minutes, b) 125
minutes. ... 140 Figure B46 – Deformed shape (scaled 10 times) of frame C5: a) 60 minutes, b) 125
minutes. ... 140 Figure B47 – Schematic shear force diagram of frame C5: a) 60 minutes, b) 125 minutes.
xix
List of tables
Chapter 2
Table 2.1 – Fire resistance classification [7]. ...12 Table 2.2 – Requirements for load-bearing elements and without compartmentalization
function [7]. ...13 Chapter 3
Table 3.1 – Values for the main parameters of the stress-strain relationships of normal weight concrete with siliceous or calcareous aggregates concrete at elevated
temperatures [30]. ...31 Table 3.2 – Reduction factors for stress-strain relationship of carbon steel at elevated
temperatures [30] [31]. ...33 Chapter 5
Table 5.1 – Risk factors for each utilization type [37]. ...42 Table 5.2 – Risk categories in utilization type II – Parking [36]. ...43 Table 5.3 –Risk categories in utilization type XI – Library and archives [36]. ...43 Table 5.4 – Risk categories in utilization type XII – Industrial, workshops and warehouses
[36]. ...43 Table 5.5 – Minimum fire resistance of structural elements of buildings [35]. ...44 Chapter 6
Table 6.1 –Section geometry, thermal concrete properties and fire curve. ...46 Table 6.2 –Temperatures in nodes A, B, C and D for mesh 1 to 6. ...48 Table 6.3 – Temperatures in node A, for damage D0/D1 for the different fire frontiers. ....52 Table 6.4 –Temperatures in node A, for damage D2 for the different fire frontiers...53 Table 6.5 –Temperatures in node A, for damage D3 for the different fire frontiers...54 Chapter 7
Table 7.1 –Geometric and material characterization of the columns...58 Table 7.2 –Time until collapse of the columns with 4, 3 and 1 fire frontiers. ...67
xx
Table 7.3 –Risk category respected by each column. ...71 Chapter 8
Table 8.1 –Geometric and material characterization of the beams. ...75 Table 8.2 –Location of the damage in the beam. ...79 Table 8.3 –Time until collapse of the beam. ...79 Table 8.4 –Risk category respected by each beam. ...80 Chapter 9
Table 9.1 –Concrete properties, reinforcing steel properties, loads and fire curve in the frames. ...87 Table 9.2 –Characteristics of the different analysed frames. ...89 Table 9.3 –Time until collapse of the frames. ...91 Table 9.4 –Risk category of each frame. ...92
xxi
List of
acronyms
PEF – Post-earthquake fire RC – Reinforced concrete
CFRP – Carbon Fibre Reinforcement Polymer FF – Fire Frontiers
xxii
xxiii
Table of Contents
DEDICATION III ACKNOWLEDGEMENTS V RESUMO VII ABSTRACT IX LIST OF FIGURES XILIST OF TABLES XIX
LIST OF ACRONYMS XXI
TABLE OF CONTENTS XXIII
1. INTRODUCTION 1
1.1. Initial considerations ...1 1.2. Dissertation objectives ...1 1.3. Outline of the dissertation chapters...2
2. POST-EARTHQUAKE FIRE – BRIEF OVERVIEW 5 2.1. Earthquake action ...5
2.1.1. General overview ...5 2.1.2. Types of earthquake effects ...5 2.1.3. Earthquake damages on buildings ...6
2.2. Fire action ...8
2.2.1. General overview ...8 2.2.2. Fire curves ... 10 2.2.3. Fire resistance according to European legislation ... 12 2.2.4. Passive and active fire protection systems in buildings ... 13
xxiv
2.2.5. Fire effects on RC elements ... 14
2.3. Post-Earthquake Fire ... 16
2.3.1. General overview ... 16 2.3.2. Post-Earthquake fire ignition sources... 18 2.3.3. Review of historical data ... 19 2.3.4. Previous works developed ... 20
3. MATERIALS THERMAL AND MECHANICAL PROPERTIES AT
ELEVATED TEMPERATURES 23
3.1. Concrete thermal properties ... 23
3.1.1. Thermal elongation... 23 3.1.2. Specific heat ... 24 3.1.3. Density ... 25 3.1.4. Thermal conductivity ... 25
3.2. Steel thermal properties ... 27
3.2.1. Thermal elongation... 27 3.2.2. Specific heat ... 28 3.2.3. Unit mass ... 29 3.2.4. Thermal conductivity ... 29
3.3. Concrete mechanical properties ... 30 3.4. Steel mechanical properties ... 32
4. SAFIR: A THERMAL/STRUCTURAL PROGRAM FOR MODELLING
STRUCTURES UNDER FIRE 35
4.1. General overview ... 35 4.2. Capabilities and limitations of SAFIR ... 35 4.3. Concrete and steel thermal properties ... 36
4.3.1. Concrete structural properties... 36 4.3.2. Steel mechanical properties ... 37
5. REGULATORY REQUIREMENTS 39
5.1. SCIE ... 39
xxv
5.1.2. Building type occupancy ... 39 5.1.3. Risk areas ... 40 5.1.4. Risk categories... 41 5.1.5. Fire resistance... 44
6. STUDY AT REINFORCED CONCRETE SECTION LEVEL 45
6.1. Introduction ... 45 6.2. Influence of the mesh ... 46 6.3. Study of the damage ... 50
7. POST-EARTHQUAKE FIRE ON RC COLUMNS UNDER AXIAL LOAD 55
7.1. Introduction ... 55 7.2. Column section analysis ... 56
7.2.1. Geometric configuration ... 56 7.2.2. Material properties... 58 7.2.3. Thermal analysis ... 59
7.3. Column analysis ... 66
7.3.1. Time until conventional collapse ... 66
8. POST-EARTHQUAKE FIRE ON RC BEAMS 73
8.1. Introduction ... 73 8.2. Beam section analysis ... 74
8.2.1. Geometric configuration ... 74 8.2.2. Material properties... 75 8.2.3. Thermal analysis ... 76
8.3. Beam analysis ... 79
8.3.1. Beam characteristics ... 79 8.3.2. Time until conventional collapse ... 79 8.3.3. Axial force ... 80 8.3.4. Mid-span moments ... 81 8.3.5. Moments in supports ... 82 8.3.6. Displacement mid-span ... 83
xxvi 9. POST-EARTHQUAKE FIRE ON RC FRAMES 85
9.1. Introduction ... 85 9.2. Frames section analysis ... 87
9.2.1. Material properties... 87
9.3. Frames analysis ... 88
9.3.1. Frame characteristics ... 88 9.3.2. Time until conventional collapse ... 89 9.3.3. Axial force in beam ... 93 9.3.4. Moments in beam ... 95 9.3.5. Moments in column ... 100 9.3.6. Shear force in column... 103 9.3.7. Displacement at storey level ... 106 9.3.8. Vertical displacement in beam mid-span ... 112
10. CONCLUSIONS AND FURTHER WORKS 117
10.1. Final considerations ... 117 10.2. Further works ... 119
REFERENCES 120
APPENDIX A 125
1
1. Introduction
1.1. Initial considerations
The requirements that structures must fulfil have become increasingly demanding and it is necessary to verify the performance of these increasingly complex requests. Only this way it is possible to guarantee a safe structure with good behaviour to different types of actions. The fire safety is a fundamental requirement in buildings. The reinforced concrete buildings have an overall good behaviour against fire because concrete is a material that has a good resistance against high temperatures, low conductivity and does not produce smoke or toxic vapours. The elevated temperatures change the mechanical properties of the concrete and can change the forces diagrams of the structures. It is important to understand the behaviour of reinforced concrete structures under fire. There are several investigations and research developed regarding this, but not so much regarding the behaviour of a concrete structure to a fire after an earthquake. A fire that occurs after an earthquake can be very different from a fire that occurs at any other time. The damage caused by the earthquake can change the fire resistance of the structure. It is important to understand the behaviour of reinforced concrete structure against the seismic action, fire action but it is also important to understand the combined effect of these actions.
1.2. Dissertation objectives
The objective of this dissertation is to evaluate the effect that a post-earthquake fire has on reinforced concrete buildings. To be able to access this effect there were developed several numerical simulations on reinforced concrete columns, beams
2 and frames. There are different typologies of damage considered in the reinforced concrete elements. The aim is to compare the results of the reinforced concrete elements with different typologies of damage to be able to see the impact that the damage has on the fire resistance of the reinforced concrete elements. Other objectives are related with the analysis of the forces in the beams and frames. The aim the comparison of the axial force, shear force, moments and displacements of different reinforced concrete elements with different typologies of damage.
1.3. Outline of the dissertation chapters
Chapter 2
Post-earthquake fire
In this Chapter it is presented some concepts regarding the phenomenon of earthquakes, fire and post-earthquake fire on buildings. The Chapter is divided into three parts, one related with earthquakes, other with fires and finally one related with the combined effect of earthquakes and fires, the post-earthquake fire.
Chapter 3
Materials thermal and mechanical properties at elevated temperatures
This Chapter introduces the thermal and mechanical properties at elevated temperatures of the concrete and steel. This Chapter is divided into four parts. Two parts for the thermal and mechanical properties of the concrete and two parts for the thermal and mechanical properties of the steel.
Chapter 4
SAFIR: A thermal/structural program for modelling structures under fire
A brief introduction of the program used in this dissertation is presented in this Chapter. There are introduced some capabilities and limitations of the software and some information related with the concrete and steel properties.
3 Chapter 5
Regulatory requirements
This Chapter shows some information regarding the Portuguese technical regulation of fire safety in buildings.
Chapter 6
Study of the concrete section
In this Chapter it is presented a brief parametric study to evaluate the impact of different meshes on the temperatures of a concrete section. It is also analysed a small example regarding the influence of damage in the temperature of a certain point of the section.
Chapter 7
Post-earthquake fire on RC columns under axial load
In this Chapter there were developed several numerical models to evaluate the influence that different types of damage, fire frontiers and loads have on the time until collapse of a column. The evolution of the thermal profiles in the section of the reinforced concrete column is also analysed considering different loads and types of damage.
Chapter 8
Post-earthquake fire on RC beams
This Chapter presents three different beams with different types of damage in each beam. It is analysed the influence of the damage on the time until collapse, axial force, moments and displacements of the beams.
Chapter 9
Post-earthquake fire on RC frames
In this Chapter there were developed fifteen numerical models. Each model represents a frame with different characteristics regarding the damage and fire frontiers. It is analysed the influence the of the damage and fire frontiers on the time
4 until collapse, axial forces, shear forces, bending moments and displacements of the frames.
Chapter 10
Conclusions and further works
This Chapter summarizes the main conclusions obtained during the development of this dissertation and indicates further works than can be developed regarding the phenomenon of post-earthquake fire in reinforced concrete buildings.
5
2. Post-earthquake fire – Brief Overview
2.1. Earthquake action
2.1.1.
General overview
Most earthquakes originate inside the Earth in faults that break due to accumulation of tensions around it. This accumulation of tensions is a natural phenomenon that happens due to the internal dynamics of the land that has been perpetuated over the decades, centuries and millennia. When the accumulated tension is excessive for the resistance in the plane of the fault, it breaks off given rise to earthquakes. This rupture phenomenon has periodicity characteristics, but until now is not possible to predict with accuracy the next earthquake in terms of days, weeks or months. The main consequence of earthquakes is the effect of the propagation of the elastic waves that originate from the rupture of the fault. More than 80% of the worldwide damages in buildings in the past are related with this natural hazard [1].
2.1.2.
Types of earthquake effects
The impact of earthquakes can be diverse. The earthquake consequences can be divided into three groups, direct, indirect and immaterial losses. The direct losses are the effects on the population, for example, fatalities, seriously injured, minor injured, homeless and psychological trauma. The damage in the urban environment, infrastructures, supply networks and historical heritage built is also a direct effect. The indirect losses are related with the socio-economic impact due to
6 difficulty in restoring the daily life. The immaterial losses are related with aspects that are difficult to quantify, those can be cultural values, patrimonial, aesthetics, religious, etc, that can be lost with the occurrence of earthquakes [1].
2.1.3.
Earthquake damages on buildings
The earthquake can cause different types of structural and non-structural damage in buildings. The masonry walls normally are not considered as structural elements. The masonry bricks usually have a brittle behaviour and can modify the structure response of the building by changing the structural stiffness, attracting forces to structural elements not designed to resist such forces [2]. In Figures 2.1 and 2.2 are examples of the damage caused by an earthquake in the masonry walls of a building. This situation can be avoided with more ductile masonry walls.
a) b)
Figure 2.1 – Involuntary creation of a leaked floor. a) Situation at the beginning of the earthquake. b) Situation after the collapse of the masonry walls in the ground floor.
7 There is also the structural damage in the structural elements like beams and columns, walls, slabs or even foundations. To assure a proper structural behaviour under an earthquake action it is important to have structural elements with proper strength, stiffness and ductility but it is also important that the beam-column joints are well connected and with a proper ductile behaviour [2]. Figure 2.3 show damage at the beam-column joints caused by an earthquake.
The poor detailing of the reinforcing steel is a common deficit in the existing structures, especially on old reinforced concrete structures, designed without seismic concerns. There are several cases reported related with the poor detail, namely related with the confinement reinforcement not correctly constituted at the beam-column joints, deficiency of transverse reinforcement in the columns with wide spacing of the ties and poor confinement of the concrete core. The short lap splices and incorrect end hook angle are also examples of poor detailing of the reinforcing steel. The use of smooth reinforcing bar that creates a weaker bond between concrete and steel can also be observed in some cases [4]. In Figure 2.4 is an example of poor detailing of the reinforcing steel.
There are other cases that lead to a poor behaviour of the structures to the seismic action, such as, poor concrete quality, damage related with strong beam-weak column, soft stories at the first-floor level, and defects in the workmanship [5] [6].
8
2.2. Fire action
2.2.1.
General overview
Fire is a combustion characterized by the appearance, conservation and propagation of the flame, heat release, gas emission and smoke production. Given that a fire is a combustion this means that only happens if in the same place is present a fuel and an oxidizer. The fuel material can be any material that is susceptible to burn (wood, paper, plastics). The oxidizer is the oxygen. The presence of the fuel and oxidizer is not enough to produce the fire, it is also necessary a third factor, the activation energy. The activation energy can be a heat source that will cause a change in the thermal level of the fuel. The pyrolysis of a certain solid combustible material occurs when that material temperature reaches a certain value. Due to heat action, the material starts to emit decomposition gases that are fuels. Once this temperature is reached, the reaction develops into a chain with the continuity of the combustion, appearing this way a fourth factor, the chain reaction. So, in this way is possible to organize these four factors in a tetrahedron like is shown in Figure 2.5 [7].
9 During the natural development of a fire, from the beginning until the extinction, there are several important stages, namely: ignition, growth, flashover, burning and decay. In the Figure 2.6 is represented the relation between the previous mentioned stages and the temperature evolution with time [7].
The fire evolution from the ignition until the flashover depends from several factors, some related with the fuel and oxidizer, others related with the local characteristics of the place where the fire develops. The main factors are the following:
• Type and quantity of available fuel;
• Quantity of oxidizer (oxygen) available, that depends on the compartment ventilation conditions and the dimensions of the openings;
• Compartment geometry;
• Type of pavements, walls and coatings;
• Atmospheric conditions (temperature, wind direction, etc.)
Figure 2.5 – Fire tetrahedron.
10 After the ignition, the fire starts to develop according to the fuel available in the place, releasing heat that causes the temperature increase. In this phase, the fire can conclude due to the lack of fuel material (fire controlled by the fuel), or by oxidizer deficit (fire controlled by ventilation). If there is sufficient fuel and oxidizer and no outside intervention, the temperature in the compartment continuous to increase. This situation leads to the ignition of materials that until that moment had not initiated the combustion process yet. The flashover establishes the transition to the burning phase. The burning phase takes place when all the fuel in the compartment is involved in the fire. Usually the flashover occurs when the temperature of the released gases reaches close to 600 ºC. It is in the burning phase where the higher temperature can be observed, it can reach values higher than 1000 ºC [7]. However, the temperature inside a compartment where a fire is developing is not uniform, near the ceiling the temperature is higher when compared with the flooring and lower places of the walls. The hot gases produced during the fire go to the higher part of the compartment and the flames elongate towards the ceiling [10]. Not all the fires have a complete development, due to direct intervention (firefighters action or automatic extinguishing systems, for example), or due to the compartment characteristics (lack of oxidizer, for example), the fire can be extinguished before reaching the burning phase [7].
2.2.2.
Fire curves
In a fire scenario, for a given compartment it is possible to obtain temperature evolution curves. The effect of these curves, with reasonable approximation shouldn’t be exceed during the life time of the building. The determination of these curves is obtained by solving the energy balance equation for that compartment, obeying to some frontier conditions. Comparing several curves that had been proposed, frequently, is possible to see that for a continuous combustion and controlled ventilation the curve values are similar. In the part 1.2 of Eurocode 1 are defined the thermal actions that should be considered for the design of elements
11 with support function. In the Figure 2.7 is possible to see the time temperature curves [4].
Standard temperature-time curve is given by [9]:
θg = 20 + 345 log10(8t + 1) [ºC]
where
θg is the gas temperature in the fire compartment [ºC]
t is the time [min]
External fire curve is given by [9]:
θg = 660 (1 – 0,687 e-0,32t – 0,313 e-3,8t) + 20 [ºC] where
θg is the gas temperature in the fire compartment [ºC]
t is the time [min]
Hydrocarbon curve is given by [9]:
θg = 1080 (1 – 0,325 e-0,167t – 0,675 e-2,5t) + 20 [ºC] where
θg is the gas temperature in the fire compartment [ºC]
12
Figure 2.7 – Time temperature curves for post-flashover fires.
2.2.3.
Fire resistance according to European
legislation
In terms of requirements regarding the fire performance in construction materials it was publish by CE and CEN several documents, highlighting the
“Decisão nº 2000/367/CE”. This document defines the classification to adopt at
community level. The fundamental criteria used to characterize the fire resistance are:
• Load bearing capacity (represented by R);
• Integrity against flames and hot gases (represented by E); • Thermal insulation (represented by I).
These criteria can be associated with each other as shown in Table 2.1.
Table 2.1 – Fire resistance classification [7].
Element functions Requirements
Stability Integrity Insulation Support R - - Compartmentalization - E - EI Support and compartmentalization RE - REI 0 200 400 600 800 1000 1200 1400 0 30 60 90 120 150 180 210 240 T (ºC) t (min) Hydrocarbon curve ISO 834
13 The classification applicable to walls, pavements, beams, columns, balconies and stairs is presented in Table 2.2. The numbers associated to the classification specifies the number of minutes that an element can withstand while performing their function [7].
Table 2.2 – Requirements for load-bearing elements and without compartmentalization function [7].
Classification Time steps (min)
R 15 20 30 45 60 90 120 180 240 360
2.2.4.
Passive and active fire protection systems
in buildings
Fire safety in a building is usually achieved with a combination of active and passive fire protection systems [10]. Passive fire protection systems are those elements in a building that may contribute to increased fire safety and are characterized by the following:
• Do not require activation by fire effects or products to carry out their intended purpose;
• Are self-contained or independent in action;
• Are not intentionally acting upon the inherent fire process.
In pre-flashover fires, passive fire protection includes a selection of materials for building construction and interior linings that do not support rapid flame spread or smoke production in the growth period. In post-flashover fires, passive fire protection is provided by structures and assemblies with sufficient fire resistance to prevent both spread of fire and structural collapse [10].
Active fire protection systems are those which require activation by fire effects or products to carry out their intended purpose. These protection systems are characterized by time dependent performance. They need performance testing and maintenance throughout their service life to ensure their response in their “through life” state. The following examples are different types of active fire protection systems [10]:
14
• Detection and alarm equipment; • Suppression systems;
• Exit and emergency lighting; • Automatic doors, and fire dampers; • Smoke management systems;
• Supporting services, for example, power and water supplies.
One of the best forms of active fire protection is an automatic sprinkler system. The sprinkler system discharges water over a local area under one sprinkler head when is activated by local high temperatures. As the local temperatures increase more sprinkler heads will be activated. Sprinkler systems can prevent small fires from growing larger and may even extinguish some fires. A sprinkler system must operate early in a fire because the water supply system is designed to tackle a small or moderate fire, well before flashover occurs [10].
2.2.5.
Fire effects on RC elements
Nowadays, the behavior of the reinforced concrete exposed to fire is not well characterized and future investigation is needed in almost all the aspects. Most of the research is focused on isolated reinforced concrete elements. There is a need to develop models that consider the fire effects in a complete structure [11]. In this Chapter it is presented some of the fire effects on RC elements.
a) Chemical changes of concrete subjected to high temperatures
When subjected to heating, the concrete has physical and chemical changes. The chemical changes are especially complex due to the non-uniformity of the concrete constituted by cement and aggregates. Initially, the water in the concrete vaporizes between 100-140 ºC, causing an increase in pressure in water vapour. Close to 400 ºC the calcium hydroxide in the cement begins to dehydrate generating more water vapour that leads to a reduction in the physical strength of the material. The physical and chemical changes of the concrete reduce the compressive
15 strength, which remains constant until a certain temperature. After that temperature the compressive strength dramatically reduces [11].
b) Spalling
Spalling is one of the less understood processes in the concrete. There are several prerequisites for the spalling to occur. Normally it is necessary at least 2% volume of water and a thermal gradient of at least 5 ºC/mm. The spalling is practically certain if the thermal gradient is 7-8 ºC/mm. On the other hand, the effect of spalling can be reduced with the use of polypropylene fibres. These when heated change from solid to gas and this can create a passage for the water vapour to go from the inside of the concrete to the outside. This situation reduces the vapour pressure in the concrete. It is important to mention that the polypropylene fibres can lead to cracks in the deeper layers of the concrete that can lead to adverse structural consequences [11].
16
c) Cracking
It is believed that the process that originates the cracks is the same that originates the spalling that is the thermal expansion and the concrete dehydration. In a study performed on the cracks in a building exposed to fire was associated the depth of the cracks with the temperature of the fire and mainly with the origin of the fire [11] [13].
2.3. Post-Earthquake Fire
2.3.1.
General overview
The ordinary fires in the urban environment will generally follow several steps, ignition, growth, detection, report, response, suppression activities and extinguishment (by suppression activities, or due to exhaustion of the fuel). The process of post-earthquake fires will be like ordinary fires, but the fire protection response interactions are likely to be disrupted during and following a major earthquake. The disruption can be because of several factors, for example, the likelihood of multiple simultaneous ignitions, detection delays, reporting delays,
17 response of fire brigades, water supplies reduced or exhausted. The multiple simultaneous ignitions arise from the widespread effects of earthquakes. The fires would be easily extinguished in normal situations but due to insufficient fire service resources they could have the opportunity to grow and spread over large areas. The detection delays can happen due to damaged detectors or distracted observers but usually the time until the discovery of post-earthquake fire is not different from that at other times. The reporting delays can be caused by failure of communications systems due to damage and overload from high usage levels [10] [14].
There are historical evidences that confirm the appearance of fire after an earthquake in the built urban environment. The consequences of these events lead to losses of lives and property. There are three main combined aspects that under normal circumstances allow a response to fires in buildings, both active and passive fire protection systems and manual fire-fighting by a fire brigade. Adequate water supplies need to be available because of the difficulty of stopping fire spread without water. However, urban underground water distribution systems are vulnerable to earthquake shaking and failures are to be expected after an earthquake. The structural and non-structural damage caused to buildings by earthquakes can lead to the failure of passive protection systems. The passive protection can be damaged by cracking, buckling or breaking, and the openings can lead to increase ventilation of compartment fires. The openings also allow the migration of smoke and hot gases to other areas of the building. Sometimes, after an earthquake, active fire protection systems (detection, alarm and suppression systems) can also be unreliable. This situation leads to undetected ignitions which can result in large fires that are more difficult to extinguish. Following a major earthquake, it is likely that the response of fire brigades be impaired. Can be impaired by several reasons, reporting delays caused by the failure of communications systems, impassable access routes or traffic jams, loss of operational availability of vehicles and equipment caused by earthquake damage. The possibility of multiple simultaneous ignitions and insufficient fire brigade resources will delay fire brigade attendance [10].
18
2.3.2.
Post-Earthquake fire ignition sources
Post-earthquake ignition sources are mainly electrical or gas related, but can also include open flame, hot surfaces, exothermic chemical reactions from spilled chemicals and fires intentionally lit [14]. Structural damage caused by earthquake shaking can stress electrical wiring causing short-circuits that can lead to ignitions. Earthquake damage to gas appliances, gas supply lines or gas storage facilities can liberate gas which can be ignited by electrical sources or flames in the appliances themselves. Electrical appliances, for example, cookers, gas-fuelled water heaters and solid fuel burners that are insufficiently restrained can topple or shift sideways, and their residual heat may initiate fires in combustible materials brought in contact with the hot surfaces. The restoration of electrical and gas supplies to damaged appliances and wiring can lead to ignition of combustibles in contact and ignition of leaking gas. It is not possible to eliminate all initial fire outbreaks following a major earthquake but the risk of these could be reduced if some fire preventive practices and installation procedures are performed. The main actions to reduce the post-earthquake fire sources are the education of the population to minimize the risk of fire and the adequate design of the gas networks including an automatic valve that reduces the gas quantities in case of damage in the network. These automatic valves are placed in the pipe after the gas meter, with these after an earthquake the amount of gas inside the house is reduced. In the Figures 2.10 and 2.11 are represented the cutaway view of horizontal valves that can be used to reduce the quantity of gas to the building. The electric power networks usually have a security device that shuts off the network during several seconds after the beginning of a big earthquake [10].
19
2.3.3.
Review of historical data
Throughout the history is possible to find several examples of post-earthquake fires. In Portugal the most know case of post-earthquake fire was in Lisbon in the November first in 1755. About 2/3 of the constructions were destroyed by the vibrations and fire. The total values of victims are between 5000 and 40 000 dead [1]. There are also more recent examples, like the Hokkaido Nansei-oki earthquake, Northern Japan in 1993. In this earthquake 246 people were dead or missing, 190 houses and buildings were consumed by fire over an 11-hour period [10]. The town of Aonae was destroyed by conflagration following earthquake and tsunami. Building-to-building fire spread was accelerated by externally stored propane and kerosene tanks used for cooking and heating. Another example is the 1994 earthquake in Northridge, San Fernando Valley in Southern California. This earthquake had 58 fatalities (none from fire) and 1500 serious injuries. There were 30 to 50 significant fires initially following the earthquake, and after less than 8 hours the total number of fires was about 110. Principal cause was gas leaks from natural gas pipelines and appliances. The restoration of gas and power after a few days caused significant number of fires [10]. There is also a different perspective for the post-earthquake fire when the fire does not start immediately after the earthquake. The Great East Japan Earthquake, which occurred on 11 March 2011 was one of the largest earthquake in recent Japanese history and resulted in the generation of
20 large amounts of disaster waste. It was necessary the creation of outdoor storage areas to be able to deposit the disaster waste. In these areas, in the Tohoku region, more than 40 fires occurred. One probable cause of the fires is thought to have been the heat generated by fermentation of microorganisms. The microorganisms can thrive easy in those conditions, and the heat created can lead to spontaneous ignition. The materials deposited in the outdoor storage areas have a huge influence on this process, it is expected that the presence of wood will most likely lead to more ignitions than the presence of concrete, for instance. A study performed in this topic revealed that the heat generated during fermentation of wood chips and rotten tatami was most likely the trigger of the spontaneous ignition. This situation only serves as an example that the post-earthquake fires can appear from different causes and maybe in places where were not initially expected [16] [17].
2.3.4.
Previous works developed
The effects of fire after an earthquake on the RC buildings are not very well known. In the past years there were developed several numerical and experimental studies regarding the post-earthquake fire to be able to better understand the phenomenon.
Beyond the research of post-earthquake fire on RC buildings there are also works developed regarding the post-earthquake fire on steel structures. In some works, the focus is the analysis of the behavior of steel frames to post-earthquake fire [18]. There are studies were the aim is to analyse the impact that the earthquake has on the passive fire protection of the steel structures. Some materials that are used as passive fire protection have a brittle behavior and suffer damage due to the seismic action, leading to a lower fire resistance of the steel structures [19] [20]. There is also research regarding the behavior of the joints and connections of the steel frames. The results show that severe damage on the connections lead to reduced fire resistance capacities [21] [22].
21 Some experimental studies developed in frames showed that using standard fire curve may not be very accurate since different elements can have different temperature profiles [23] [24]. It was observed that the brick infill walls provide insulation to the RC structural elements and slow the transmission of heat to these elements. This shows the beneficial effect that the masonry walls have on the columns and beams integrated in the masonry walls, and this beneficial effect should be considered while designing the columns and beams [23]. The position of the openings in the compartments and the resulting movement of fire plume and hot gases have also an influence in terms of the evolution of temperatures in the structural sections. This situation may or may not lead to an overlap between the locations of the damage caused by the earthquake and the damage caused by the fire [24]. Some numerical and experimental studies were also developed regarding the fire resistance of CFRP-strengthened reinforced concrete elements [25] [26]. The results show that the fire resistances of the specimens subjected to life safety (LS) and collapse prevention (CP) damage levels are about 32 and 15 min and for the CFRP-strengthened specimen is about 43 and 23 min, respectively. This solution represents a 25% increase at LS level and 35% increase at CP level [25]. Also, regarding the use of CFRP, using this solution to relocate plastic hinges of the beams away from the columns improve the post-earthquake fire resistance of the frames [27].
It was also observed that buildings designed for stronger earthquakes have more resistance against fire, even in the case of fire alone. This shows that the stiffness of structures has an important role in the fire resistance [28]. Other study showed that a structure that have significantly suffered damaged from an earthquake have lower fire resistance when compared with undamaged structures and that the fire resistance of the frames is mostly dependent of the resistance of the frames [29].
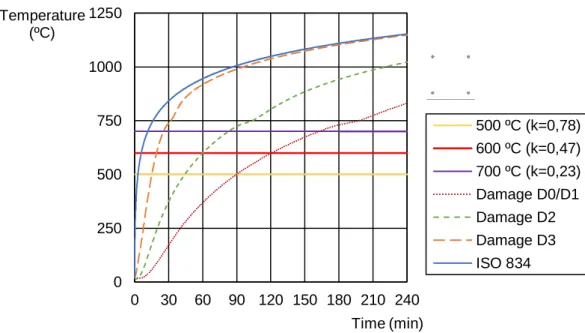
Although using the standard fire curve may not be very accurate, in this dissertation it is used the fire curve ISO 834 for the numerical analysis. Using the ISO 834 simplifies the models because there are not considered different temperature evolutions in different elements in the reinforced concrete structures. This consideration will also lead to an overlap between the damage caused by the seismic action and the fire. The numerical simulations developed in this dissertation
22 maybe do not completely correspond to a real situation but can serve as a preliminary study to see the impact of different typologies of damage in reinforced concrete structures.
23
3. Materials thermal and mechanical
properties at elevated temperatures
3.1. Concrete thermal properties
The concrete properties change with the temperature. In this Chapter there will be presented the concrete thermal properties such as the thermal elongation, specific heat, density and thermal conductivity.
3.1.1.
Thermal elongation
The following equations 3.1 and 3.2 can be used to obtain the thermal strain εc (θ) of concrete with reference to the length at 20 ºC [30]:
Siliceous aggregates: εc (θ) = -1,8 × 10⁻⁴ + 9 × 10⁻⁶ θ + 2,3 × 10⁻¹¹θ3 for 20 ºC ≤ θ ≤ 700 ºC εc (θ) = 14 × 10-3 for 700 ºC < θ ≤ 1200 ºC (3.1) Calcareous aggregates: εc (θ) = -1,2 × 10⁻⁴ + 6 × 10⁻⁶ θ + 1,4 × 10⁻¹¹θ3 for 20 ºC ≤ θ ≤ 805 ºC εc (θ) = 12 × 10-3 for 805 ºC < θ ≤ 1200 ºC (3.2)
24 In the Figure 3.1 is represented the variation of the thermal elongation with temperatures for siliceous and calcareous aggregate concrete.
3.1.2.
Specific heat
The specific heat cp(θ) of siliceous and calcareous dry concrete (u = 0%) can
be obtained by equation 3.3 [30]: Cp (θ) = 900 (J/kg.K) for 20 ºC ≤ θ ≤ 100 ºC Cp (θ) = 900 + (θ -100) (J/kg.K) for 100 ºC < θ ≤ 200 ºC Cp (θ) = 1000 + (θ -200)/2 (J/kg.K) for 200 ºC < θ ≤ 400 ºC Cp (θ) = 1100 (J/kg.K) for 400 ºC < θ ≤ 1200 ºC (3.3)
The specific heat and the peaks of specific heat are represented in Figure 3.2. For other moisture contents is acceptable to use a linear interpolation [30].
Cp,peak = 900 J/kg.K for moisture content of 0 % of concrete weight
Cp,peak = 1470 J/kg.K for moisture content of 1,5 % of concrete weight
Cp,peak = 2020 J/kg.K for moisture content of 3,0 % of concrete weight
Figure 3.1 –Total thermal elongation of concrete [30].
0 2 4 6 8 10 12 14 16 0 200 400 600 800 1000 1200 (Δl/l)c(10-3) T [ºC] Siliceous aggregate Calcareous aggregate
25
3.1.3.
Density
The variation of density with temperature is influenced by water loss and is defined by the equation 3.4 [30].
ρ(θ) = ρ(20ºC) for 20ºC ≤ θ ≤ 115ºC ρ(θ) = ρ(20ºC).(1 - 0,02(θ – 115)/85) for 115ºC < θ ≤ 200ºC ρ(θ) = ρ(20ºC).(0,98 - 0,03(θ – 200)/200) for 200ºC < θ ≤ 400ºC ρ(θ) = ρ(20ºC).(0,95 - 0,07(θ – 400)/800) for 400ºC < θ ≤ 1200ºC (3.4)
3.1.4.
Thermal conductivity
The thermal conductivity λc of concrete is defined between two different values,
upper limit value and lower limit value.
Figure 3.2 – Specific heat, as function of temperature at 3 different moisture contents [30].
0 0.2 0.4 0.6 0.8 1 1.2 1.4 1.6 1.8 2 2.2 0 200 400 600 800 1000 1200 cp(θ) [kJ/kgºK] T [ºC] u=3% u=1,5% u=0%
26 The upper limit of thermal conductivity λc of normal weight concrete can be
obtained with the equation 3.5 [30]:
λc = 2 – 0,2451 (θ/100) + 0,0107 (θ/100)2 W/m K for 20ºC ≤ θ ≤ 1200ºC
(3.5)
Where θ is the concrete temperature.
The lower limit of thermal conductivity λc of normal weight concrete can be
obtained with the equation 3.6 [30]:
λc = 1,36 – 0,136 (θ/100) + 0,0057 (θ/100)2 W/m K for 20ºC ≤ θ ≤ 1200ºC
(3.6)
Where θ is the concrete temperature.
In the Figure 3.3 is represented the variation of the upper limit and lower limit of thermal conductivity with temperature [30].
Figure 3.3 – Thermal conductivity of concrete, (1) upper limit, (2) lower limit [30].
0 0.2 0.4 0.6 0.8 1 1.2 1.4 1.6 1.8 2 0 200 400 600 800 1000 1200 λc [W/m.K] T [ºC] Upper limit Lower limit
27
3.2. Steel thermal properties
The steel properties change with the temperature. In this Chapter there will be presented the steel thermal properties such as the thermal elongation, specific heat and thermal conductivity.
3.2.1.
Thermal elongation
The thermal elongation of steel Δl/l is defined from the following equations. The variation of the thermal elongation with temperature is represented in Figure 3.4 [30] [31]. For 20ºC ≤ θa < 750ºC: Δl/l = 1,2 × 10⁻⁵ θ a + 0,4 × 10⁻⁸θa2 – 2,416 × 10-4 (3.7) For 750ºC ≤ θa ≤ 860ºC: Δl/l = 1,1 × 10⁻² (3.8) For 860ºC < θa ≤ 1200ºC: Δl/l = 2 × 10⁻⁵ θ a – 6,2 × 10⁻³ (3.9) Where: l is the length at 20ºC;
Δl is the temperature induced elongation;
28
3.2.2.
Specific heat
The specific heat of steel ca is defined from the following equations. The
variation of the specific heat with temperature is represented in Figure 3.5 [31].
For 20ºC ≤ θa < 600ºC: Ca = 425 + 7,73 × 10⁻¹θa – 1,69 × 10⁻³ θa2 + 2,22 × 10⁻⁶θa3 J/kgK (3.10) For 600ºC ≤ θa < 735ºC: Ca = 666 + 13002/(738 - θa) J/kgK (3.11) For 735ºC ≤ θa < 900ºC: Ca = 545 + 17820/(θa - 731) J/kgK (3.12) For 900ºC ≤ θa ≤ 1200ºC: Ca =650 J/kgK (3.13)
Figure 3.4 – Thermal elongation of carbon steel as function of the temperature [30] [31].
0 2 4 6 8 10 12 14 16 18 20 0 200 400 600 800 1000 1200 (Δl/l)s(10-3) T [ºC]
29
3.2.3.
Unit mass
The unit mass of steel ρa can be independent of the steel temperature. The
value that can be used is the following [31]: ρa = 7850 kg/m3
3.2.4.
Thermal conductivity
The thermal conductivity of steel λa is defined from the following equations
and is represented in Figure 3.6 [31].
λa = 54 – 3,33 × 10⁻² × θa W/mK for 20ºC ≤ θa < 800ºC (3.14)
λa = 27,3 W/mK for 800ºC ≤ θa ≤ 1200ºC
(3.15)
Figure 3.5 – Specific heat of carbon steel as a function of the temperature [31].
0 1000 2000 3000 4000 5000 0 200 400 600 800 1000 1200 Specific heat [J/kg.k] T [ºC]
30
3.3. Concrete mechanical properties
Numerical values of strength and deformation properties presented in this section are based on a steady and transient state tests and sometimes a combination of both. The materials models presented are only applicable for heating rates between 2 and 50 K/min because the creep effects are not explicitly considered [30].
For uniaxial stressed concrete at elevated temperatures, the strength and deformation properties shall be obtained from the stress-strain relationships presented in Figure 3.7. The stress-strain relationships are defined by two parameters [30]:
• The compressive strength fc,θ
• The strain εc1, θ corresponding to fc,θ
The values for the two mentioned parameters are presented in Table 3.1 as a function of concrete temperatures. A linear interpolation can be used for intermediate values of temperature [30].
00 10 20 30 40 50 60 20 200 400 600 800 1000 1200 Thermal conductivity [W/mK] T [ºC]
31
Table 3.1 – Values for the main parameters of the stress-strain relationships of normal weight concrete with siliceous or calcareous aggregates concrete at elevated temperatures [30].
The tensile strength of the concrete should normally be ignored (conservative approach). In the case of the necessity of considering the tensile strength the following expression can be used [30]:
fck,t (θ) = kc,t (θ) fck,t (3.16)
Concrete temperature
θ
Siliceous aggregates Calcareous aggregates fc,θ / fck εc1,θ εcu1,θ fc,θ / fck εc1,θ εcu1,θ [ºC] [-] [-] [-] [-] [-] [-] 1 2 3 4 5 6 7 20 1,00 0,0025 0,0200 1,00 0,0025 0,0200 100 1,00 0,0040 0,0225 1,00 0,0040 0,0225 200 0,95 0,0055 0,0250 0,97 0,0055 0,0250 300 0,85 0,0070 0,0275 0,91 0,0070 0,0275 400 0,75 0,0100 0,0300 0,85 0,0100 0,0300 500 0,60 0,0150 0,0325 0,74 0,0150 0,0325 600 0,45 0,0250 0,0350 0,60 0,0250 0,0350 700 0,30 0,0250 0,0375 0,43 0,0250 0,0375 800 0,15 0,0250 0,0400 0,27 0,0250 0,0400 900 0,08 0,0250 0,0425 0,15 0,0250 0,0425 1000 0,04 0,0250 0,0450 0,06 0,0250 0,0450 1100 0,01 0,0250 0,0475 0,02 0,0250 0,0475 1200 0,00 - - 0,00 - -
Figure 3.7 – Mathematical model for stress-strain relationships of concrete under compression at elevated temperatures [30].
![Figure 3.2 – Specific heat, as function of temperature at 3 different moisture contents [30]](https://thumb-eu.123doks.com/thumbv2/123dok_br/18357431.890568/53.892.195.719.152.394/figure-specific-heat-function-temperature-different-moisture-contents.webp)
![Figure 3.4 – Thermal elongation of carbon steel as function of the temperature [30] [31]](https://thumb-eu.123doks.com/thumbv2/123dok_br/18357431.890568/56.892.175.707.140.405/figure-thermal-elongation-carbon-steel-function-temperature.webp)
![Figure 3.5 – Specific heat of carbon steel as a function of the temperature [31].](https://thumb-eu.123doks.com/thumbv2/123dok_br/18357431.890568/57.892.207.714.156.449/figure-specific-heat-carbon-steel-function-temperature.webp)
![Figure 3.6 – Thermal conductivity of carbon steel as a function of the temperature [31]](https://thumb-eu.123doks.com/thumbv2/123dok_br/18357431.890568/58.892.203.711.139.434/figure-thermal-conductivity-carbon-steel-function-temperature.webp)
![Table 3.2 – Reduction factors for stress-strain relationship of carbon steel at elevated temperatures [30] [31]](https://thumb-eu.123doks.com/thumbv2/123dok_br/18357431.890568/61.892.285.632.128.480/table-reduction-factors-stress-strain-relationship-elevated-temperatures.webp)