Most of the Brazilian bridges of federal road network are made of reinforced concrete and are more than 30 years old, with little information about the mechanical properties of their constitutive materials. Along the service life of these bridges much modiication occurred on vehicles load and geometry and in design standard. Many of them show signs of concrete and steel deterioration and their stability conditions are unknown. With the aim of contributing to the structural evaluation of reinforced concrete bridges it was decided to analyze the stresses in reinforced concrete bridge sections to verify the effects due to reinforcement corrosion and variation of the concrete Young modulus on the stress distribution regarding sev
-eral load patterns and cracking effects in a representative bridge of the Brazilian road network with different longitudinal reinforcement taxes and two concrete Young modulus, Ec and 0.5Ec, and with different percentage of reinforcement corrosion. The analysis considered two inite element models: frame and shell elements as well as solid elements. The results indicate that these variation effects are more signiicant in reinforcement bars than in concrete.
Keywords: concrete bridges; reinforcement corrosion; stresses distribution.
A maioria das pontes da malha de rodovias federais brasileiras é de concreto armado e tem idade superior a 30 anos, sendo escassas as in
-formações sobre seus materiais constituintes e suas características mecânicas. Ao longo da vida útil dessas pontes ocorreram alterações de capacidade de carga e geometria dos veículos da frota circulante e alterações dos trens-tipo para o dimensionamento dessas estruturas. Muitas delas apresentam sinais perceptíveis de deterioração, tanto do concreto quanto da armadura, e não se conhece o grau de comprometimento dessas estruturas. Este trabalho pretende contribuir para a avaliação estrutural das pontes de concreto armado através da análise da variação da distribuição de tensões no concreto e na armadura, decorrentes da variação do módulo de elasticidade do concreto e da redução da taxa geométrica de armadura longitudinal por corrosão, em uma ponte representativa do estoque de pontes existentes. A análise foi feita com a utili
-zação de dois modelos em elementos initos, um com elementos de barras e cascas e outro com elementos sólidos, nos quais foram simuladas variações no módulo de elasticidade do concreto e diferentes condições de corrosão da armadura longitudinal das longarinas. Os resultados obtidos indicam que os efeitos da variação do módulo de elasticidade do concreto e da taxa geométrica de armadura são mais signiicativos nas tensões na armadura que no concreto.
Palavras-chave:pontes de concreto; corrosão da armadura; distribuição de tensões.
Reinforced concrete bridges: effects due to corrosion
and concrete young modulus variation
Pontes de concreto armado: efeitos da corrosão e
da variação do módulo de elasticidade do concreto
P. T. C. MENDES a
M. L. T. MOREIRA b
P. M. PIMENTA c
a Universidade Federal do Piauí, Depto. de Estruturas, Centro de Tecnologia, Coordenador de Engenharia Civil – NOVAFAPI, [email protected] ,
Campus da Ininga – Teresina – PI - Brasil CEP 64.049-550.
b Universidade Federal do Piauí, Depto. de Estruturas, Centro de Tecnologia, [email protected] , Campus da Ininga – Teresina – PI – Brasil
CEP 64.049-550.
c Universidade de São Paulo, EPUSP, [email protected] , Av. Prof. Almeida Prado, Trav. 2, 83, Cidade Universitária – São Paulo – SP – Brasil
CEP 05.508-900.
Abstract
1. Introduction
The research developed by Mendes [ 1 ] with information about 5.619 Brazilian bridges belong to Brazilian Federal Roads net
-work allowed them to be characterized by age, dimension and the number of spans, structural systems, standard vehicle-load and the stability and durability conditions. The majority of these bridges are more than 30 years old, with no or little informa
-tion about the mechanical characteristics of their materials. The changes occurred over time in the capacity and the geometry of the loads in the leet of vehicles circulating, as well as the ind
-ing of the perceptible signs of the deterioration, both concrete as well as reinforcement of the bridges, conducted to an evalu
-ation of the distribution of the stresses in the cross sections of the reinforced concrete bridges considering the effects of the variation of the module of elasticity of concrete and of the rein
-forcement corrosion.
The aim of this work is to contribute for structural evaluation in the reinforced concrete bridge through the analysis of the variation in the distribution of stresses in the concrete and in the reinforce
-ment, resulting from the variation of the module of the elasticity of the concrete and of the reduction in the geometric longitudinal reinforcement ratio from corrosion, in a representative bridge from the stock of existing bridges.
In this work, a bridge with representative span and cross sec
-tion existent on the Brazilian Federal Roads were analyzed, supposing different longitudinal reinforcement ratios, different configurations of reinforcement corrosion in each case and two values for the module of the elasticity of the concrete, Ec and 0.5Ec . The value of Ec was determined with the expression of NBR6118 [ 3 ] supposing a concrete with fck = 18.0 MPa. Due to the unknown real value of the strength characteristics
of the older bridges and to consider the effect of the long-term deformation, opted to also consider the module of elasticity as half of Ec.
1.1 Justiication of the adopted model
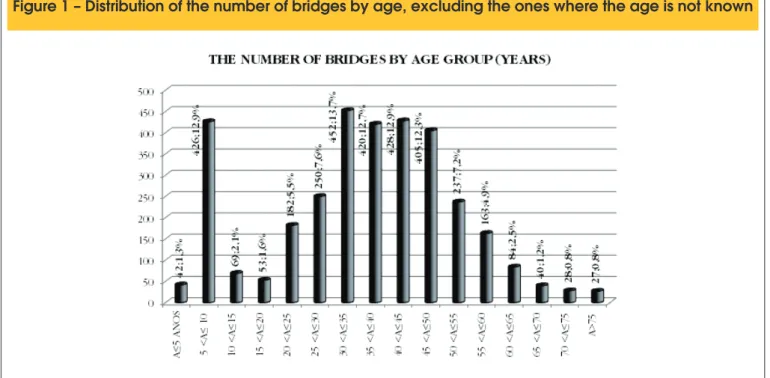
In Mendes [ 1 ] the distribution of bridges on the Federal roads by age group was obtained, highlighting the high number of bridges (41.2%) with unknown ages (Figure 1). Admitting that this sample is representative to the set, 70% of the bridges is more than 30 years old, from which naturally exists a signiicant growth in the pathologies [ 2 ]. It should be noted, however, that the bridges with unknown ages are probably the oldest ones, which will increase the percentage with more than 30 years old.
The large number of bridges for which are unknown (or not aware) the year of the construction constitutes only one sample of the dif
-iculties found for a more detailed analysis of the existent situation and an evidence of little importance given to the register and treat
-ment of the information.
Of the existing bridges on the Brazilian Federal Roads, 1,588 bridges had their structural systems not informed. Excluded bridg
-es for which the structural system was not informed, 98% of the bridges are made of reinforced or prestressed concrete, in beam, slab or arc model (Figure 2).
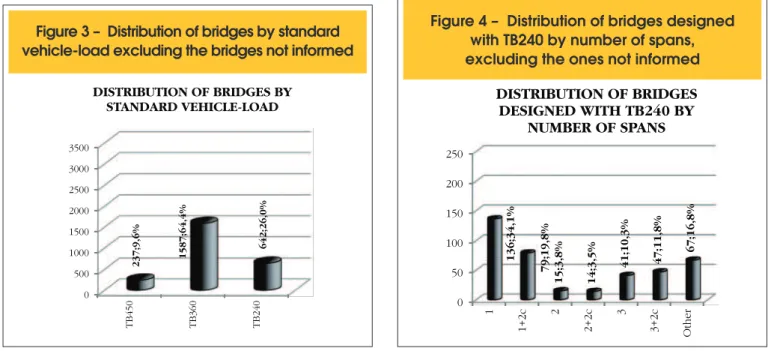
From the total of bridges registered, 3,153 of them the vehicle-load adopted in the structural analysis is unknown (corresponding to 56% of the total number of bridges). Among the bridges which the load is known, 642 were projected with standard vehicle-load of 240 KN (corresponding to 64%) and 237 were projected with standard vehicle-load of 450 KN (corresponding to 9.6%) (Fig
-ure 3). Probably most of non-informed bridges were analyzed with a 240 KN standard vehicle-load.
rior to 30.0 m and of these, 53.9% have only one span. Consider
-ing all the informed bridges, for all the standard vehicle-load, the percentage is practically the same (50%).
2. Characterization of models
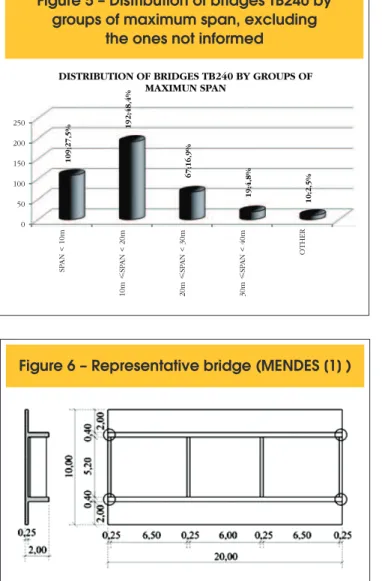
In reason to the exposed, the representative adopted bridge for analysis is in simply supported beam by reinforced concrete, with a span of 20.0 m and with cross section dimensions according to Among the 642 bridges projected with the 240 KN standard ve
-hicle-load, there were no records of the spans for 243 of them. Figure 4 presents a distribution of the 399 bridges projected with 240 KN standard vehicle-load, by the number of spans, in which 54% of them are simply supported beam.
Among the 399 bridges projected with 240 KN standard vehicle-load with the number of spans known, two had the values of the spans not informed. Figure 5 presents the distribution of the 397 bridges projected with 240 KN standard vehicle-load, by bands of maximum spans emphasizing that 93% have maximum span infe
-Figure 2 – Distribution of the number of bridges by its structural system, excluding the bridges not informed
Figure 3 – Distribution of bridges by standard
vehicle-load excluding the bridges not informed
0 500 1000 1500 2000 2500 3000 3500
TB450 TB360 TB240
237;9,6% 1587;64,4%
642;26,0%
DISTRIBUTION OF BRIDGES BY STANDARD VEHICLE-LOAD
Figure 4 – Distribution of bridges designed
with TB240 by number of spans,
excluding the ones not informed
0 50 100 150 200 250
1
1+2c
2
2+2c
3
3+2c Other
136;34,1%
79;19,8%
15;3,8% 14;3,5%
41;10,3% 47;11,8%
67;16,8%
DISTRIBUTION OF BRIDGES
DESIGNED WITH TB240 BY
for each of the inite elements constituent to the model. For un
-cracked section was considered as a whole with perfect adher
-ence between representative elements of concrete and the steel bars. For cracked section, the height of the neutral axis was estimated and the crack of the section was simulated with the removal of the concrete elements below the neutral axis in the vicinity of the cracks and in the other sections remained in the same conditions as in uncracked section.
2.2 Modulus of elasticity of concrete and steel
For the analysis of the models a module of elasticity on the con
-crete Ec = 23.8 GPa was adopted corresponding to the suggested value in the NBR 6118 [ 3 ].
Due to the scarcity of information relative to the mechanical char
-acteristics of the concrete used on these bridges, it was chosen to analyze them considering the module of elasticity of the cor
-responding concrete at 50% of the Ec value with the objective of evaluating the inluence of this factor in the distribution of the con
-crete and steel stresses. The module of elasticity of the steel was considered Es = 210.0 GPa.
Figure 6. For analysis effect concrete with fck = 18.0 MPa was ad
-mitted and reinforcement constituted of steel CA24 or CA50.
2.1 Computational models
The SAP2000-V11 program was used for the numerical evalu
-ation of the bridge behavior. The irst model consisted in the discretization of beams with inite elements of bar and the slabs with inite elements of shell (B-S), according to Figure 7. In this model, under bending moments acting on the longitudinal beams, the stresses on the concrete and in the reinforcement were ob
-tained from the admission of Navier’s hypothesis in maintenance of the plane section, in uncracked and cracked cross section, considering the resulting tensile in the reinforcement situated in its center of gravity. In the second model, the constituents of the superstructure of the bridge were discretizated with solid inite elements (SOL) representative of concrete and the different re
-inforced bars, with their mechanical characteristics, according to Figure 8. In this case the stresses in the concrete and in several bars of the reinforcement were provided directly by the program
Figure 5 – Distribution of bridges TB240 by
groups of maximum span, excluding
the ones not informed
0 50 100 150 200 250
SP
AN < 10m
10m
≤
SP
AN < 20m
20m
≤
SP
AN < 30m
30m
≤
SP
AN < 40m
OTHER
109;27,5%
192;48,4%
67;16,9%
19;4,8% 10;2,5% DISTRIBUTION OF BRIDGES TB240 BY GROUPS OF
MAXIMUN SPAN
Figure 6 – Representative bridge (MENDES [1] )
Figure 7 – Model with finite elements of bars
and shells (MENDES [ 1 ])
Figure 9 – Distribution of bars in the cross section of the longitudinal beam (MENDES [1] )
(a)
ρ1=3,78%
(c)
ρ3=2,68% (b)
ρ2=3,22%
(d)
ρ4=1,63%
Figure 10 – Distribution of bars in the cross section of the longitudinal beam, with 40%
of corrosion in the first layer of (MENDES [1] )
(a) ρ1=3,56%
(c) ρ3=2,46% (b)
ρ2=3,00%
(d) ρ4=1,41%
Figure 11 – Distribution of bars in the cross section of the longitudinal beam, with 100%
of corrosion in the first layer (MENDES [1] )
(a) ρ1=3,23%
(c) ρ3=2,12% (b)
ρ2=2,67%
2.3 Variation in the geometric reinforcement ratio
The geometric ratio of the longitudinal reinforcement of the beams was considered with the values of ρ1 = 3,78%, ρ2 =
3,22%, ρ3 = 2,68% and ρ4= 1,63%, corresponding to the pos
-sibility of details with the CA24 and the CA50 steel to various processes of design, according to Figure 9.
2.4 Conigurations of corrosion
Taking into account the most frequently coniguration of corrosion of the longitudinal reinforcement corresponds to the corrosion of the low
-er level of the bars, one opted to admit the reduction of the section of the bars in this layer in 40%and 100% according to Figures 10 and 11.
2.5 Loads
To analyze the designed bridges for the 240 KN standard ve
-hicle-load (TB240), it was considered the dead loads and the 360 KN standard vehicle-load (TB360) of NB6 [ 4 ] and 450 KN standard vehicle-load (TB450) of NB6 [ 5 ], including the effect of the impact through the coeficient of impact φ.
3. Results of the analysis
3.1 Compressive stresses on
the concrete – cracking effect
For the models with elements of bar and shell (B-S), the maxi
-mum stress on the concrete , considered uniform along the width and the tensile stress in the reinforcement, determined in its center of gravity and both varying linearly along the height were obtained from the maximum bending moment and the geo
-metric characteristics of the cross section [ 6 ].
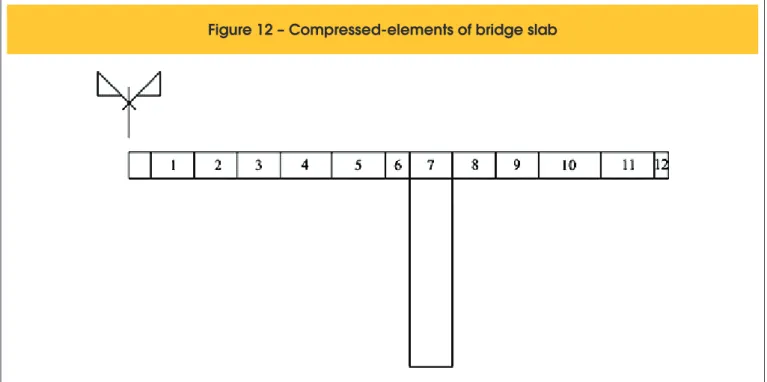
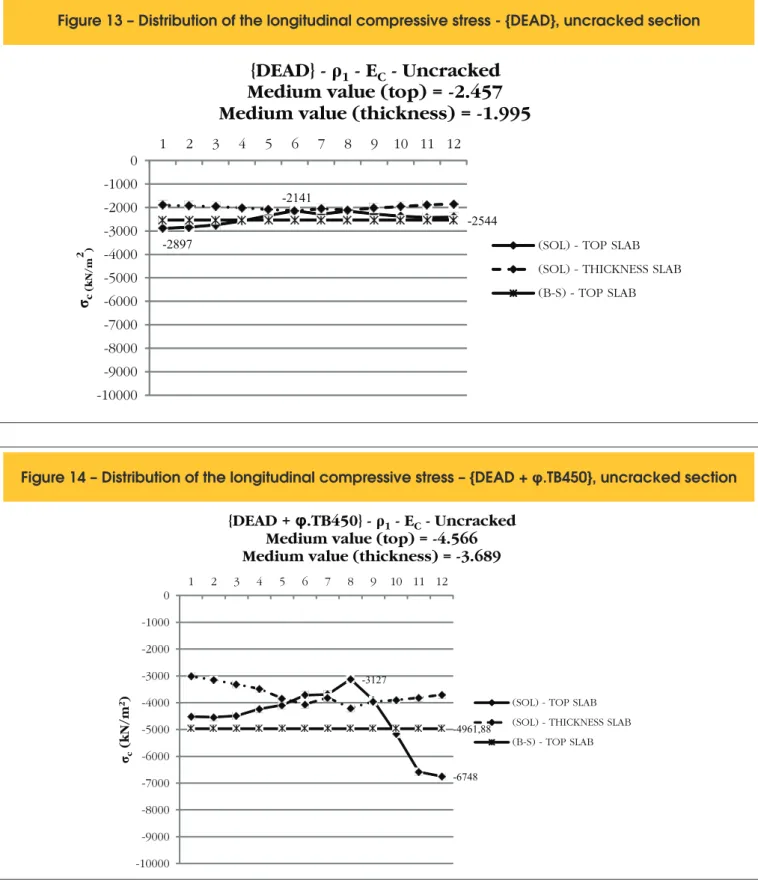
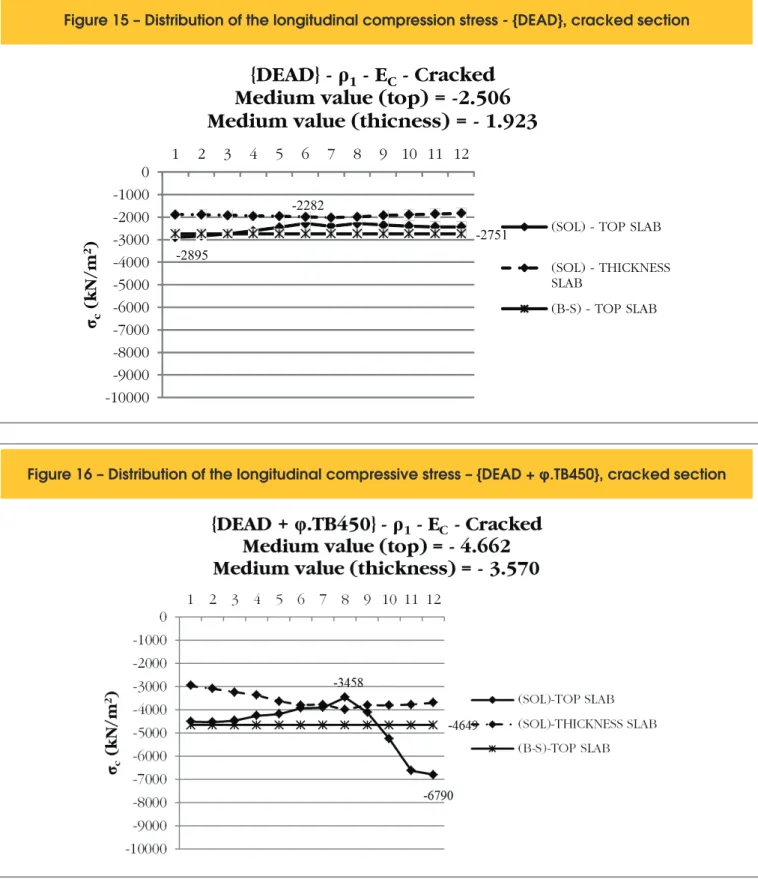
In the model with solid elements, the longitudinal compression stress on the top of the lange varies considerably along the width of the lange, in the center of the elements from 1 to 12 indicated in Figure 12, depending on the type of applied load, as indicated in Figures 13 and 14 for load situations {DEAD} and {DEAD + φ.TB450} in uncracked section and Figures 15 and 16 in cracked section.
It is observed for the load {DEAD} that the maximum value of longitudinal compression stress on the top of the lange is 2,897 KN/m2 or 2.90 MPa (Figure 13), obtained with the uncracked
section, and that in the most unfavorable load type, correspond
-ing to the load combination {DEAD + φ.TB450}, the maximum value of longitudinal compression stress on the top of the lange is 6,790 KN/m2 or 6.79 MPa (igure 16), obtained with the
cracked section. Therefore the maximum longitudinal compres
-sion stress varies between 2.90MPa and 6.79 MPa, with a sec
-tion considered uncracked and cracked respectively.
It seems that the maximum compressive stress suffers an in
-crease of 134.1% among the two extreme situations analyzed – only load {DEAD} and uncracked section and load {DEAD + φ.TB450} with cracked section. However, considering the con
-crete with fck = 18.0 MPa the compressive stress varies from 16.1% to 37.7% of the characteristic compressive strength of concrete and from 22.6% to 52.8% of the design compressive strength of concrete. Considering the medium value on the top of the lange these percentages become from 13.6% to 25.9% of the characteristic compressive strength of concrete and from 19.0% to 36.3% of the design compressive strength of concrete, little signiicant take in account the strength of the material.
3.2 Compressive stress in
concrete – corrosion effect
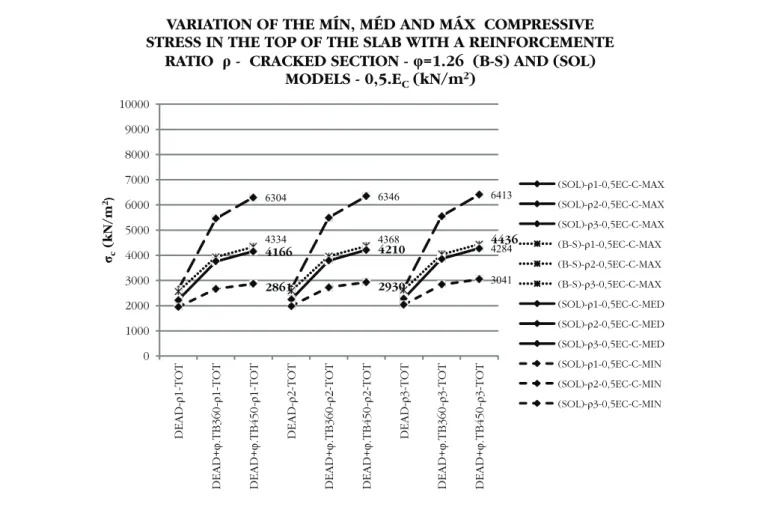
Figures 17 and 18 present stress values of minimum, medium and maximum compressive stress on the top of the lange for each of the following situations:
n Geometric reinforcement ratio equal to ρ1 = 3.78%, ρ2 = 3.22%
and ρ3 = 2.68% according to Figure 9;
n Modulus of elasticity of concrete equal to Ec and 0.5.Ec;
n Cracked section;
n Models with bar and shell elements (B-S) and models with solid elements (SOL).
Figure 13 – Distribution of the longitudinal compressive stress - {DEAD}, uncracked section
-2897
-2141
-2544
-10000
-9000
-8000
-7000
-6000
-5000
-4000
-3000
-2000
-1000
0
1
2
3
4
5
6
7
8
9 10 11 12
σ
c (kN/m 2 ){DEAD} -
ρ1
-
E
C-
Uncracked
Medium value (top) = -2.457
Medium value (thickness) = -1.995
(SOL) - TOP SLAB
(SOL) - THICKNESS SLAB (B-S) - TOP SLAB
Figure 14 – Distribution of the longitudinal compressive stress – {DEAD +
φ
.TB450}, uncracked section
-3127
-6748 -4961,88
-10000 -9000 -8000 -7000 -6000 -5000 -4000 -3000 -2000 -1000 0
1 2 3 4 5 6 7 8 9 10 11 12
σc
(kN/m
2)
{DEAD +
φ
.TB450} -
ρ
1-
E
C-
Uncracked
Medium value (top) = -4.566
Medium value (thickness) = -3.689
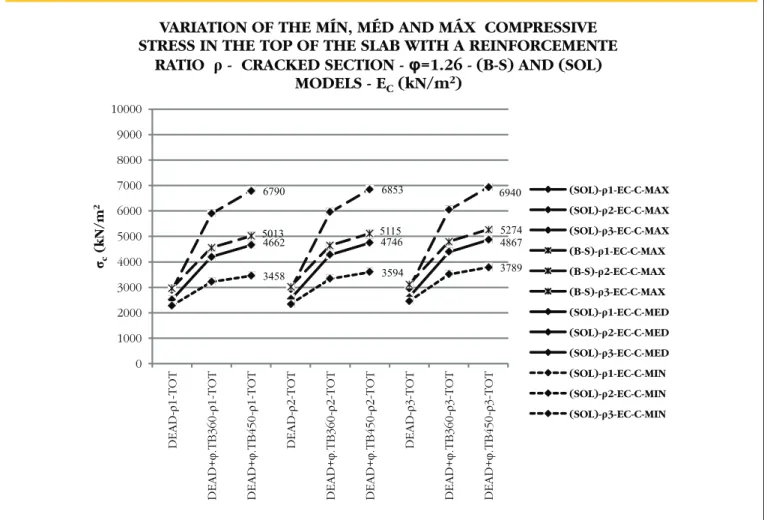
The variation of the reinforcement ratio of the section from ρ1 =
3.78% to ρ3 = 2.68% has little repercussion in the intensity of the
maximum compressive stress, whose values vary from 6.79 MPa
to 6.94 MPa, to the same modulus of elasticity of concrete Ec. A reduction of the modulus of elasticity of concrete from Ec to 0.5.Ec mobilizes a larger area of the compressive region of the section,
Figure 15 – Distribution of the longitudinal compression stress - {DEAD}, cracked section
-2895
-2282
-2751
-10000
-9000
-8000
-7000
-6000
-5000
-4000
-3000
-2000
-1000
0
1
2
3
4
5
6
7
8
9 10 11 12
σ
c(kN/m
2
)
{DEAD} -
ρ
1-
E
C-
Cracked
Medium value (top) = -2.506
Medium value (thicness) = -
1.923
(SOL) - TOP SLAB
(SOL) - THICKNESS SLAB
(B-S) - TOP SLAB
which reduces the maximum values of the stresses that vary from 6.30 to 6.41 MPa.
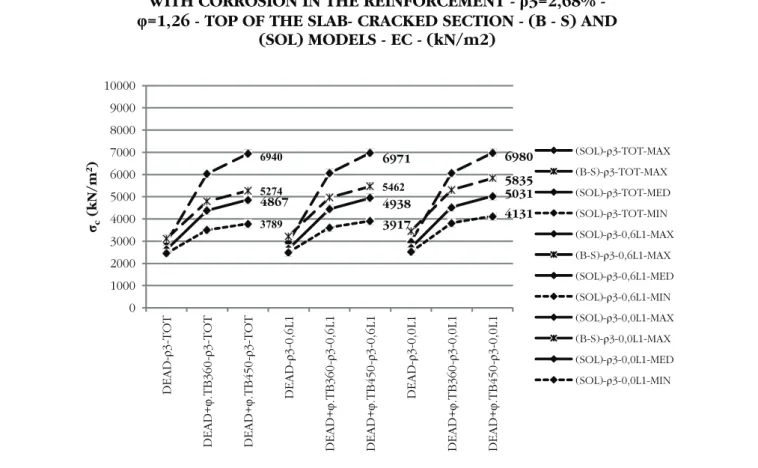
Figures 19 and 20 show the variations of minimum, medium and maximum compressive stresses in the top of the lange consid
-ering a longitudinal beam with geometric reinforcement ratio ρ3
= 2.68% variable with the corrosion, modulus of elasticity of con
-crete Ec and 0.5.Ec to the cracked section and load cases {DEAD}, {DEAD + φ.TB360} and {DEAD + φ.TB450}.
Considering the case of combination loads {DEAD + φ.TB450} the maximum compressive stress varies from 6.41 MPa (Figure 20) with non corroded reinforcement to 6.98 MPa (Figure 19) with the irst layer totally corroded, for modulus of elasticity of concrete 0.5.Ec and Ec respectively, which indicates little inluence on the corrosion of the reinforcement and modulus of elasticity of the con
-crete in the variation of intensity of these stresses.
3.3 The tensile stresses on the non corroded
reinforcement
In the solid element model (SOL), the tensile stresses are supplied
for each bar, which facilitates in the determination of the medium, maximum and minimum values, according to what is presented in Figures 21a and 22a, to the non cracked section, and 21b and 22b to the cracked section, corresponding to the loads {DEAD} and {DEAD + φ.TB450}.
One observe that the existence of cracks in the section completely changes the distributions of the stresses on the bars, making the more requested bar, that before the cracks belonged to the more distant layer of the neutral axis (L-1), becomes a bar situated in the nearest layer (L-7) arising from the stress redistribution due the presence of the crack and of the torsion effect of the positioning of the standard vehicle-load in the bridge. The deformation coming from the torsion provokes the warping of the section, invalidating the hypothesis of maintenance of the plane section.
Figure 23 presents the values of the medium stress on the rein
-forcement obtained with the models (B-S) and (SOL) in uncracked and in cracked sections, for the load {DEAD}. For cracked section the results obtained with the two models and different modules of elasticity are equivalent. For uncracked section, however, the values obtained with the two models are also equivalent but the
Figure 17 – Variation of minimum, medium and maximum longitudinal compressive stress in the top
of the slab versus
ρ
for (B-S) and (SOL) models, in cracked section, modulus of elasticity
E , with impact, caused by {DEAD}, {DEAD +
cφ
.TB360} and {DEAD +
φ
.TB450}
6790 6853 6940
5013 5115 5274
4662 4746 4867
3458 3594 3789
0 1000 2000 3000 4000 5000 6000 7000 8000 9000 10000 DEAD -ρ 1-TOT DEAD+ φ .TB360 -ρ 1-TOT DEAD+ φ .TB450 -ρ 1-TOT DEAD -ρ 2-TOT DEAD+ φ .TB360 -ρ 2-TOT DEAD+ φ .TB450 -ρ 2-TOT DEAD -ρ 3-TOT DEAD+ φ .TB360 -ρ 3-TOT DEAD+ φ .TB450 -ρ 3-TOT σc (kN/m 2
VARIATION OF THE MÍN, MÉD AND MÁX COMPRESSIVE
STRESS IN THE TOP OF THE SLAB WITH A REINFORCEMENTE
RATIO
ρ
- CRACKED SECTION -
φ
=1.26 - (B-S) AND (SOL)
MODELS -
E
C(kN/m
2)
(SOL)-ρ1-EC-C-MAX
(SOL)-ρ2-EC-C-MAX
(SOL)-ρ3-EC-C-MAX
(B-S)-ρ1-EC-C-MAX
(B-S)-ρ2-EC-C-MAX
(B-S)-ρ3-EC-C-MAX
(SOL)-ρ1-EC-C-MED
(SOL)-ρ2-EC-C-MED
(SOL)-ρ3-EC-C-MED
(SOL)-ρ1-EC-C-MIN
(SOL)-ρ2-EC-C-MIN
Figure 18 – Variation of minimum, medium and maximum longitudinal compressive stress in the top
of the slab versus
ρ
for (B-S) and (SOL) models, in cracked section, modulus of elasticity 0.5.E ,
cwith impact, caused by {DEAD}, {DEAD +
φ
.TB360} and {DEAD +
φ
.TB450}
6304 6346 6413
4334 4368 4436
4166 4210 4284
2861 2930 3041
0 1000 2000 3000 4000 5000 6000 7000 8000 9000 10000 DEAD -ρ 1-TOT DEAD+ φ .TB360 -ρ 1-TOT DEAD+ φ .TB450 -ρ 1-TOT DEAD -ρ 2-TOT DEAD+ φ .TB360 -ρ 2-TOT DEAD+ φ .TB450 -ρ 2-TOT DEAD -ρ 3-TOT DEAD+ φ .TB360 -ρ 3-TOT DEAD+ φ .TB450 -ρ 3-TOT σc (kN/m 2)
VARIATION OF THE MÍN, MÉD AND MÁX COMPRESSIVE
STRESS IN THE TOP OF THE SLAB WITH A REINFORCEMENTE
RATIO
ρ
- CRACKED SECTION -
φ
=1.26 (B-S) AND (SOL)
MODELS - 0,5.E
C(kN/m
2)
(SOL)-ρ1-0,5EC-C-MAX
(SOL)-ρ2-0,5EC-C-MAX
(SOL)-ρ3-0,5EC-C-MAX
(B-S)-ρ1-0,5EC-C-MAX
(B-S)-ρ2-0,5EC-C-MAX
(B-S)-ρ3-0,5EC-C-MAX
(SOL)-ρ1-0,5EC-C-MED
(SOL)-ρ2-0,5EC-C-MED
(SOL)-ρ3-0,5EC-C-MED
(SOL)-ρ1-0,5EC-C-MIN
(SOL)-ρ2-0,5EC-C-MIN
(SOL)-ρ3-0,5EC-C-MIN
variation of the modulus of elasticity has signiicant inluence in the stress values, greater as smaller the modulus of elasticity of the concrete. Due to the symmetry of the {DEAD} load, the solicitant efforts are distributed equally between the two longitudinal beams, being applied approximately in its cross sectional principal planes, which explains the similarity of the results found for models (B-S) and (SOL).
Figure 24 presents the values of medium stresses on the reinforce
-ment obtained from models (B-S) and (SOL) in uncracked section and in cracked section for the load {DEAD + φ.TB450}. The re
-sults present the same tendency, but the model (SOL) re-sults are greater (inferior to 10%) than the model (B-S) results, attributed to the torsion effect of the positioning in the standard vehicle-load. The convergence of the results obtained and presented in Figures 23 and 24 point to the pertinence of the models adopted.
In these igures markers in the form of asterisk relate to the models with bar and shell elements (B-S), while the markers in the form of a full rhombus relate to the models with solid elements (SOL). The full lines refer to uncracked section and the dashed lines to cracked section.
For the older bridges, built with CA-24 steel and reinforced ratio inferior to 2.68%, the reinforcement stress calculated in cracked section due to the actual standard vehicle-load TB450 exceeds the value of the design yield strength of reinforcement, signaling to the necessity of the strengthening structure.
3.4 Tensile stresses in the corroded reinforcement
Figures 25 and 26 present the minimum, medium and maximum tensile stresses in the bars of the reinforcement for the conditions described in 3.2, with reinforcement ratio of 2.68% in cracked sec
-tion. One observe the great difference between the reinforcement stresses for the (SOL) model compared with the difference obtained with the (B-S) model for each degree of reinforcement corrosion. For the considered reinforcement ratio, for no corroded reinforce
Figure 19 – Variation of minimum, medium and maximum longitudinal compressive stress in the top
of the slab versus
ρ
for (B-S) and (SOL) models, in cracked section, modulus of elasticity E ,
cwith impact, caused by {DEAD}, {DEAD +
φ
.TB360} and {DEAD +
φ
.TB450}, with reinforced corrosion
6940 5274 4867 3789 6971 5462 4938 3917 6980 5835 5031 4131 0 1000 2000 3000 4000 5000 6000 7000 8000 9000 10000 DEAD -ρ 3-TOT DEAD+ φ .TB360 -ρ 3-TOT DEAD+ φ .TB450 -ρ 3-TOT DEAD -ρ 3-0,6 L1 DEAD+ φ .TB360 -ρ 3-0,6 L1 DEAD+ φ .TB450 -ρ 3-0,6 L1 DEAD -ρ 3-0,0 L1 DEAD+ φ .TB360 -ρ 3-0,0 L1 DEAD+ φ .TB450 -ρ 3-0,0 L1
σ
c(kN/m
2)
VARIATION OF THE MÍN, MÉD E MÁX COMPRESSIVE STRESS
WITH CORROSION IN THE REINFORCEMENT -
ρ
3=2,68%
-φ
=1,26
-
TOP OF THE SLAB-
CRACKED SECTION -
(B -
S) AND
(SOL) MODELS -
EC -
(kN/m2)
(SOL)-ρ3-TOT-MAX
(B-S)-ρ3-TOT-MAX
(SOL)-ρ3-TOT-MED
(SOL)-ρ3-TOT-MIN
(SOL)-ρ3-0,6L1-MAX
(B-S)-ρ3-0,6L1-MAX
(SOL)-ρ3-0,6L1-MED
(SOL)-ρ3-0,6L1-MIN
(SOL)-ρ3-0,0L1-MAX
(B-S)-ρ3-0,0L1-MAX
(SOL)-ρ3-0,0L1-MED
(SOL)-ρ3-0,0L1-MIN
For the sections which the irst layer of the reinforcement presents a corrosion of 40%, the tensile stresses on the most requested bars of the (SOL) model, obtained with the standard bridge-loads TB360 and TB450, are superior to the design yield strength of re
-inforcement CA-24 steel, which start to happen with the stresses obtained with the (B-S) model for the standard bridge-load TB450. For the sections which the irst layer of the reinforcement presents a corrosion of 100%, the tensile stresses on the most requested bars of the (SOL) model, obtained with the standard bridge-loads TB360 and TB450, are superior to the design yield strength of re
-inforcement CA-24 steel, which start to happen with the stresses obtained with the (B-S) model for the standard bridge-load TB360 and TB450.
Considering the case of load {DEAD + φ.TB450} and the mod
-ulus of elasticity Ec the maximum tensile stress varies from 280.88 MPa, with the no corroded reinforcement, to 319.82 MPa with the irst layer totally corroded, which increases the stress intensity of 13.9% and decrease the reinforcement ratio of 20.9%, due to the total corrosion of the irst layer. With the modulus of elasticity 0.5.Ec, the maximum tensile stress var
-ies from 272.51 MPa, with a no corroded reinforcement, up to 352.73 MPa with the irst layer totally corroded, corresponding to 29.4%. In these cases, the maximum stress of the bars ex
-ceeds the corresponding value of the design yield strength of CA24 steel, even considering the entire reinforcement, evidenc
-ing that these bridges do not obey the requirements imposed by the actual standard bridge-load.
4. Conclusions
With the above, one could conclude that the compression stresses on the concrete, coming from bending moment, had been little in
-luenced by the cracking, by the variation of the modulus of elastic
-ity of concrete and by the corrosion of the irst layer of the reinforce
Figure 20 – Variation of minimum, medium and maximum longitudinal compressive stress in the top
of the slab versus
ρ
for (B-S) and (SOL) models, in cracked section, modulus of elasticity 0.5.E ,
cwith impact, caused by {DEAD}, {DEAD +
φ
.TB360} and {DEAD +
φ
.TB450}, with reinforced corrosion
6413 4436 4284 3041 6442 4551 4345 3149 6444 4778 4416 3321 0 1000 2000 3000 4000 5000 6000 7000 8000 9000 10000 DEAD -ρ 3-TOT DEAD+ φ .TB360 -ρ 3-TOT DEAD+ φ .TB450 -ρ 3-TOT DEAD -ρ 3-0,6 L1 DEAD+ φ .TB360 -ρ 3-0,6 L1 DEAD+ φ .TB450 -ρ 3-0,6 L1 DEAD -ρ 3-0,0 L1 DEAD+ φ .TB360 -ρ 3-0,0 L1 DEAD+ φ .TB450 -ρ 3-0,0 L1
σ
c(kN/m
2)
VARIATION OF THE MÍN, MÉD E MÁX COMPRESSIVE STRESS
WITH CORROSION IN THE REINFORCEMENT -
ρ
3=2,68%
-φ
=1,26 - TOP OF THE SLAB- CRACKED SECTION - (B - S) AND
(SOL) MODELS - 0.5EC - (kN/m2)
(SOL)-ρ3-TOT-MAX
(B-S)-ρ3-TOT-MAX
(SOL)-ρ3-TOT-MED
(SOL)-ρ3-TOT-MIN
(SOL)-ρ3-0,6L1-MAX
(B-S)-ρ3-0,6L1-MAX
(SOL)-ρ3-0,6L1-MED
(SOL)-ρ3-0,6L1-MIN
(SOL)-ρ3-0,0L1-MAX
(B-S)-ρ3-0,0L1-MAX
(SOL)-ρ3-0,0L1-MED
(SOL)-ρ3-0,0L1-MIN
for major worries. For the new bridges, the requirements to their durability require the adoption of concrete with very high character
-istic strength, which for the same levels of solicitations ensures a greater security reserve.
In relation to the tensile stress in reinforcement, on observe as ex
-pected a signiicant variation by the effect of cracking. The effect of the variation of the modulus of elasticity from Ec to 0.5.Ec in the cracked section, is not signiicant. The complete corrosion of the inferior layer of the reinforcement (L-1), with the reduction of the re
-inforcement ratio ρ3 = 2.68% in 20.9% raises the maximum stress
value in the bars in 13.9% for the modulus of elasticity of concrete Ec and in 29.4% considering a reduction in the modulus of elasticity of concrete to 0.5.Ec .
From distributions of the stresses on the bars of the reinforce
-ment in (SOL) model in the cracked section, one could con
-clude that an inadequate positioning of the deformation sen
-sors in the reinforcement might not capture a real situation of the stresses on the bars, on the occasion of load tests or in the monitoring of the structures. This numerical finding suggests the realization of laboratory and field tests that sensors are ad
-opted in all bars of the reinforcement of a same section, being adopted details of the execution that induces the occurrence of cracking in this section.
5. References
[01] MENDES, P. T. C.. Contribuições para um modelo de gestão de pontes de concreto aplicado à rede de rodovias brasileiras. Tese (Doutorado). Escola Politécnica da Universidade de São Paulo, São Paulo,
2009.
[02] ASSOCIATION FRANÇAISE DE GÉNIE CIVIL – AFGC. Concrete Design for a Given Structure Service Life. April, 2007. Paris, France.
[03] ASSOCIAÇÃO BRASILEIRA DE NORMAS TÉCNICAS. NBR 6118: Projeto de Estruturas de Concreto - Procedimento. Rio de Janeiro: ABNT, 2007.
Figure 21 – Distribution of the stress on the reinforcement bars in uncracked section
(a) and in the cracked section (b) for the solid element model, for {DEAD} load
A
B
Figure 22 – Distribution of the stress on the reinforcement bars in uncracked section (a) and
in the cracked section (b) for the solid element model, for {DEAD +
φ
.TB450} load
A
B
Rodoviárias. Rio de Janeiro: ABNT,1960. [05] ASSOCIAÇÃO BRASILEIRA DE NORMAS
TÉCNICAS. NB6: Carga Móvel em Ponte Rodoviária e Passarela de Pedestre. Rio de Janeiro: ABNT, 1982.
[06] MENDES, P. T. C.. A inluência da issuração no comportamento das vigas de concreto armado. 1983. Dis
![Figure 9 – Distribution of bars in the cross section of the longitudinal beam (MENDES [1] ) (a) ρ 1 =3,78% (c)ρ3 =2,68%(b)ρ2=3,22% (d)ρ4 =1,63%](https://thumb-eu.123doks.com/thumbv2/123dok_br/18859992.417763/5.892.58.847.4.1226/figure-distribution-bars-cross-section-longitudinal-beam-mendes.webp)