A
r
t
ic
le
0103 - 5053 $6.00+0.00
*e-mail: [email protected]
Study on the Interaction between Morin-Bi(III) Complex and DNA
with the use of Methylene Blue Dye as a Fluorophor Probe
Ali A. Ensafi*,a, Reza Hajiana and Sara Ebrahimib
aDepartment of Chemistry, Isfahan University of Technology, Isfahan, 84156-83111, Iran
bDepartment of Chemistry, University of Arak, Arak, 38156-879, Iran
Com base em nossa investigação, ambos os complexos, morin-Bi(III) e Morin, podem vincular-se ao DNA, embora a natureza da ligação vincular-seja diferente para cada um deles. Na previncular-sença e ausência do DNA, o morin-Bi(III) mostrou características espectrais diferentes, o que está de acordo com as observadas para outros intercaladores. Neste trabalho, a interação do complexo morin-Bi(III) com o DNA de timo de vitela foi investigada com o uso do azul de metileno (MB), como uma sonda de corante espectral e aplicação de espectrofotometria UV-Vis, espectroscopia de fluorescência e voltametria cíclica. A proporção de 2:1 do complexo de morin-Bi(III) foi calculada pela espectroscopia UV-Vis (método da razão molar). Observou-se que o sinal de fluorescência do complexo Bi(III)-morin é aumentado com a adição de DNA enquanto que o sinal do morin é diminuído com adição de DNA. O sinal de fluorescência do complexo-DNA desaparece pela adição de MB, o que confirma o deslocamento do complexo com MB. Os estudos de voltametria cíclica confirmam a reação de intercalação. Os resultados mostraram que somente o complexo de morin-Bi(III) pode intercalar-se em dupla hélice com o DNA. A constante aparente do complexo morin-Bi(III) com o DNA é de 2.8 × 10⁴ L mol-1, enquanto que o morin liga-se por um modelo de não-intercalação.
Based on our investigation, although both morin-Bi(III) complex and morin can bind to DNA, the nature of the binding was found to be different for each of them. In the presence and absence of the DNA, the morin-Bi(III) complex shows different spectral characteristics which agree with those observed for other intercalators. In this work, the interaction of morin-Bi(III) complex with calf thymus DNA was investigated with the use of methylene blue (MB) dye as a spectral probe and application of UV-Vis spectrophotometry, fluorescence spectroscopy and cyclic voltammetry. The 2:1 morin-Bi(III) complex ratio was calculated by UV-Vis spectroscopy (mole ratio method). The fluorescence signal of Bi(III)-morin complex is increased with DNA addition whereas the fluorescence signal of Morin is decreased with DNA addition. The fluorescence signal of the DNA-complex is quenched by addition of MB which confirms the displacement of the complex with MB. Cyclic voltammetry studies confirm the intercalation reaction. The results showed that only morin-Bi(III) complex can intercalate into the double helix of the DNA. The apparent binding constant of morin-Bi(III) complex with DNA is found to be 2.8 × 10⁴ L mol-1, while morin binds
in a non-intercalation mode.
Keywords: morin-Bi(III) complex, calf thymus DNA, methylene blue, UV-Vis spectrophotometry, cyclic voltammetry, fluorescence spectrometry, MCR-ALS.
Introduction
Interaction between DNA and drug molecules is of current general interest and importance,1,2 especially for the designing of new DNA-targeted drugs and the screening of these in vitro.
frequent components of major dietary constituents. In this context, it is generally considered that these flavonoids form coordination complexes with some essential trace metals, and it is believed that this is the active form of the compound, which is medicinally beneficial.10
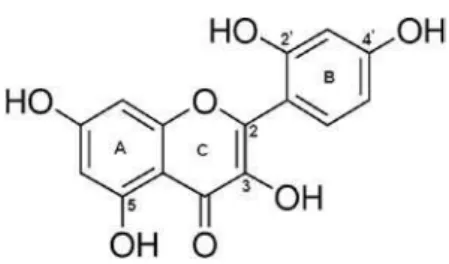
Morin (Figure 1) as a flavonoid and its complexes exhibit different antitumour activities which led us to consider the interaction of the two complexes and morin with calf thymus DNA. Because nucleic acid is usually the target of some antitumour reagents in the organism, these reagents react with DNA thereby changing the replication of DNA and inhibiting the growth of the tumor cell. There is, therefore, considerable interest in the design of small molecules which react at specific sites along the DNA strand as reactive models for protein-nucleic acid interactions, in developing new probes of DNA structures, as an aid to drug design and as tools in molecular biology.11-14
Barton et al.14 have studied the interaction of enantiomers of Ru(phen)33+ with various DNA; the results led them to the conclusion that there are two modes of interaction, intercalative and electrostatic binding. The ∆-isomer favors binding to the B-form DNA by intercalative fashion, while the Λ-isomer is not favored. They found that the intercalating ability appears to increase with the planarity of ligands.
Many techniques, such as UV-Vis spectrophotometry,15 fluorescence spectroscopy,16 circular17 and linear dichroism spectroscopy,18 mass spectrometry,19 X-ray crystallography20 and voltammetry21 have been used to study the binding properties between metal complexes and DNA.
As a planar dye molecule, methylene blue (MB) (Figure 2) has long been used for biological straining and diagnosis of disease including carcinoma.22-24 It is a phenothiazinyl dye, which is a kind of photosentizer drug molecule showing promising applications in photodynamic therapy (PDT) for anticancer treatment.25 The interaction of methylene blue
with DNA has been studied with various methods.26-30 Most studies indicated that (at low ionic strength buffer and low concentration of DNA) the major binding mode of MB with DNA was through intercalation.28-31 Moreover, MB has a low toxicity; data from material Safety Data Sheet of Vanderbilt Environmental Health & Safety (VEHS) show that MB is slightly hazardous in case of skin contact, eye contact, ingestion, and inhalation but there is no evidence which shows that MB is a carcinogenic compound.32
We were interested in understanding the correlation between different antitumour activities of morin and its complexes with the DNA binding mode and its affinity. Recently, bismuth has been used in medicines for the treatment of helicobacter pylori-induced gastritis. However, a number of toxic effects in humans have been attributed to bismuth compounds such as, nephropathy, osteoarthropathy, hepatitis, and neuropathology.33 As the use of bismuth in medicines is increasing, it has spread in the environment and the exposure of organisms to bismuth has increased.34
In this report we explore the interaction of the morin plus its complex (Bi-complex) with calf thymus DNA, using spectrophotometric, fluorimetric and cyclic voltammetry methods. The aim of this study is to find a relation between the antitumour properties of the complex and the mode of DNA binding. The results of the study are that morin binds in a non-intercalating mode while the complex binds by intercalation. MB has been used as a probe for comparison of the complex and its interaction with DNA. The study in this report offers an opportunity to understand how the structure of molecules affects their binding mode and binding affinity to DNA. This will help us design new complexes which have biological and antitumour activity.
Experimental
Reagents
All the chemicals were of analytical grade and were purchased from Aldrich. Doubly distilled water was used throughout.
Stock solution (1.0 × 10⁻³ mol L-1) of Bi(III) was prepared by dissolving 0.0485 g of Bi(III)-nitrate.5H2O in 0.1 mol L-1 HCl and diluted with water in a 100 mL volumetric flask.
A 1.0 × 10⁻³ mol L-1 MB solution was prepared daily by dissolving 0.0374 g methylene blue.3H2O in water and the solution was diluted to 100 mL with water in a 100 mL volumetric flask. The solution was kept in a refrigerator at 4 °C and in dark. More dilute solutions were prepared by serial dilution with water.
Figure 1. Molecular structure of morin.
A 1.0 × 10⁻³ mol L-1 morin solution was prepared daily by dissolving 0.0302 g morin.H2O in ethanol:H2O (1:1) and diluted to 100 mL with water in a 100 mL volumetric flask. The solution was kept in a refrigerator at 4 oC in dark. More dilute solutions were prepared by serial dilution with doubly distilled water.
Calf thymus DNA was used as received without further purification. Its concentration was determined spectrophotometrically using the molar coefficient value,
ε260 = 6600 L mol
-1 cm-1.35 A 1.76 × 10⁻⁴ mol L-1 DNA was
prepared by dissolving 0.010 g of calf thymus DNA in 0.010 mol L-1 acetate buffer and 0.05 mol L-1 sodium chloride solution (pH 3.2) in a 25 mL volumetric flask.
The pH of all solutions was adjusted with the acetate buffer (0.01 mol L-1, pH 3.2) in the presence of 0.05 mol L-1 sodium chloride.
Apparatus
Voltammetric measurements were carried out using a Metrohm instrument, Model 797 VA, computrace with stand three-electrodes containing a glassy carbon as a working electrode, a carbon rod as an auxiliary electrode and an Ag/AgCl (3.0 mol L-1 KCl) reference electrode.
UV-Vis absorption spectra were measured on an Agilent UV-Vis spectrophotometer, JASCO, using of 1.0 cm quartz cells.
All spectrofluorometry assays were made on a spectrofluorometer, JASCO, equipped with a xenon lamp and a 1.0 cm quartz cell. Both excitation and emission slits were set at 5 nm, and the scan rate at 500 nm min-1. A Pentium IV (2.0 MHz) computer controlled all of the settings and data processing.
The IR spectra within the range of 4000-500 cm-1 were made in KBr pellets on a FT–IR Paragon-1000 spectrophotometer (Perkin–Elmer).
A pH-meter (Corning, Model 140) with a double junction glass electrode was used to check the pH of the solutions.
All experiments were carried out at room temperature (25 ± 1 oC) in 0.01 mol L-1 acetate buffer solution, pH 3.2, containing 50 mmol L-1 KCl.
Synthesis of the morin-Bi(III) complex for IR spectroscopy
Stock solution (50 mL) of bismuth ions (1.0 × 10⁻² mol L-1) was added into 150 mL of hot saturated solution of morin in methanol (2 × 10⁻² mol L-1) and the result solution was diluted with water to a 1:1 MeOH/H2O ratio. The solution was stirred and the pH was fixed 3.2 with 0.1 mol L-1
NaOH solution. Then the mixture was heated to 60 °C for 1 h and left at room temperature for 24 h. The precipitate, after being washed several times with methanol:water (1:1) solution, was centrifuged and dried in air at room temperature.
Preparation of the glassy carbon electrode
The glassy carbon electrode surface was polished with 0.2 µm-alumina powder and then cleaned ultrasonically for 5 min in doubly distilled water. The electrode was then transferred into a blank buffer solution, and a continuous voltammetric scan with a scan rate of 50 mV s-1 was carried out.
Theory of MCR-ALS
Data obtained from the spectroscopic monitoring of the chemical system by changing pH can be gathered in a data matrix D(m×n)in which rows are the spectra recorded and columns are the different pH. In general, the goal of resolution methods36 is the decomposition of the data matrix D according to equation (1):
D = CST + E (1)
where Cis a m × k matrix, S is a n × k matrix, Eis a m ×
n matrix, k is the number of factors directly related to the chemical species or conformations present in different pH, i.e., k corresponds to the spectroscopically active species or conformations. Therefore, columns of C describe the concentration profiles for the k different species in the pH range and the rows of STmatrix describe the pure spectra for each one of these k components. Finally, Eis the matrix of residuals not explained by the multiplication of Cand ST.
To have a meaningful solution from the curve resolution decomposition, it is necessary to make some assumptions about the signals obtained such asbilinearity, nonnegativity, unimodality, and closure. One of the most interesting techniques is evolving factor analysis (EFA).37 Taking advantage of the evolutionary structure of the acquired data, evolving factor analysis provides an estimation of information (concentration profiles), concerning the windows of existence of every component in the mixtures existing at any pH during the process.
MCR-ALS is determination of the number of compounds in D. The number of compounds in Dcan be determined using PCA or can be known beforehand. Then, knowing the number of components initial estimates are calculated, for example a rough estimation of concentration profile by EFA. Using the estimate of C, the ST matrices are calculated under appropriately chosen constraints by a least squares:
S = (DTC)(CTC)−1 (2)
In the next step using the estimate of ST, calculate the Cmatrix under appropriately chosen constraints:
C = (DTS)(STS)−1 (3)
From the product of Cand STan estimate of the original data matrix, D is achieved. Then new concentration or spectral profiles estimated from previous estimation using least square. These alternative least squares (ALS) are repeated until the convergence criterion is achieved. When the relative difference in fit is below a threshold value, the optimization is finished.
Results and Discussion
Spectrophotometric studies
Interaction between morin and Bi(III)
The UV-vis absorption spectra of morin in the presence of Bi(III) (with increasing concentration) were examined in the acetate buffer solution (pH 3.2) containing 50 mmol L-1 KCl (Figure 3). Morin has two maxima bands; at 252 nm (benzoyl of ring A) and the other at 350 nm (cinnamoyl of ring B).39,40 By adding gradually Bi(III) ions into the morin solution at pH 3.2 the absorption intensity of these two bands decreased gradually, and a new absorption peak appeared at 433 nm. Moreover, the two isobestic points at 251 and 380 nm indicated that morin could form a complex with Bi(III) and the binding is homogeneous. There are two possible groupings on morin that can interact with Bi(III): the 2’-hydroxyl of ring B with the 1-oxo of ring C and 3 or 5-hydroxyls with the 4-carbonyl of ring C (Figure 1). The absorption peak at 350 nm has a slightly red shift (ca. 3 nm) and a new absorption peak at 433 nm emerged suggesting that Bi(III) has bonded with the ring B. The stoichiometry of the complex was determined using mole ratio method (Figure 4). The formation of a 2:1 ligand-metal complex extends the conjugated system, with the inclusion of the C rings, which leads to further molecular stabilization.41 Thus, the bonding of Bi(III) with ring C of morin produced
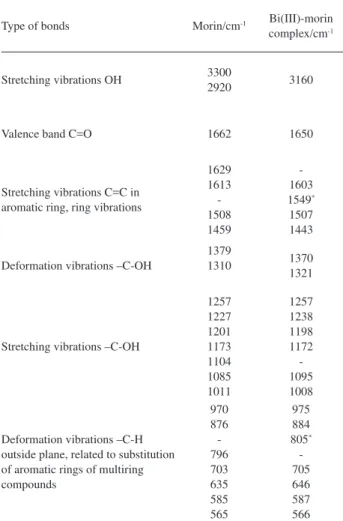
an electronic redistribution between morin and Bi(III) ions, which resulted in an extended 4 bond system. On this basis, the n-π* electronic transition of morin changed to a π-π* one, with a consequent decrease in energy as reflected by the appearance of a new peak at the longer wavelength (433 nm). This relationship is also in accord with previous literatures42-44. Infrared spectra have also been used to validate the proposed complex structure. Table 1 shows the position of the most important IR bands of morin and its complex with bismuth(III). The comparison of these two spectra with each other shows important spectral changes, notably in 1400-1700 cm-1. The position of ν(C=O) is diagnostic for the involvement of 4C=O chromophore in coordination. The complexation should lengthen the C–O bond in the carbonyl group and lessen the force constant, which, in turn, may shift the IR band of the carbonyl group towards a smaller wavenumber.45 On the complexation of morin with Bi(III) ion, a shift of ν(C=O) is observed from 1662 cm-1 for morin to 1653-1652 cm-1 (∆ν = 12 cm-1) for the complex. Hence, it may be assumed that the carbonyl group participates in binding the bismuth ion. Similar frequency values of this group are shown by the complexes of quercetin-5’-sulfonic acid with lanthanides, where the metal is bound via 3C–OH and 4C=O groups.46,47 In the spectra of the complex there also appear new bands due to the formation of the M–O bond. These are the bands of the frequencies 1550-1546, 811-805, 508-492 cm-1. The 1550-1546 cm-1 band is related to the formation of the chelate ring > C=O---M–O–.48
Concentration profiles of morin and morin-Bi(III) complex via pH
To investigate the presence of different forms of the ligand and its complexes in a range of pH and to estimate the concentration profiles of these species along pH, absorption spectra of solutions of ligand and complex Figure 3. Absorption spectra of morin in the presence of Bi(III) at different concentrations. Conditions: [Bi3+] = 0, 1.0, 2.0, 3.0, 4.0, 5.0, 6.0, 8.0, 10.0 and 50.0 µmol L-1 for curves 1-10, and C
morin = 20.0 µmol L
were recorded separately in a pH range of 2.0 to 9.0. The spectra were recorded in 0.5 nm intervals from 200 to 700 nm. The obtained data formed two matrices D and D’ for ligand and complex, respectively. Both of the matrices have the dimensions 1000 × 8, where rows are the number of wavelengths and columns are pH. After obtaining the experimental data a principal component analysis was
done on D and D’. The first two PCs from applying PCA on D and D’ explained 99.38% and 99.71% of the variation in the data matrices respectively, so we can estimate the presence of two chemical components in D and also in D’. This means that ligand has two different forms along pH variation. The same conclusion can be made for complex data matrices D’.
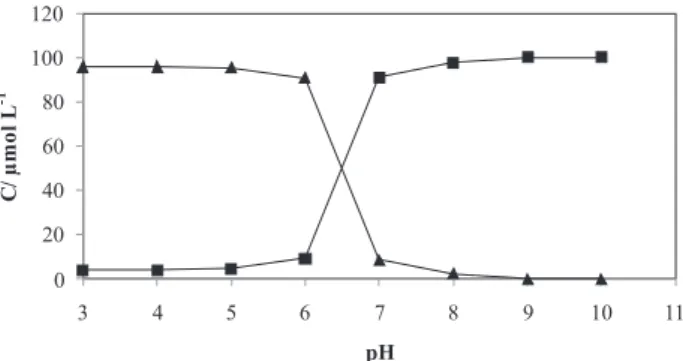
In order to find a relatively good estimation of concentration profiles and pure spectra we used MCR-ALS procedure. MCR-AlS starts with a rough estimation of concentration or spectral profiles and iteratively improves them. The better initial estimation for concentration profiles can be achieved by EFA. To have an estimation for spectral profiles we can use the spectra recorded at the lowest and the highest pH were we guess that the main component is one of the either forms of the ligand or complex. Figure 5 represents the initial estimation of concentration profiles by EFA for ligand (Figure 5a) and complex (Figure 5b).
By these initial estimations the MCR-ALS procedure were done by the nonnegativity, unimodality and closure as constraints applied on concentration profiles and nonnegativity on spectral profiles. For closure constraint the total concentrations of to forms of ligand or complex constrained to be equal initial analytical concentration of ligand and complex (100 µmol L-1). Figure 6 and Figure 7 illustrate the final results of MCR-ALS for ligand and complex, respectively.
Table 1. Position of the most important spectra bands in IR spectra of morin and its complex with bismuth (III)
Type of bonds Morin/cm-1 Bi(III)-morin complex/cm-1
Stretching vibrations OH 3300
2920 3160
Valence band C=O 1662 1650
Stretching vibrations C=C in aromatic ring, ring vibrations
1629 1613 -1508 1459
-1603 1549* 1507 1443
Deformation vibrations –C-OH
1379
1310 1370
1321
Stretching vibrations –C-OH
1257 1227 1201 1173 1104 1085 1011
1257 1238 1198 1172 -1095 1008
Deformation vibrations –C-H outside plane, related to substitution of aromatic rings of multiring compounds
970 876 -796 703 635 585 565
975 884 805* -705 646 587 566
Figure 4. Mole ratio plot of morin in the presence of Bi(III) at different concentrations. Conditions: [Bi3+] = 0, 1.0, 2.0, 3.0, 4.0, 5.0, 6.0, 8.0, 10.0, 20.0 and 50.0 µmol L-1, C
morin = 20.0 µmol L
-1 , HOAc-NaAc buffer (0.01 mol L-1, pH 3.2) plus 0.05 mol L-1 NaCl.
Interaction of morin-Bi(III) complex with ct-DNA
UV-Vis absorption spectra were obtained by titration of a 1.0 × 10⁻⁴ mol L-1 morin-Bi(III) complex solution with double strand DNA (ds-DNA) solution. The results are shown in Figure 8, shows a single absorption band of 433 nm for morin-Bi(III) complex in the absent of ct-DNA. Increasing the DNA concentration to the morin-Bi(III) complex cause decreasing the intensity of the absorption band. It is like the phenomenon yielded by the interaction between DNA and its typical intercalate.49
Based on the variations of absorbance at the spectral band, the binding constant, K of the complex-DNA can be obtained according to the following equation.50
A0 εG εG 1
––––––– = ––––––––– + ––––––––– –––––––– (4)
A–A0 εH-G–εG εH-G–εG K[DNA]
Where “A0” and “A” are the absorbance of the complex in the absence and presence of DNA, respectively, and εG and εH-G are their absorption coefficients, respectively. The result of fitting the experimental data with equation (4) is shown in Figure 9. It is suggested that the complex of morin with DNA is to be a kind of 1:1 complex. From a plot of A0/(A-A0) vs. 1/[DNA], the ratio of the intercept to the slope gives the binding constant, K = 2.8 × 10⁴ mol-1 L.
In order to clarify the portion of morin interacting with ct-DNA, the inclusion complex of MB-DNA was used for further study of the interaction site by spectroscopic method.
Interaction of MB with ct-DNA
Absorption spectra of the MB dye in the absence and presence of DNA (pH 3.2) showed a maximum at 662 nm (Figure 10). This absorption gradually decreased with the increasing concentration of ct-DNA and red shift is usually associated with molecular intercalation into the base stack of the ct-DNA.51 Those two observed spectral effects were attributed to a strong interaction between the electronic state of the intercalating chromophore and that of the DNA bases. The strength of this electronic interaction is expected to decrease as the third-order of the distance between the chromophore and the DNA bases.52 The large observed hypochromism during the interaction of the MB dye with the DNA, strongly suggest that the distance between the intercalated MB dye and the DNA bases is small. Thus, this is consistent with the rationalization that on intercalation of the MB dye into the DNA, the π electrons of MB dye Figure 6. Final concentration profiles of ligand species obtained by
MCR-ALS from estimated initial concentration profiles by EFA.
Figure 7. Final concentration profiles of complex species obtained by MCR-ALS from estimated initial concentration profiles by EFA.
Figure 8. Absorption spectra of morin-Bi(III) complex in the presence of ct-DNA at different concentrations. CDNA= 0, 29.3, 53.0, 80.0, 103.5 and 146.7 µmol L-1 for curves 1-6, and C
morin-Bi(III)= 100 µmol L -1 in HOAc-NaAc buffer (0.01 mol L-1, pH 3.2) plus NaCl.
Figure 9. The plot of (A0/A-A0) versus 1/[DNA]. Conditions: HAc-NaAc buffer (0.01 mol L-1, pH 3.2) plus NaCl, Bi(III) = 100 µmol L-1, C
combine with the π electrons of DNA’s bases, and the empty
π* orbital of the MB dye couple with the π orbital of the bases. This facilitates a decrease in the energy of the π-π* electron transition, which is reflected in the observed red shift. At the same time the empty π* orbital is partially filled by electrons, reducing the π-π* transition probability, and this contributes to the hypochromic effect discussed above.
Competitive interaction of morin with MB-ctDNA
A competitive interaction between morin and the MB-ctDNA system was observed by the addition of morin to a solution of methylene blue and DNA. As it is clearly shown (Figure 7), the intensity of the spectral band of MB-DNA at 662 nm gradually decreased with increasing morin concentration. Also a new peak at about 310-470 nm appeared which increased progressively in intensity. An isobestic point at 516 nm provides evidence that a new species was forming during the competitive interaction and that the reaction is homogebsorpneous. According to the observations, it seems that any exchange between morin with methylene blue bonded to DNA does not take place, because the molar absorption coefficient of free MB and MB-DNA are slightly different with each other. Therefore, a decrease in the absorbance intensity of MB may be due to the bonding of morin to DNA as a matrix effect. This phenomenon can be observed by comparing the maximum wavelengths of morin and morin-DNA (Figures 3 and 11). In addition unchanging in position of the band of morin in the presence and in the absence of DNA, suggest that morin has an electrostatic mechanism with the double helix of the DNA.
Competitive interaction of morin-Bi(III) complex with MB-ctDNA
The band intensity of MB-DNA at 662 nm gradually decreased with increasing concentration of morin-Bi(III) complex. This band almost shifted towards the blue end of
the spectrum with the appearance of a new peak at 415 nm, which increased progressively in intensity (Figure 12). This new band was the sum of the changing absorptions of the MB dye and morin-Bi(III) complex. An isobestic point at 516 nm provides evidence that a new species was formed during the competitive interaction and thus the reaction is homogeneous.
The maximum wavelengths of morin-Bi(II) complex in the presence and absence of DNA is different, indicating an intercalation mechanism. Addition of different amounts of morin-Bi(III) to MB-DNA causes change in the intensity and position of the bands, suggesting that the morin-Bi(III) complex intercalated into the double helix of the DNA.
Electrochemical studies
Electrochemical interaction of morin-Bi(III) complex with ctDNA
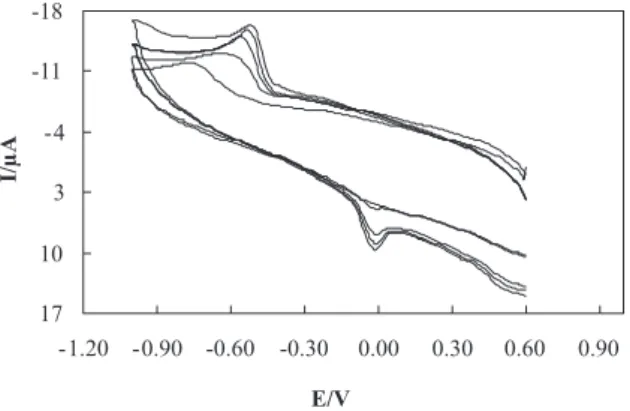
Typical CV (cyclic voltammetry) behavior of morin-Bi(III) complex in the absence and presence of DNA is shown in Figure 13. Addition of DNA to morin-Bi(III) Figure 10. Absorption spectra of methylene blue in the presence of DNA
at different concentrations. CDNA = 0.0, 14.4, 28.4, 41.9, 55.0, 67.7, 92.0 and 103.5 µmol L-1 for curves 1-8, and C
MB = 10 µmol L
-1 in HOAc-NaAc buffer (0.01 mol L-1, pH 3.2) plus 0.05 mol L-1 NaCl.
Figure 11. Absorption spectra of the competitive reaction between morin and methylene blue with DNA. Cmorin = 0.0, 2.0, 4.0, 6.0, 8.0, 10.0, 14.0 and 16.0 µmol L-1 for curves 1-8, C
MB =10.0 µmol L -1 and C
DNA = 20.0 µmol L -1 in HOAc-NaAc buffer (0.01 mol L-1, pH 3.2) plus 0.05 mol L-1 NaCl.
Figure 12. Absorption spectra of the competitive reaction between morin-Bi(III) and methylene blue with DNA. Cmorin-Bi(III) = 0.0, 1.6, 3.1, 4.5, 6.0, 7.5, 8.7, 10.0, 11.3 and 12.5 µmol L-1 for curves 1-10, C
solution causes the peak currents of the CV waves (reduction of morin-Bi(III)) to diminish considerably. Additionally the peak potential Epc shifted to more negative values (from –0.52 to –0.76 V vs. Ag/AgCl reference electrode) indicating that the action of morin-Bi(III) with DNA may be intercalation.53 The peak potential separations ∆Ep=|Epc-Epa| are beyond 200 mV indicating an irreversible redox process.
Electrochemical interaction of MB with ctDNA
A cyclic voltammogram of the MB dye probe (Figure 14) at a glassy carbon electrode exhibited cathodic and anodic peaks. The peak at approximately –0.42 V corresponds to the reduction of MB, and the one at –0.14 V corresponds to the oxidation of MB. As the concentration of ct-DNA was increased no new peak current were formed, but a decrease in peak currents for both reduction and oxidation occurred with the reduction peak changing more significantly than the oxidation one. This suggests that there is a difference between the binding properties of MB and its reduced form to DNA. A slightly positive potential shift was observed for the reduction peak of MB, which again suggests that the MB molecule has intercalated into the DNA.
Spectrofluorometry studies
Morin-Bi(III) and morin binding to DNA
The fluorescence signal of Morin-Bi(III) is ca. 498 nm when excited at 428 nm whereas the signal for morin alone is ca. 500 nm when excited at 348 nm. When the DNA solution was added to the morin-Bi(III) solution and to the morin alone solution, the fluorescence intensity for morin-Bi(III) complex increased, whereas that for the alone morin solution decreased (quenched fluorescence) when those exited at the conditions given. Figures 15 and 16 show the fluorescence spectra of morin-Bi(III) complex and morin, respectively in the presence and absence of calf thymus DNA. The stronger enhancement in fluorescence intensity of morin-Bi(III) complex may be largely due to the increase of the molecular planarity of the complex and the decrease of the collisional frequency of the solvent molecules with the complex which is caused by the planar aromatic group of the complex stacks between adjacent base pairs of the DNA. Increasing of the molecule’s planarity and decreasing of the collisional frequency solvent molecules with the complexes usually lead to emission enhancement. The binding of morin-Bi(III) to DNA leading to a marked Figure 13. Cyclic voltammograms of morin-Bi(III) complex in the
presence of different concentrations of DNA. CDNA = 0.0, 35.2, 52.8, 140.8 and 200.0 µmol L-1 for curves 1-5, and C
morin-Bi(III) = 100 µmol L -1 in HOAc-NaAc buffer (0.01 mol L-1, pH 3.2) plus 0.05 mol L-1 NaCl, scan rate 50 mV s-1.
Figure 14. Cyclic voltammograms of methylene blue in the presence of different concentrations of DNA. CDNA = 0.0, 17.6, 35.2 and 52.8 µmol L-1 for curves 1-4, and CMB = 50 µmol L-1 in HOAc-NaAc buffer (0.01 mol L-1, pH 3.2) plus 0.05 mol L-1 NaCl, scan rate 50 mV s-1.
Figure 15. Emission fluorescence spectra of morin-Bi(III) complex with the addition of DNA. CDNA = 0.0, 5.68, 11.0, 16.0, 20.7, 25.1, 29.3 and 37.1 µmol L-1 for curves 1-8, and C
morin-Bi(III) = 100.0 µmol L -1 in HOAc-NaAc buffer (0.01 mol L-1, pH 3.2) + 0.05 mol L-1 NaCl, excitation wavelength 428 nm.
increase in fluorescence emission intensity also agrees with observations for other intercalators.54,55. The emission quenching of morin in the presence of DNA may be caused by the fact that, morin being a small hydrophobic molecule and can be adsorbed by hydrophobic groups on the surface of DNA.56
Since morin-Bi(III) and morin alone display different emission spectral characteristics in the presence of DNA, it is apparent that more than a single binding mode exists for the two compounds. This conclusion is further supported by studying the effect of MB on the emission spectra of the DNA-morin-Bi(III) complex and DNA-morin systems.
Effects of MB on the emission spectra of DNA-morin-Bi(III) and DNA-morin systems
In order to investigate the mode of morin-Bi(III) complex and morin binding to DNA, MB has been employed in examination of the reaction, as MB presumably binds initially to DNA by intercalation. The experiment was carried out in a 3 mL solution of 2.8 × 10⁻⁴ mol L-1 DNA, 1.0 ×10⁻⁵ mol L-1 morin-Bi(III) complex and 1.0 × 10⁻⁵ mol L-1 morin titrated with the significant amounts of MB solution. Figures 17 and 18 show the fluorescence spectra of DNA-morin-Bi(III) complex and DNA-morin system, respectively, in the absence and presence of MB. When the concentration of MB was increased the fluorescence intensity of the DNA-morin-Bi(III) system decreased. With the addition of morin-Bi(III) complex to a solution of MB-DNA, some MB molecules were released into solution after an exchange with the morin-Bi(III) complex, and this resulted in fluorescence quenching. A progressive reduction of up to 72% in fluorescence was observed (Curves 1-7, Figure 17) together with a blue peak shift of 2 nm. This supported the view that the complex intercalated into the DNA.54
The fluorescence intensity of the DNA-morin system slightly changed as MB is added. Comparing these changes in the emission spectra of the DNA-morin-Bi(III) system with the DNA-morin system in the presence of MB, the difference is distinct. So, these two systems bind to DNA in different modes. The slightly emission quenching of morin in the presence of MB may be caused by the fact that, morin being a small hydrophobic molecule and can be adsorbed by hydrophobic group on the surface of DNA.57 Since Bi(III)-morin-DNA and morin-DNA display different emission spectral characteristics in the presence of MB, it is apparent that more than a single binding mode for the two compounds exists.
Effects of morin-Bi(III) complex and morin on the emission spectra of DNA-MB system
Further support for the different modes of morin-Bi(III) and morin binding to DNA is given through the emission quenching experiment. Here MB was also employed as a probe. The experiment was carried out in a 3 mL solution of 2.7 × 10⁻⁴ mol L-1 MB, 2.8 × 10⁻⁴ mol L-1 DNA titrated with 1.6 × 10⁻⁶ mol L-1 morin-Bi(III) complex solution and 1.6 × 10⁻⁶ mol L-1 morin solution, respectively. Figures 19 and 20 show the emission spectra of the DNA-MB system in the presence of morin-Bi(III) complex and morin, respectively. The emission intensity of the DNA-MB system increased as the concentration of morin-Bi(III) complex increased and the emission was slightly changed as morin was added to the DNA-MB system. An increase in the fluorescence intensity of MB-DNA due to an increased concentration of morin-Bi(III) complex may be due to the intercalation. This phenomenon indicates that morin-Bi(III) complex could not replace with MB from DNA-MB system due to the higher binding constant than DNA-morin-Bi(III). However, morin-Bi(III) complex could be intercalated into the DNA strains and increase the rigidity of the MB-DNA molecule. Consequently, an increase in the fluorescence Figure 17. Emission fluorescence spectra of the competition between
morin-Bi(III)-DNA complex and methylene blue. CMB = 0.0, 1.6, 3.1, 4.6, 6.1, 7.5 and 8.8 µmol L-1 for curves 1-7, C
morin-Bi(III) = 10 µmol L -1 and CDNA = 28.4 µmol L-1 in HOAc-NaAc buffer (0.01 mol L-1, pH 3.2) plus 0.05 mol L-1 NaCl, excitation wavelength 428 nm.
Figure 18. Emission fluorescence spectra of the competition between morin-DNA and methylene blue. CMB = 0.0, 2.9, 3.7, 4.6, 5.5, 6.3 and 8.0 µmol L-1 for curves 1-7, C
morin = 10 µmol L -1 and C
intensity was observed with addition of the complex. Due to the electrostatic interaction of morin with DNA-MB, the emission intensity of this system changes slightly with the addition of morin (Figure 20).
Conclusion
Based on our investigation, although both morin-Bi(III) complex and morin can bind to DNA, the nature of the binding was found to be different for each of them. In the presence and absence of the DNA, morin-Bi(III) complex shows different spectral characteristics which agree with those observed for other intercalators. This phenomenon suggests that the morin-Bi(III) complex binds to DNA mainly in the intercalating mode while the morin binds to DNA in a non-intercalating mode.
Acknowledgement
The authors gratefully acknowledge the financial support of this work by Research Council of Isfahan Figure 19. Emission fluorescence spectra of the competition between morin-Bi(III) complex and MB-DNA. Cmorin-Bi(III) = 0.0, 1.6, 3.1, 8.8, 13.9, 16.2 and 18.4 µmol L-1 for curves 1-7, C
MB = 10 µmol L -1 and CDNA = 28.4 µmol L-1 in HOAc-NaAc buffer (0.01 mol L-1, pH 3.2) plus 0.05 mol L-1 NaCl, excitation wavelength 620 nm.
Figure 20. Emission fluorescence spectra of the competition between morin and MB-DNA. Cmorin= 0.0, 1.6, 3.1, 4.6, 6.1, 7.5, 8.8 and 10.1 µmol L-1 for curves 1-8, C
MB = 10 µmol L -1 and C
DNA = 28.4 µmol L -1 in HOAc-NaAc buffer (0.01 mol L-1, pH 3.2) plus 0.05 mol L-1 NaCl, excitation wavelength 675 nm.
University of Technology (IUT). The authors also thank Mr. Peyman Akhlaghi from Institute for Advanced Studies in Basic Sciences (IASBS) for his helpful guides.
References
1. Grguric-Sipka, S. R.; Vilaplana, R. A.; Perez, J. M.; Fuertes, M. A.; Alonso, C.; Alvarez, Y.; Sabo, T. J.; Gonzalez-Vilchez, F.; J. Inorg. Biochem.2003, 97, 215.
2. Rauf, S.; Gooding, J. J.; Akhtar, K.; Ghauri, M. A.; Rahman, M.; Anwar, M. A.; Khalid, A. M.; J. Pharm. Biomed. Anal.2005, 37, 205.
3. Chantal, C. L. M.; France, V. M.; Muriel, T.; Helene, S. M.; Jacques, M.; Marc, S. W.; Toxicology1996, 114, 19.
4. Hollman, P . C. H.; Katan, M. B.; Food Chem. Toxicol.1999, 37, 937.
5. Polissero, C.; Lenczowski, M. J. P.; Chinzl, D.; Davail, C. B.; Sumpter, J. P.; Fostier, A.; J. Steroid Biochem. Mol. Biol.1996, 57, 215.
6. Fujiki, H.; Horinchi, T.; Yamashita, K.; Hakii, H.; Suganuma, M.; Nishino, H.; Iwashima, A.; Hirata, Y.; Sugimura, T.; In Plant Flavonoids in Biology and Medicine: Biochemical, Pharmacological and Structure Activity Relationships, Cody, V.; Middleton, E.; Harborne, J.B.; (eds.), Alan R. Liss, Inc.: New York, 1986, p. 429.
7. Deschner, E. E.; Ruperto, J.; Wong, G.; Newmark, H. L.; Carcinogenesis1991, 12, 1193.
8. Elangovan, V.; Sekar, N.; Govindasamy, S.; Cancer Lett.1994, 87, 107.
9. Chang, W. S.; Lee, Y. J.; Lu, F. J.; Chiang, H. C.; Anticancer Res.1993, 13, 2165.
10. Zhu, X. X.; Mao, H. B.; Chin. Traditional Med. 1997, 28, 373.
11. Satyanarayana, S.; Dabrowiak, J. C.; Chaires, J. B.; Biochemistry
1992, 31, 9319.
12. Nishio, A.; Uyeki,E. M.; Cancer Res.1981, 43, 1951. 13. Kumar, C. V.; Barton, J. K.; Turro, M. J.; J. Am. Chem. Soc.
1985, 107, 5518.
14. Barton, J. K.; Danishefsky, A. T.; Golderg, J. M.; J. Am. Chem. Soc.1984, 106, 2172.
15. Ling, L. S.; He, Z. K.; Zeng, Y. E.; Spectrochim. Acta, Part A
1999, 55, 1297.
16. Chen, W.; Turro, N. J.; Tomalia, D. A.; Langmuir2000, 16, 15.
17. Mudasir, N.; Yoshioka, H.; J. Inorg. Biochem.1999, 77, 239. 18. Solimani, R.; Int. J. Biol. Macromol. 1996, 18, 287.
19. Kapur, A.; Beck, J. L.; Sheil, M. M.; Rapid Commun. Mass Spectrom.1999, 13, 2489.
20. Carcelli, M.; Mazza, P.; Pelizzi, C.; Zani, F.; J. Inorg. Biochem.
1995, 57, 43.
22. Raffaelli, A.; Pucci, S.; Desideri, I.; Bellina, C. R.; Bianchi, R.; Salvadori, P.; J. Chromatogr., A1999, 854, 57.
23. Bale, M. J.; Yang, C. Pfaller, M. A.; Diagn. Microbiol. Infect. Dis.1997, 28, 65.
24. Meric, B.; Kerman, K.; Ozkan, D.; Kara, P.; Erensoy, S.; Akarca, U.S.; Mascini, M.; Ozsoz, M.; Talanta2002, 56, 837. 25. Usacheva, M. N.; Teichert, M. C.; Biel, M. A.; J. Photochem.
Photobiol. B2003, 71, 87.
26. Armstrong, R. W.; Kurucsv, T.; Strauss, V. P.; J. Am. Chem. Soc.
1970, 92, 3174.
27. Erdem, A.; Kerman, K.; Meric, B.; Ozsoz, M.; Electroanalysis
2001, 13, 219.
28. Ohuigin, C.; McConnell, D. J.; Kelly, J. M.; Van der Putten, W. J. M.; Nucl. Acids Res.1987, 15, 7411.
29. Fujimoto, B. S.; Clendenning, J. B.; Delrow, J. J.; Heath, P. J.; Schurr, M.; J. Phys. Chem.1994, 98, 6633.
30. Kelly, S. O.; Barton, J. K.; Jackson, N. M.; Hill, M. G.; Bioconjugate Chem.1997, 8, 31.
31. Norden, B.; Tjerneld, F.; Biopolymers1982, 21, 1713. 32. Britos, L.; Goyenola, G.; Orono, S. U.; Biochem. Mol. Biol.
Educ.2004, 32, 341.
33. Itoh, S.; Kaneco, S.; Ohata, K.; Mizuno, T.; Anal. Chim. Acta
1999, 379, 169.
34. Yamini, Y.; Chaloosi, M.; Ebrahimzadeh, H.; Talanta2002, 56, 797.
35. Huang, C. Z.; Li, Y. F.; Feng, P.; Talanta2001, 55, 321. 36. Windig, W.; Chemom. Intell. Lab. Sys. 1992, 16, 1. 37. Maeder, M.; Anal. Chem. 1987, 59, 527.
38. Nevea, S.; Juan, A. D.; Tauler, R.; Anal. Chim. Acta2001, 446, 185.
39. Jovanovic, S. V.; Steenken, S.; Tosic, M.; Marjanovic, B.; Simic, M. G.; J. Am. Chem. Soc.1994, 116, 4846.
40. Kang, J. W.; Zhuo, L.; Lu, X. Q.; Liu, H. D.; Zhang, M.; Wu, H. X.; J. Inorg. Biochem.2004, 98, 79.
41. Torreggiani, A.; Tamba, M.; Trinchero, A.; Bonora, S.; J. Mol. Struc.2005, 744, 759.
42. Brown, J. E.; Khodr, H.; Hider, R. C.; Rice-Evans, C. A.; Biochem. J.1998, 330, 1173.
43. Yamamoto, N.; Moon, J. H.; Tsushida, T.; Nagao, A.; Terao, J.; Arch. Biochem. Biophys.1999, 372, 347.
44. Hollstein, M.; Sidransky, D.; Vogelstein, B.; Harris, C. C.; Science1991, 253, 49.
45. Silverstein, R. M.; Bassler, G. C.; Spectrometric Identification of Organic Compounds, John Wiley & Sons, Inc.: New York, 1974.
46. Kopacz, M.; Nowak, D.; Microchem. J. 1993, 47, 338. 47. Kopacz, M.; Nowak, D.; Polish J. Chem. 2000, 74, 303. 48. Rao, C. N. R.; Chemical Applications of Infrared Spectroscopy,
Academic Press: New York, 1963.
49. Takenaka, S.; Ihara, T.; Takagi,M.; J. Chem. Soc., Chem. Commun.1990, 1485.
50. Ibrahim, M. S.; Shehatta, I. S.; Al-Nayeli, A. A.; J. Pharm. Biomed. Anal.2002, 28, 217.
51. Long, E. C.; Barton, J. K.; Acc. Chem. Res.1990, 23, 271. 52. Huang, C. Z.; Li, Y. F.; Feng, P.; Talanta2001, 55, 321. 53. Pang, D. W.; Abruna, H. D.; Anal. Chem. 1998, 70, 3162. 54. Barton, J. K.; Goldberg, J. M.; Kumar, C. ,V.; Turro, N. J.;
J. Am. Chem. Soc.1986, 108, 2081.
55. Ni, Y.; Du, S.; Kokot, S.; Anal. Chim. Acta2007, 584, 19. 56. Song, Y.; Kang, J.; Zhou, J.; Wang, Z.; Lu, X.; Wang, L.; Gao,
J.; Spectrochimica Acta, Part A2000, 56, 2491.
57. Song, Y.; Kang, J.; Wang, Z.; Lu, X.; Gao, J.; Wang, L.; J. Inorg. Biochem.2002, 91, 470.