Article
0103 - 5053 $6.00+0.00
*e-mail: [email protected]
Synthesis, Characterization and use of Nb
2O
5based Catalysts in Producing Biofuels
by Transesterification, Esterification and Pyrolysis
Rodrigo F. Brandão, Rafael L. Quirino, Vinicius M. Mello, André P. Tavares, Antônio C. Peres, Flávia Guinhos, Joel C. Rubim and Paulo A. Z. Suarez*
Instituto de Química, Universidade de Brasília, Campus Universitário Darcy Ribeiro, CP 4478, 70904-970 Brasília-DF, Brazil
Nb2O5/HX (X = HSO4−, H 2PO4
−, NO 3
−) foram obtidos após o tratamento do Nb
2O5•xH2O com ácido sulfúrico, fosfórico, nítrico, sendo investigados juntamente com Nb2O5 e Nb2O5•xH
2O como catalisadores na reação de transesteriicação, esteriicação e pirólise de óleos vegetais. Os catalisadores foram caracterizados por análise térmica (DTA-TGA), espectroscopia (DRX, FT-IV e FT-Raman), área supericial (BET), e determinada acidez (Ho) pela titulação com n-butilamina utilizando o método Hammet. Após o tratamento ácido, todas as áreas supericiais e a acidez decresceram comparadas com o Nb2O5.xH
2O utilizado inicialmente no tratamento. A única exceção foi a alta acidez veriicada quando o ácido nítrico foi utilizado. Entre os catalisadores testados, o Nb2O5/H3PO4 apresentou boa atividade na reação de alcoólise do óleo de soja com diferentes alcoóis (metanol, etanol, 2-propanol, n-butanol). Todos os sólidos testados demonstraram estabilizar ácidos carboxílicos durante a pirólise. Finalmente, o uso de Nb2O5/H3PO4 e Nb2O5/H2SO4 como catalisador na reação de esteriicação demonstrou melhor atividade que o Nb2O5 e Nb2O5•xH
2O.
Nb2O5/HX (X = HSO4 −, H
2PO4 −, NO
3
−) compounds were obtained from the treatment of niobium acid (Nb2O5•xH
2O) with sulfuric, phosphoric, and nitric acids as well as Nb2O5 and Nb2O5•xH
2O have been investigated as catalysts for the transesteriication, esteriication and pyrolysis of vegetable oils. The compounds were characterized by thermal analysis (DTA-TGA), spectroscopy (DRX, FT-IR and FT-Raman), surface area (BET) and the acidity (Ho) determined by n-butylamine titration using the Hammet´s indicator method. It was observed that after the acid treatment both the surface area and the acidity decreased as compared to the starting Nb2O5•xH
2O. The only exception was a higher acidity veriied when nitric acid was used. Among the catalyst investigated, the Nb2O5/H3PO4 presented the highest activity in the alcoholysis of soybean oil with different mono-alcohols (methanol, ethanol, 2-propanol, n-butanol). All tested solids seemed to stabilize the carboxylic acids formed during the pyrolysis, yielding higher acid numbers for the obtained products. Finally, the use of Nb2O5/H3PO4 and Nb2O5/H2SO4 as catalysts for the esteriication showed better activity than Nb2O5•xH
2O and Nb2O5.
Keywords: esteriication, transesteriication, pyrolysis, niobium compounds
Introduction
Due to economical and ecological reasons, the study of alternative sources of energy has been intensiied in the
last years.1-5 In this context, the use of derivatives from
triglycerides and fatty acids such as methyl- or ethyl fatty acid esters and hydrocarbons has received special attention
as alternative fuels for diesel engines.6-8 The main studied
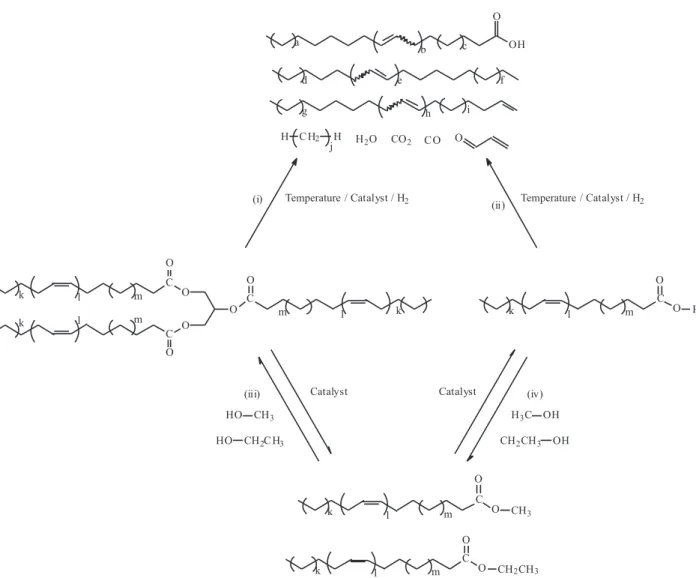
processes to obtain biofuels from triglycerides and fatty acids are depicted in Figure 1.
As in many other countries, the external dependence on imported diesel fuel and the present petroleum crisis have increased the discussion in Brazil in the sense of start
using alternatives to diesel fuel.9 In this sense, the use of
fatty acid derived compounds is the main alternative for a large petroleum diesel substitution program.
The pyrolysis of vegetable oils has been used for fuels and chemicals supply at different times during petroleum shortage. For example, it has been reported the production of hydrocarbons from Tung oil in China during the Second
World War.11 Since then, numerous studies about the
fatty acids have been developed. It was proposed that the decomposition of the glyceridic fragment of the triglyceride
achieves carboxylic acids, acrolein and ketenes.6,11,20,26
At the employed reaction conditions, these oxygenated compounds are further decomposed affording esters, carboxylic acid and hydrocarbons. Thus, the carboxylic acids are decarboxylated or decarbonylated, producing, respectively, carbon dioxide and paraffins or carbon
monoxide, oleins and water.20 It is also recognized that
several side and consecutives reactions take place, such us cracking of C-C bonds, cyclization, dehydrogenation,
aromatization and radical oligo-polymerization.6 When
the pyrolysis is carried out thermally, the characterization of the products indicated that the reaction affords a complex mixture containing high amounts of inconvenient oxygenated compounds, such as aldehydes and carboxylic acids. The presence of these oxygenated compounds are partially or completely reduced when the reaction is
carried out in the presence of a catalyst.8 For instance,
it was observed that the presence of different types of
zeolites dramatically changes the reaction products,21,24-26,28
affording essentially non-oxygenated compounds, mainly aromatic and short chain hydrocarbons in the range of
gasoline.19,22 On the other hand, it was also reported that the
products of soybean and babassu oils pyrolysis catalyzed by -alumina doped with nickel and molybdenium were completely deoxygenated when the reaction was carried
out in the presence of hydrogen pressure.20
The production of mono-alcohol fatty acid esters by transesteriication of vegetable oils with short chain mono-alcohols, generating glycerin as a by product, is well studied and established using homogeneous Brønsted acids or alkali catalysts, like alkali metal hydroxides or alkoxides and
sulfuric acid.6,8 However, these catalytic systems have some
is used. Furthermore, these catalytic systems are less active or completely inactive for ethanol and high molecular
weight alcohols.30 In order to minimize these problems,
attempts to use homogeneous and heterogeneous Lewis acid metal compounds as catalyst systems in the alcoholysis of triglycerides, as well as enzymatic catalysis, have been
made.8,31 The heterogeneous systems are active for high
molecular weight alcohols, achieving conversions higher than 95% in systems where neither alkali nor acid catalysts work and produce neither corrosion nor emulsion, making easier to separate the products obtained and recover and
reuse the catalysts.32,33
Mono-alcohol fatty acids esters can also be obtained by esteriication of fatty acids. Indeed, this technological approach has been proposed as a viable solution for raw
materials with high free fatty acids contents.34 Some reports
are available in the literature describing homogeneous and heterogeneous catalytic systems for the esteriication
of fatty acids.35-41 The homogeneous ones, usually strong
minerals acids, are associated to problems of equipments corrosion and dificulties in the products separation. The heterogeneous ones are associated to low activity due to phase transfer. Therefore, the technological challenge for fatty acids esteriication process is the development of high active heterogeneous acid catalysts, easy to recover from the products and with no corrosion issues.
Niobium oxide and its acid derivatives obtained by treatment with water and inorganic acids such as phosphoric and sulfuric acids are known to have a great acidity and have been described as suitable acid catalysts for several reactions. Indeed, they have been used in hydration, dehydration, esteriication, hydrolysis, condensation, etc.,
and some reviews on these uses are already available.42,43
However, as far as we know, there are few reports in the literature regarding to the use of niobium oxide and its derivatives as catalysts for biofuels productions. The hydrated niobium oxide (niobium acid) is described as active for the esteriication of a mixture containing 80% of free fatty acid as obtained after a physical reining of palm
oil.44 It has also been observed that the use of this catalyst
and some derivatives of it in the pyrolysis of soybean oil
lead to an increase in the catalyst acidity decreases.45
Our goal in this work was to develop new heterogeneous catalytic systems for the esteriication, transesteriication and pyrolysis of vegetable oils and fatty acids using niobium oxide and its acidic derivatives. In this sense, we have prepared some derivatives by treating hydrated
niobium oxide (Nb2O5•H
2O) with sulfuric acid (Nb2O5/
H2SO4), phosphoric acid (Nb2O5/H3PO4) and nitric acid
(Nb2O5/HNO3). It is worth to mention that as far as it is
our knowledge this is the irst report of the Nb2O5/HNO3
compound. The obtained materials have been characterized by thermal analysis (DTA-TGA), spectroscopy (X-ray, FT-IR and FT-Raman), surface area (BET) and the acidity
(Ho) determined by n-butylamine titration using the
Hammet indicator method.
Experimental
Catalysts preparation
Nb2O5 and Nb2O5•H
2O were obtained from Companhia
Brasileira de Metalurgia e Mineração-CBMM and used without further puriication. All other chemicals were purchased from commercial sources and use as received.
Nb2O5/H2SO4 derivative was prepared using a modiied
method described in the literature.42 Nb
2O5•H2O (3 g)
was added to a 12 mol L-1 sulfuric acid solution (6 mL)
in an ampoule. After sealing it, the mixture was kept standing for 48 hours in an oven for 48 h at 110 °C. The solid was washed with distilled water until no sulfate
ion was detected (tested using a 0.05 mol L-1 barium
chloride solution) and then dried in an oven for 24 h at 110 °C.
Nb2O5/H3PO4 derivative was prepared according to
method described in the literature.46 Nb
2O5•H2O (3 g) was
added to a 1 mol L-1 phosphoric acid solution (10 mL) and
then kept standing for 48 h under ambient temperature. Then, the mixture was dried in an oven for 48 h under 110 °C.
Nb2O5/HNO3 was prepared using a similar procedure as
described for Nb2O5•H
3PO4. 46 Nb
2O5•H2O (3g) was added
to a 1 mol L-1 nitric acid solution (10 mL) and then kept
standing for 48 hours under ambient temperature followed by drying in an oven for 48 h at 110 °C.
All the obtained solids were inally atomized and sieved
(diameter ≤ 400 μm).
Catalysts characterization
The surface acidity of catalysts was determined by the
Hammet indicator method,47 using bromothymol blue,
methyl yellow and violet crystal under nitrogen atmosphere. Three indicators solutions were prepared by dissolving each one (0.2 mg) in freshly distilled carbon tetrachloride (100 mL). Under nitrogen atmosphere, the solids (0.1 g) were mixed with the different indicator solutions (5 mL). The nine different mixtures were then titrated using a
0.05 mol L-1 solution of n-butyl amine dissolved in carbon
tetrachloride.
a Rigaku D/Max-2A/C with Cu Kα radiation at 40 KV and
20 mA. A 2θ range from 2° to 70 ° was scanned at 2° min-1.
The different niobium oxides were characterized by thermal analysis using SDT 2960 TA-Instruments (simultaneous
DSC-DTA-TGA) equipment, under N2 lux, using a heating
rate of 10 °C min-1, at temperatures varying from 50 to 800 °C.
The surface areas of the different niobium oxides were obtained by BET method using a Micrometrics analyzer model ASAP-2010. The isotherms were obtained through
adsorption of N2 at 77.30 K.
FT-Raman spectra of powder samples were obtained on an Equinox 55 interferometer from Bruker equipped with a Raman accessory and a Ge detector cooled with liquid
N2. The FT-Raman spectra were excited at 1064 nm from a
NdYag laser (Bruker) operated at 150 mW. Each spectrum is the average of 128 scans at a nominal spectral resolution
of 8 cm-1. The same instrument was used to record FT-IR
spectra from samples in KBr pellets using a DTGS detector. Each FT-IR spectrum is the average of 32 scans at a nominal
spectral resolution of 4 cm-1.
Transesterification reactions
The vegetable oil (10 g) was transesterified in the presence of different alkyl-chain alcohols (2.0 g) and one of the different niobium solids (0.1 g). The reaction mixtures were kept in a 50 mL batch reactor under relux and magnetic stirring for the desired time. The product obtained was washed three times with distilled water and the recovered esters were analyzed by gas chromatography on a Shimadzu GC-17A chromatograph equipped with FID detector, a polydimethylsiloxane column (CBPI PONA-M50-042, 50 m, 0.25 mm i.d. and ilm thickness of 0.2 μm), at temperatures
varying from 80 to 180 °C, with a heating rate of 10 °C min-1,
using ethyl acetate (0.1 g) as internal standard.
Esterification reactions
A fatty acids mixture was obtained through saponiication of soybean oil using sodium hydroxide followed by acidiication with hydrochloric acid. The mixture was washed with water and dried with magnesium sulfate. The composition of this fatty acid mixture as determined by
HPLC using a method described elsewhere48 was in the
range expected for soybean oil (linoleic acid, 52%; oleic acid, 24%; palmitic acid, 14%; stearic acid, 4%; other acids, 6%).
The esteriication reactions were carried out in a home-made stainless steel autoclave. The catalyst and the fatty acid mixture were inserted in the reactor through a valve. The methanol was in a stainless steel reservoir connected
to the reactor by a valve. Under constant magnetic stirring, the reactor was heated until the desired temperature was achieved. The temperature was monitored with a thermocouple inserted in a stainless steel cold inger in contact with the reaction bulk. At the desired temperature, methanol was introduced into the reactor and the reaction started. At the determined time, the reaction was stopped by turning of the stirring and heating. The product was then dried in a rotaevaporator to ensure complete removal of residual water and methanol. Reactions yields were calculated based on the diminishing of acid index for products in relation to acid index for the initial fatty acids mixture. All acid indexes were determined according to
AOCS Cd3d63 speciication.49
Pyrolysis reactions
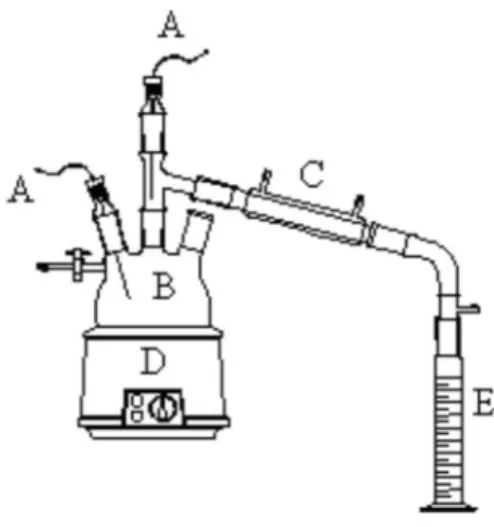
The pyrolysis reaction was carried out in a three necked round bottom lask connected to a glass condenser tube and a graduated collector, as indicated in Figure 2. Two thermocouples were used to control the temperature of the reaction and of the vapors leaving the system. Both the vegetable oil (100 g) and the catalyst (1 g; the catalyst
Nb2O5•H
2O was also tested in the quantity of 0.5 g) were
introduced in the lask and then heated by an electric resistance to maintain the reaction temperature between 350 °C and 400 °C. When the temperature in the lask reached 350 °C, the vegetable oil started to crack and the volatile products vaporized. The vapors left the lask with temperatures between 200 °C and 250 °C and were then condensed and collected. The whole reaction results in a non condensed gas, a very viscous residue and in two liquid phases: an aqueous and an organic one. The reaction was stopped when approximately 75% of liquid
Figure 2. Scheme of the apparatus used in the pyrolysis experiments:
was recovered. After decantation of the two liquid phases, the organic one was submitted to a fractioned distillation in order to separate four distinct fractions by their distillation temperature (DT) range as follows: F1 (DT < 80 °C), F2 (80 °C < DT < 140 °C), F3 (140 °C < DT < 200 °C) and F4 (DT > 200 °C). This procedure was carried out in a common system for fraction distillation.
All fractions were analyzed by gas chromatography, FT-IR and the acid number. The gas chromatography analysis were carried out in a Shimadzu GCMS-QP5050 equipped with a mass spectrometer containing a polydimethylsiloxane column 50 m, 0.25 mm id and 0.2 μm thin layer (CBPI PONA-M50-042), operating between 50 ºC and 250 ºC with
a heating rate of 10 ºC min-1. The FT-IR spectra from a thin
layer of the biofuels in a NaCl window were obtained on a Bruker Equinox 55. The FTIR spectrum corresponds to the
sum of 64 scans with a spectral resolution of 4 cm-1. The
acid number was determined by ASTM D465-9.
Results and Discussion
Catalysts characterization
Surface areas were obtained for the different solids by B.E.T and Langmuir methods. The results are displayed in Table 1. The results clearly show that the surface area decreases dramatically with the acid treatment of the
Nb2O5•H
2O, which was already reported in the literature.
46
It is worth mentioning that the surface area increases in the
following order Nb2O5 < Nb2O5/H2SO4 < Nb2O5/H3PO4 <
Nb2O5/HNO3 < Nb2O5•H
2O.
The surface acidity of the niobium solids was measured by the n-butylamine titration method using the Hammett indicators with −3.3 < Ho < + 0.8. It was observed that the
acidity decreases in the order Nb2O5/H3PO4 > Nb2O5/H2SO4 >
Nb2O5•H
2O > Nb2O5/HNO3. Note that for the Nb2O5/
H3PO4 Ho < −3.3 and for the Nb2O5•HNO
3 the Ho > +0.8.
Using other Ho ranges, similar surface acidities for the
compounds, Nb2O5/H3PO4 > Nb2O5/H2SO4 > Nb2O5•H
2O,
were reported in the literature.42
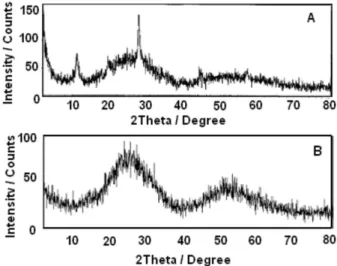
XRD pattern of the Nb2O5/H3PO4 is presented in
Figure 3A and shows the formation of a crystalline phase.
The other niobium compounds Nb2O5•H
2O, Nb2O5/H2SO4
and Nb2O5/HNO3 present XRD patterns characteristic of
amorphous material as can be seen for the Nb2O5•H
2O (see
Figure 3B).
TGA/DTA/DSC profiles obtained for the different solids are shown in Figure 4. All DTA curves present a weak and broad feature near 200 °C, accomplished by a continuous loss of mass in the TGA curve, which can be attributed to the dehydration of the samples. For the
Nb2O5•H
2O an exothermic sharp peak was observed at
566.14 °C, Figure 4a, which can be associated to the formation of a crystalline phase. It seems that this peak is sensitive to the acidic treatments. For instance, in the DSC
curve of Nb2O5/H2SO4, Figure 4b it appears close to 600 oC
as a broad exothermic feature and in the DSC curve of
Nb2O5/HNO3 sample, Figure 4d, this peak appears almost
in the same position as in Nb2O5•H
2O. However, this peak is
not observed in the DSC curve of Nb2O5/H3PO4, Figure 4c.
This effect was already described in the literature42 and
is associated with a suppression of the crystallization due to the phosphoric acid treatment. However, the crystalline properties of this solid were not investigated
in reference 42. As shown in Figure 3a, the Nb2O5/H3PO4
sample is already crystalline from the beginning which explains why no phase transition is observed in Figure 4c.
On the other hand the Nb2O5/H2SO4 sample shows a loss
of mass just above of 600 °C, which can be due to sulfuric acid decomposition.
FT-Raman spectra of the investigated catalysts are displayed in Figure 5. The main observed Raman features and relative intensities of the hydrated and acid treated Table 1. BET and Langmuir surface areas for the different niobium
oxides
Solid BET / (m2 g-1) Langmuir / (m2 g-1)
Nb2O5 1.1 1.8
Nb2O5/H2SO4 9.3 12.9
Nb2O5/H3PO4 50.1 71.0
Nb2O5/HNO3 101.6 144.3
Nb2O5•H2O 162.2 225.0
catalysts are presented in Table 2. The Raman spectrum
of the Nb2O5 sample presents a large number of Raman
bands, with well deined peaks, that can be explained by the high crystallinity of the substrate as evidenced by the X-ray analysis. The observed Raman bands are in quite good agreement with the data reported in the literature for
this species.50,51 On the other hand, the hydrated niobium
oxide (Nb2O5•H
2O) is amorphous, and its Raman spectrum
presents not well deined bands, that is, the observed Raman
features are very broad. The Raman band at ca. 640 cm-1
(the Nb-O stretching) matches that of the slightly distorted
NbO6 octahedral present in amorphous Nb2O5•nH
2O. 50
According to Franklin et al.,52 the medium intensity
broad feature at ca. 834 cm-1 extending up to 900 cm-1 in
the Raman spectrum of the hydrated niobate species is
due to a highly distorted NbO6 octahedron of an aqueous
HxNb6O19(8-x)- surface species. These authors came to this conclusion by comparing the Raman spectra of known
aqueous niobate reference compounds53 with the spectrum
of the hydrated niobate species. Note that these broad
Raman features are observed in all other Nb2O5 catalysts
treated with different acids. Besides these two broad features new Raman peaks emerge upon acidic treatments that are also displayed in Table 2.
FT-IR spectra of the investigated samples are presented in Figure 6 and the wavenumbers corresponding to each one of the absorptions is displayed in Table 3.
The absorptions at 640 and ca. 900 cm-1 can be assigned
to the same vibrational modes corresponding to the similar Raman features observed in the Raman spectra of these Figure 4. TGA/DTA/DSC proiles obtained for the solids: (a) Nb2O5•H2O, (b) Nb2O5/H2SO4, (c) Nb2O5/H3PO4 and (d) Nb2O5/HNO3. (— - - —) TG; (———) DTA; (- - - -) DSC.
samples. These features as well as the shoulder observed at
ca. 500 cm-1 are characteristic of the Nb
2O5•H2O catalyst.
54
The absorption observed at 1630 cm-1 corresponds to the
HOH bending mode of the water present in the catalyst. Furthermore, new absorptions emerge upon acidic treatments which are also displayed in Table 3.
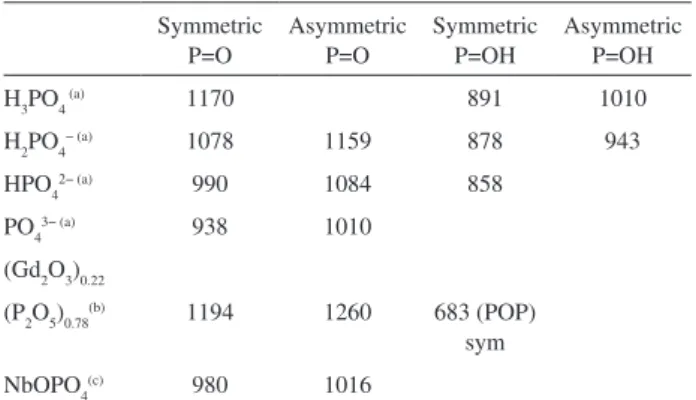
Tetrahedrally-coordinated PO, and SO, moieties are generally present in phosphorous and sulfurous compounds while octahedrally-coordinated P and S moieties are scarcely
observed.55 Table 4 shows the wavenumbers and vibrational
assignment of Raman bands observed in the Raman spectra of some phosphate containing compounds. Based on these
data the Raman features observed at 944 and 985 cm-1 in the
Raman spectrum of the Nb2O5/H3PO4 catalyst (see Table 2)
are tentatively assigned to the symmetric P=O-H and P=O stretching modes, respectively of a protonated tetrahedrally coordinated phosphate incorporated into the catalyst. The respective asymmetric stretching modes are observed in
the FT-IR spectrum at 1011 and 1149 cm-1 (see Table 3).
It is worth to mention that Amaroli et al.54 have observed
strong absorptions between 1040 and 1100 cm-1 in the IR
spectra of niobate catalysts treated with phosphoric acid which were assigned to the O=P=O asymmetric stretching modes of phosphate or polyphosphate species.
In order to get additional information from the
FT-Raman spectrum of the Nb2O5/H2SO4 catalyst the Raman
spectrum of the Nb2O5•H
2O sample was subtracted from
the one of Nb2O5/H2SO4. These spectra are displayed in
Figure 7. In the difference spectrum two weak features are
observed at ca. 427 and 564 cm-1 and a broad and more
intense Raman signal appears at 1024 cm-1. For comparison
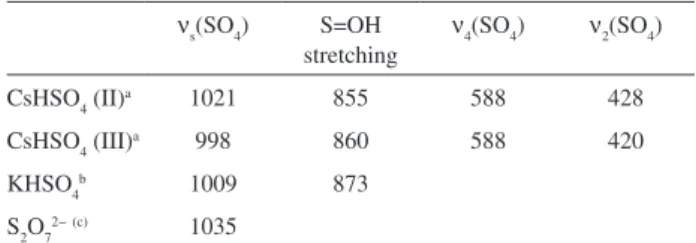
purposes Table 5 presents some Raman peaks observed in the Raman spectra of sulfate compounds. Note that one
of the CsHSO4 crystal forms present Raman signals that
coincide with those that appear in the difference spectrum
of Figure 7. Therefore, the Raman feature at 1024 cm-1 is
Table 2. Raman signals (in cm-1) observed in the Raman spectra of the
investigated catalysts
Nb2O5•nH2O Nb2O5/H2SO4 Nb2O5/H3PO4 Nb2O5/HNO3 239 (s)*
427 (vw)
515 (m)
646 (vbr) 646 (vbr) 646 (vbr) 646 (vbr)
ca. 834 (mbr) ca. 834 (mbr) ca. 834 (mbr) ca. 834 (mbr)
944 (s)
985 (vs)
1024 (w)
1048 (w)
*relative intensities: w = weak; vw = very weak; m =medium; s = strong; vs = very strong; vbr = very broad; sh = shoulder.
Figure 6. FT-IR absorption spectra (KBr pellets) of: (a) Nb2O5•H2O; (b) Nb2O5/H2SO4; (c) Nb2O5/H3PO4; (d) Nb2O5/HNO3.
Table 3. IR absorptions observed in the FT-IR spectra of the investigated
catalysts
Nb2O5•nH2O Nb2O5/H2SO4 Nb2O5/H3PO4 Nb2O5/HNO3 ca. 500 (wsh)* ca. 500 (wsh) ca. 500 (wsh) ca. 500 (wsh)
640 (vbr) 640 (vbr) 640 (vbr) 640 (vbr)
694 (w)
ca. 900 (br) ca. 900 (br) ca. 900 (br) ca. 900 (br)
946 (sh)
1011 (s)
1052 (m) 1085 (wsh)
1142 (m) 1149 (sh) 1125 (wsh)
1225 (m)
1310 (w)
1387 (vs)
1630 (m) 1630 (m) 1630 (m)
* Relative intensities as in Table 2.
Table 4. Raman shifts observed for phosphate compounds
Symmetric P=O
Asymmetric P=O
Symmetric P=OH
Asymmetric P=OH
H3PO4 (a) 1170 891 1010
H2PO4− (a) 1078 1159 878 943
HPO42− (a) 990 1084 858
PO43− (a) 938 1010
(Gd2O3)0.22
(P2O5)0.78(b) 1194 1260 683 (POP)
sym
NbOPO4(c) 980 1016
tentatively assigned to the symmetric stretching mode and
the weak features at 427 and 564 cm-1 are assigned to the
ν2 and ν4 modes, respectively, of HSO4
− incorporated in the
Nb2O5/H2SO4 catalyst.
FT-IR spectrum of CsHSO4 presents an absorption
band observed near 1250 cm-1 that was assigned to the
asymmetric S=OH stretching mode.59 Besides this band two
other features appears at 1175 and 1060 cm-1, the later is
assigned to the asymmetric S=O stretching.59 Therefore the
absorption features at 1225, 1142 and 1052 cm-1 observed in
the IR spectrum of the niobium catalyst treated with sulfuric acid are assigned to the respective vibrational modes of
HSO4− bounded to the catalyst surface.
The symmetric NO stretching mode, ν1, of NO3− is very
strong in the Raman spectrum.61 Therefore, the Raman
feature at 1048 cm-1, observed in the Raman spectrum of
the Nb2O5/HNO3 catalyst, is assigned to the ν1 vibrational
mode of NO3−. Another characteristic nitrate vibration is
the ν3 vibrational mode that is doubly degenerate at D3h
symmetry (appearing at ca 1380 cm-1), being strong in
the infrared and weak in the Raman spectrum. This mode splits into two absorptions in the infrared spectrum, one
close to 1400 cm-1 and another at lower wavenumbers
(1300 to 1350 cm-1) when the symmetry is reduced.62 In
this sense, the absorption features at 1387 and 1310 cm-1
observed in the IR spectrum of Nb2O5/HNO3 catalyst
are assigned to the splitting of the ν3 mode caused by a
reduction in the symmetry (probably C2v) of the nitrate ion
upon incorporation into the catalyst. We believe that the
HNO3 species is not present on the catalyst surface rather
the NO3− anion since the HNO
3 strong Raman signal
63 near
949 cm-1 was not observed which could then explain the
lower acidity of the Nb2O5/HNO3 catalyst in comparison
to the others. We have no assignment for the weak features
observed at 1085 and 1125 cm-1. If we enlarge the infrared
spectrum of the Nb2O5•H
2O species, similar weak features
are observed in this region.
Transesterification results
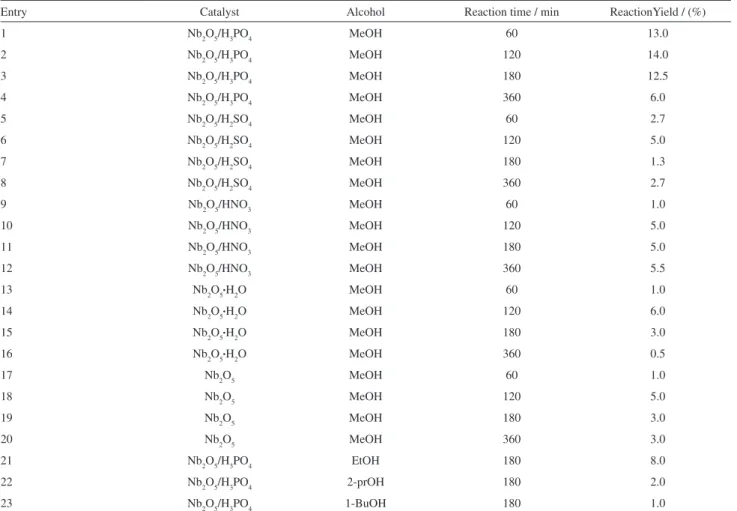
The different niobium oxides were tested as catalysts for the transesteriication of soybean oil and the main results are summarized Table 6. The results show that all solids are active for the methanolysis reaction (see entries 1-20). Nonetheless, the most active catalyst using comparable
conditions is the Nb2O5/H3PO4. This catalyst does not
present the largest surface area among the investigated catalysts. Therefore, its higher activity can only be explained by its higher acidity when compared to the other solids. Indeed, this result is in good agreement with the
acid mechanism proposed for this reaction.64 The Nb
2O5/
H3PO4 was also tested as catalyst for the transesteriication
of soybean oil using other alcohols with longer alkyl chains (see entries 3 and 21-23 of Table 6). Not surprisingly, the catalytic activity decreases when the alkyl chain increases,
which is associated in the literature with steric effects.65
Esterification results
The different niobium oxides were tested as catalysts for the esteriication of fatty acid and the main results are summarized Table 7. Although fatty acids are weak Bronsted acids they are active catalysts in the esteriication,
being usually observed self-catalytic activity.64 Thus, for
the sake of comparison, the reaction was also carried out without any niobium catalyst.
The results of Table 7 show that only Nb2O5•H
2O is
inactive in comparison with the reaction without catalyst. Nonetheless, the catalytic activity of the different catalysts
can be ordered as: Nb2O5/H3PO4 = Nb2O5/H2SO4 > Nb2O5/
HNO3, which is in good agreement with the surface acidity
order. Thus, the mechanism of these reaction may be probably the usually accepted for esteriication catalyzed
by Lewis acid solids.66 As proposed in Figure 8, niobium
oxides reacts with methanol accepting electrons from the Table 5. Raman and IR vibrational bands observed in some sulfate
compounds
νs(SO4) S=OH
stretching
ν4(SO4) ν2(SO4)
CsHSO4 (II)a 1021 855 588 428
CsHSO4 (III)a 998 860 588 420
KHSO4b 1009 873
S2O72−(c) 1035
aref. 59, II and III are two different crystalline phases; bref. 59; cref. 60
alcohol, affording a hydroxyl and a methoxyl groups. Thus, the fatty acid reacts with the hydroxyl group leading to a carboxylate coordinated group. After a nucleoilic attack by the methoxy group to the carbonyl, the fatty acid ester is formed and the active oxide is recovered.
The inactivity of the Nb2O5•H
2O in the esteriication,
even having a higher acidity of the active Nb2O5•HNO
3, can
be explained by the strong interaction of the water in the catalytic center, hindering the coordination of the alcohol, as proposed in Figure 8. Indeed, the reaction of water with niobium oxide would form hydroxyl groups and, thus,
Table 6. The transesteriication of soybean oil using different alcohols catalyzed by the solids at different reaction times
Entry Catalyst Alcohol Reaction time / min ReactionYield / (%)
1 Nb2O5/H3PO4 MeOH 60 13.0
2 Nb2O5/H3PO4 MeOH 120 14.0
3 Nb2O5/H3PO4 MeOH 180 12.5
4 Nb2O5/H3PO4 MeOH 360 6.0
5 Nb2O5/H2SO4 MeOH 60 2.7
6 Nb2O5/H2SO4 MeOH 120 5.0
7 Nb2O5/H2SO4 MeOH 180 1.3
8 Nb2O5/H2SO4 MeOH 360 2.7
9 Nb2O5/HNO3 MeOH 60 1.0
10 Nb2O5/HNO3 MeOH 120 5.0
11 Nb2O5/HNO3 MeOH 180 5.0
12 Nb2O5/HNO3 MeOH 360 5.5
13 Nb2O5•H2O MeOH 60 1.0
14 Nb2O5•H2O MeOH 120 6.0
15 Nb2O5•H2O MeOH 180 3.0
16 Nb2O5•H2O MeOH 360 0.5
17 Nb2O5 MeOH 60 1.0
18 Nb2O5 MeOH 120 5.0
19 Nb2O5 MeOH 180 3.0
20 Nb2O5 MeOH 360 3.0
21 Nb2O5/H3PO4 EtOH 180 8.0
22 Nb2O5/H3PO4 2-prOH 180 2.0
23 Nb2O5/H3PO4 1-BuOH 180 1.0
MeOH = methanol, EtOH = ethanol, 2-prOH = 2-propanol, 1-BuOH = 1-butanol. Conditions: 10.0 g of soybean oil, 0.1 g of catalysts and 2.0 g of alcohol under relux.
Table 7. The esteriication of soybean fatty acids with MeOH catalyzed
by the niobium solids*
Catalyst Reaction Yield / (%)
without catalyst 32
Nb2O5•H2O 32
Nb2O5 36
Nb2O5/HNO3 40
Nb2O5/H3PO4 57
Nb2O5/H2SO4 57
*Reaction conditions: 10 g of soybean fatty acids, 4 g of MeOH, 1 hour, 160 °C.
Figure 8. Proposed mechanism for esteriication using niobium based
making dificult the formation of a methoxyl group. Note that if only hydroxyl groups are present in catalytic site, the inal product is a fatty acid molecule instead of a fatty acid ester. It is also important to note that probably the water formed in the reaction process inactivates the catalyst, thus explaining the low catalytic activity of the solids.
Pyrolysis results
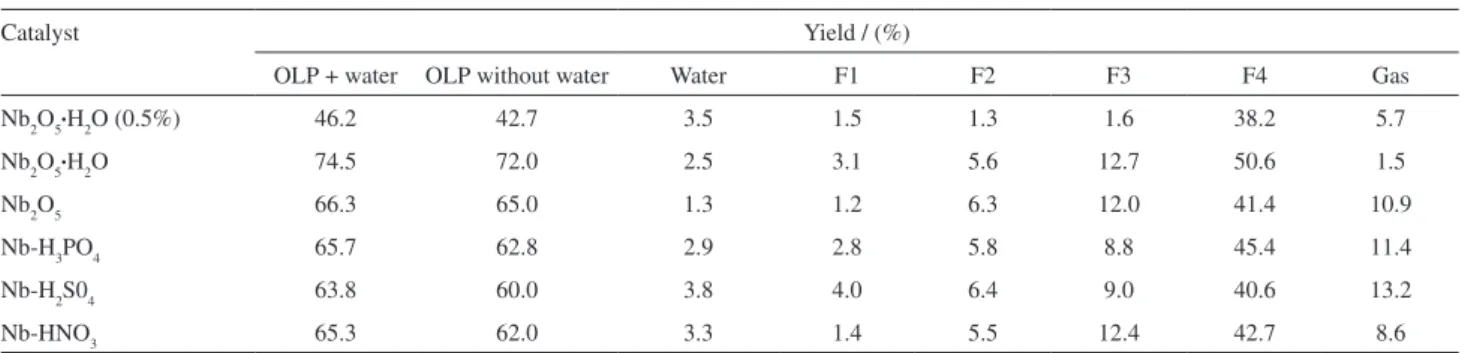
The reaction yields obtained for the different catalytic pyrolysis fractions of soybean oil with the different niobium oxide catalysts are presented in Table 8 and Table 9 show the acid number for respective fraction 4. The results of Table 8 show very similar yields of recovered organic
liquid phase (OLP) and fraction 4 except for the Nb2O5•H
2O
catalyst that at the same conditions presented higher yields on both OLP and fraction 4. On the contrary, when used in less quantity (0.5 g), a lower yield was observed for both parameters. The distribution of the other fractions was quite similar for all the catalysts.
As far as the acid number is regarded, it can be seen that all the values presented in Table 9 are higher than the acidity index measured for product of soybean oil pyrolysis carried out using similar experimental conditions
and in the absence of any catalyst.18 This means that
none of the catalysts tested in this work was active for the deoxygenation of pyrolysis products. It is dificult to correlate the catalyst surface area and acidity with the degree of decarbonylation/decarboxylation reaction of the carboxylic acids during the pyrolysis reaction. Idem and
co-workers24,26 have pointed out that there is a great controversy
in the role of the catalyst surface area and acidity in the catalytic activity and products selectivity. Furthermore, there is a reasonable correlation between the integration of the IR absorption band corresponding the C=O stretching and the acid number measured for each catalyst tested, suggesting that free carboxylic acids are present in the products and that the amount of these compounds could be related to the area calculated for that speciic peak.
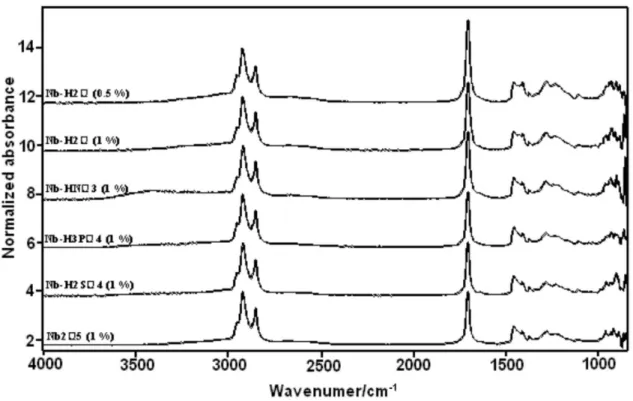
FT-IR spectra of the products present in the diesel fraction, F4 (> 200 °C) for each catalyst tested are displayed in Figure 9. It can be observed, in the
2840-3000 cm-1 region, absorption bands associated with
the CH stretching modes of aliphatic hydrocarbons. Deconvolution of the base lines show a broad background
in the 2500-3400 cm-1 spectral range that is characteristic
of OH stretching mode of hydrogen bonded carboxylic
acids. The IR absorption at 1710 cm-1 is the C=O stretching
mode. Since the spectra in Figure 10 were normalized in
relation to the intensity of the CH3 bending signal at
1459 cm-1, it is also possible to compare the intensity of
the C=O stretching of the products obtained with the tested catalysts. The following order of increasing intensity was
observed: Nb2O5 < Nb2O5/H2SO4 < Nb2O5/H3PO4 < Nb2O5/
HNO3 < Nb2O5•H
2O < Nb2O5•H2O (0.5%), which matches
almost perfectly with acid number data, except for Nb2O5
and Nb2O5/H2SO4 catalysts.
GC-FID and GC-MS analyses of the diesel fractions showed that the catalytic pyrolysis results in a mixture of hydrocarbons with long, linear and saturated or unsaturated chains. It was also observed the presence of oxygenated products such as linear carboxylic acids. In the fractions 1 and 2, the presence of saturated and unsaturated hydrocarbons with carbon chains smaller than C12 was
Table 8. Soybean oil pyrolysis’ yields with different niobium oxide catalysts
Catalyst Yield / (%)
OLP + water OLP without water Water F1 F2 F3 F4 Gas
Nb2O5•H2O (0.5%) 46.2 42.7 3.5 1.5 1.3 1.6 38.2 5.7
Nb2O5•H2O 74.5 72.0 2.5 3.1 5.6 12.7 50.6 1.5
Nb2O5 66.3 65.0 1.3 1.2 6.3 12.0 41.4 10.9
Nb-H3PO4 65.7 62.8 2.9 2.8 5.8 8.8 45.4 11.4
Nb-H2S04 63.8 60.0 3.8 4.0 6.4 9.0 40.6 13.2
Nb-HNO3 65.3 62.0 3.3 1.4 5.5 12.4 42.7 8.6
Table 9. Acid number (AN, mg KOH g-1) and integrated intensity of
C=O stretching signal at 1710 cm-1 of diesel fractions obtained with
different catalysts
Catalyst AN Max/min normalized
C=O/C-H
Nb-H2O (0.5%) 237 1.00
Nb-H2O 172 0.51
Nb-HNO3 154 0.47
Nb-H3PO4 126 0.09
Nb-H2SO4 120 0.03
Nb2O5 121 0.00
-observed. The presence of 2-propenal (acrolein) and 2-propanone was also detected in these fractions.
The presence of long chain carboxylic acids among the products of triglycerides pyrolysis has been reported by
Nawar.19 The formation of that kind of product is the result
of the thermal cracking mechanism for triglycerides.20 The
presence of carboxylic acids in the reaction product makes it very acid and represents a disadvantage in the use of these catalysts to obtain diesel-like fuels. Even though the
carboxylic acids are degradated during the process,20 we can
still verify a higher acid number for the pyrolysis products when using niobium oxides catalysts than when no catalyst is used. Similar behavior has already been described for
niobium based catalyst45 and other basic, MgO and CaO,
catalysts.26 This fact may be related to a sort of stabilization of
the carboxylic function of these molecules by its interaction with the catalyst. Indeed, the basic sites of the catalyst structure would interact strongly with the acidic hydrogen of the carboxylic acids resulting in a very stable intermediate where the proton is midway between complete dissociation and attached to the carboxylate ion. This structure is
stabilized by the resonance of the COO− group.
Conclusions
In summary, it has been shown that the treatment of
Nb2O5•H
2O with different mineral acids affords niobium
compounds with different surface area and acidity, being
the most acid the one obtained with H3PO4, the only that
presented crystalline characteristics. When tested for the soybean oil transesteriication reaction, all solids presented catalytic activity. The higher catalytic activity was achieved
in the methanolysis of soybean in the presence of Nb2O5/
H3PO4. This compound was also tested using other alcohols,
diminishing the catalytic activity with the increase in the alkyl chain, probably due to a steric hindrance effect. In
the esteriication process only Nb2O5•H
2O revealed no
activity while the Nb2O5/H2SO4 and Nb2O5/H3PO4 showed
promising results.
The products of the catalytic pyrolysis of soybean oil consisted mainly of a mixture of linear hydrocarbons and oxygenated compounds, such as carboxylic acids. The presence of niobium oxide catalysts during the pyrolysis may account for the stabilization of the carboxylic acids structures increasing the acidity of the products obtained. The higher deoxygenating activity was achieved when
the solid Nb2O5/H2SO4 was used in the reaction. Very
small differences were observed in the distribution of the distillated fractions, especially for diesel-like fraction, suggesting that all tested catalysts act similarly in the pyrolysis of soybean oil.
Acknowledgments
The financial supports from CNPq, CTPETRO, Fundação Banco do Brasil, Embrapa and CAPES are
gratefully acknowledged. The authors also thank CBMM for the donation of niobium oxide and hydrated niobium oxide. PAZS, JCR, VMM, RFB and RLQ also thank CNPq for research fellowships.
References
1. Kirschbaum, M. U. F.; Biomass Bioenergy2003, 24, 297. 2. Demirbas, A.; Energy Convers. Manage. 2006, 47, 2271. 3. Chisti, Y; Biotechnol. Adv.2007, 25, 294.
4. Demirbas, M. F.; Balat, M.; Energy Convers. Manage. 2006, 47, 2371.
5. Abreu, F. R.; Lima, D. G.; Hamú, H. E.; Einloft, S.; Rubien, J. C.; Suarez, P. A. Z.; J. Am. Oil Chem. Soc.2003, 80, 601. 6. Pinto, A. C.; Guarieiro, L. L. N.; Rezende, M. J. C.; Ribeiro,
N. M.; Torres, E. A.; Lopes, W. A.; Pereira, P. A.; Andrade, J. B. de; J. Braz. Chem. Soc.2005, 16, 1313.
7. Ma, F.; Hanna, M. A.; Bioresour. Technol. 1999, 70, 1. 8. Suarez, P. A. Z.; Meneghetti, S. M. P.; Meneghetti, M. R.; Wolf,
C. R.; Quim. Nova2007, 30, 667.
9. Pousa, G. P. A. G.; Santos, A. L. F.; Suarez, P. A. Z.; Energy Policy2007, 35, 5393.
10. Suarez, P. A. Z.; Meneghetti, S. M. P.; Quim. Nova2007, 30, 2068.
11. Chang, C.-C.; Wan, S.-W.; Ind. Eng. Chem.1947,39, 1543. 12. Alencar, J. W.; Alves, P. B.; Craveiro, A. A.; J. Agric. Food
Chem. 1983, 31, 1268.
13. Fortes, I. C. P.; Baugh, P. J.; J. Anal. Appl. Pyrolysis1994, 29, 153.
14. Santos, F. R.; Ferreira, J. C. N.; Costa, S. R. R. da; Quim. Nova
1998, 21, 560.
15. Schwab, A. W.; Dykstra, G. J.; Selke, E.; Sorenson, S. C.; Pryde, E. H.; J. Am. Oil Chem. Soc. 1988, 65, 1781.
16. Fortes, I. C. P.; Baugh, P. J.; J. Braz. Chem. Soc. 1999, 10, 469.
17. Schwab, A. W.; Dykstra, G. J.; Selke, E. S.; Sorenson, C.; Pryde, E. H.; J. Am. Oil Chem. Soc. 1988, 65, 1781.
18. Lima, D. G.; Soares, V. C. D.; Ribeiro, E. B.; Carvalho, D. A.; Cardoso, E. C. V.; Rassi, F. C.; Mundim, K. C.; Rubim, J. C.; Suarez, P. A. Z.; J. Anal. Appl. Pyrolysis2004, 71, 987. 19. Nawar, W. W.; J. Agric. Food Chem. 1969, 17, 18.
20. Gusmão, J.; Brodzki, D.; Djéga-Mariadassou, G.; Frety, R.; Catal. Today1989, 5, 533.
21. Sharma, R. K.; Bakhshi, N. N.; Can. J. Chem. Eng.1991, 69, 1071.
22. Konar, S. K.; Boocock, D. G. B.; Mão, V.; Liu, J.; Fuel1994, 73, 642.
23. Katikaneni, S. P. R.; Bakhshi, N. N.; Adjaye, J. D.; Energy Fuels
1995, 9, 599.
24. Idem, R. O.; Katikaneni, S. P. R.; Bakhshi, N. N.; Energy Fuels
1996, 10, 1150.
25 Prasad, Y. S.; Bakhshi, N. N.; Mathews, J. F.; Eager, R. L.; Can. J. Chem. Eng.1986, 67, 278.
26. Idem, R. O.; Katikaneni, S. P. R.; Bakhshi, N. N.; Fuel Process. Technol. 1997, 51, 101.
27. Santos, F. R.; Ferreira, J. C. N.; Costa, S. R. R. da; Quim. Nova
1998, 21, 560.
28. Dandik, L.; Aksoy, H. A.; Erdem-Senatalar, A.; Energy Fuels
1998, 12, 1148.
29. Gomes, J. R.; BR 0500591, 2005.
30. Demirbas, A.; Energy Convers. Manage.2002, 43, 2349. 31. Fukuda, H.; Kondo, A.; Noda H.; J. Biosci. Bioeng. 2001, 92,
406.
32. Macedo, C. C. S.; Abreu, F. R.; Tavares, A. P.; Alves, M. B.; Zara, L. F.; Rubim J. C.; Suarez, P. A. Z.; J. Braz. Chem. Soc.
2006, 17, 1291.
33. Abreu, F. R.; Alves, M. B.; Macêdo, C. C. S.; Zara, L. F.; Suarez, P. A. Z.; J. Mol. Catal. A: Chem.2005, 227, 263.
34. Keim, G. I.; US patent 2,383-6011945. (CA 1946, 40, 4617). 35. Marchetti, J. M.; Miguel, V. U.; Errazu, A. F.; Fuel2007,
906.
36. Kusdiana, D.; Saka, S.; J. Chem. Eng. Jpn.2001, 34, 383. 37. Jackson, M. A.; Mbaraka, I. K.; Shanks, B. H.; Appl. Catal., A
2006, 4, 310.
38. Kiss, A. A.; Omota, F.; Dimian, A. C.; Rothenberg, G.; Top. Catal.2006, 40, 141.
39. Minami, E.; Saka, S.; Fuel2006, 85, 2479.
40. Mbaraka, I. K.; Shanks, B. H.; J. Catal. 2005, 229, 365. 41. Di Serio, T. M.; Guida, M.; Nastasi, M.; Santacesaria, E.; Ind.
Eng. Chem. Res. 2005, 44, 7978
42. Guo, C.; Qian, Z.; Catal. Today1993, 16, 379. 43. Nowak, I.; Ziolek, M.; Chem. Rev. 1999, 99, 3603.
44. Aranda, D. A. G.; Antunes, O. A. C.; WO 2004096962, 2004. 45. Gonzalez, W. A.; Nunes, P. P.; Ferreira, M. S.; Martins, E. P.;
Reguera, F. M.; Pastura, N. M. R.;Encontro de Energia no Meio Rural, Campinas, Brazil, 2000. Proceedings online, available from http://www.proceedings.scielo.br/scielo.php?script=sci_a rttext&pid=MSC0000000022000000200047&lng=en&nrm=a bn, accessed in December 2008.
46. Okazaki, S.; Kurosaki, A.; Catal. Today1990, 8, 113 47. Noda, L. K.; Quim. Nova1996, 19, 135.
48. Neto, B. A. D.; Alves, M. B; Lápis, A. A. M.; Nachtigall, F. M.; Eberlin, M. N.; Dupont, J.; Suarez, P. A. Z.; J. Catal. 2007, 249, 152.
49. American Oil Chemists’ Society; Official Methods and Recommended Practices of the American Oil Chemists’ Society,
Champaign, 1993.
50. Ikeya, T.; Senna, M.; J. Non-Cryst. Solids1988, 105, 243. 51. Kawano, Y.; Denofre, S.; Gushikem, Y.; Vib. Spectrosc. 1994,
7, 293.
53. Goiffon, A.; Spinner, B.; Rev. Chim. Min.1974, 11, 262. 54. Armaroli, T.; Busca, G.; Carlini, C.; Giuttari, M.; Galletti, A.
M. R.; Sbrana, G.; J. Mol. Catal. A: Chem.2000, 151, 233. 55. Kayo, A.; Yamaguchi, T.; Tanabe, K.; J. Catal. 1983, 83, 99. 56. Deng, H.; Wang, J.; Callender, R.; Ray, W. J.; J. Phys. Chem.
B 1998, 102, 3617.
57. Koudelka, L.; Mosner, P.; J. Non-Cryst. Solids2001, 293, 635.
58. Hardcastle, F. D.; Wachs, I. E.; Solid State Ionics1991, 45, 201.
59. Sawatari, Y.; Sueoka, T. A.; Shingaya, Y.; ITO, M.; Spectrochim. Acta, Part A 1994,50, 1555.
60. Fehrmann, R.; Hansen, N. H.; Bjerrum, N. J.; Inorg. Chem.
1983,22, 4009.
61 Janz., G. J.; Kozlovski, T. R.; Wait, S. C.; J. Chem. Phys. 1963, 39, 1809.
62. Ferraro, J. R; J. Mol. Spectrosc.1960,4, 99.
63. Kamboures, M. A.; van der Veer, W.; Gerber, R. B.; Phillips, L. F.; Chem. Phys. 2008, 10, 4748.
64. Brito, Y. C.; Mello, V. M.; Macedo, C. C. S.; Meneghetti, M. R.; Suarez, P. A. Z.; Meneghetti, S. M. P.; Appl. Catal., A2008, 351, 24.
65. Parshall, G. W.; Ittel, S. D.; Homogeneous Catalysis-The Applications and Chemistry of Catalysis by Soluble Transition
Metal Complexes, John Wiley: New York, 1992.
Received: October 6, 2008