Silica Nanoparticles Dispersed in a Self-assembled Viscoelastic Matrix: Structure, Rheology, and
Comparison to Reinforced Elastomers
Nicolas Puech, Serge Mora, Gr´egoire Porte, and Ty Phou
Laboratoire des Collo¨ıdes, Verres et Nanomat´eriaux, UMR 5587 CNRS Universit´e Montpellier 2, 34095 Montpellier, France
Isabelle Grillo
Institut Laue-Langevin (ILL), 6, rue Jules Horowitz, BP 156, 38042 Grenoble, France
Julian Oberdisse∗
Laboratoire des Collo¨ıdes, Verres et Nanomat´eriaux, UMR 5587 CNRS Universit´e Montpellier 2, 34095 Montpellier, France and Laboratoire Lon Brillouin (LLB), CEA Saclay, UMR 12, 91191 Gif-sur-Yvette, France
(Received on 16 July, 2008)
Model self-assembled networks of telechelic polymerC18−PEO(35k)−C18 in water have been studied.
The rheology of such transient networks has been investigated as a function of polymer concentration, and a typical percolation law has been observed. The network structure has been characterised by Small Angle Neutron Scattering inD2O, where the interactions between micelles formed by the hydrophobicC18-stickers
of the polymer give rise to a peak in the scattered intensity. These model networks have then been used as a matrix for the incorporation of silica nanoparticles (R=10nm), and we have checked individual dispersion by scattering using contrast variation. The rheological response of the networks is considerably modified by the presence of the silica nanoparticles, and in particular an interesting dependence of the relaxation time on silica concentration has been found. The analogy in reinforcement behaviour of such a self-assembled, viscoelastic, and aqueous system with model experiments of elastomers filled with nanoparticles is discussed by comparison to a silica-latex system.
Keywords: colloid-polymer mixtures, microemulsions, rheology, small angle neutron scattering
I. INTRODUCTION
Reinforcement of elastomers with hard fillers is a com-mon procedure for optimization of rheological or mechani-cal properties [1-6] . Many ways of incorporating the filler in the bulk polymer exist, the most popular being mechani-cal mixing. Other, usually more complex routes are in situ filler synthesis [5,6] , or polymerization around the filler par-ticles [7-10]. It is commonly admitted that mechanical re-inforcement depends on the state of dispersion of the filler particles, as well as on the interactions between the polymer matrix and the filler particles. The problem in many exper-imental systems resides in the fact that the dispersion of the nanoparticles is not a freely tuneable property, which impedes a detailed analysis of its contribution to reinforcement. More-over, different filler surface treatments give not only different matrix-particle interactions, but also different particle disper-sions.
As a first step of a systematic study of the reinforcement of elastic matrices, we have developed a silica-latex model system where the dispersion state of nanoparticles could be tuned with very little changes of the interfacial contribution [11-14] . This motivated research on different systems, where the interfacial contribution could be maintained at a constant level. Hydrogels may have this property, if the particles are hydrophilic and stable, which is why work on silica-filled oil-in-water microemulsion networks has been undertaken [15]. Such networks are made of microemulsion droplets stabilized by a surfactant and bridged by a triblock copolymer with hy-drophobic end-groups called telechelic polymer, which
some-∗
times micellizes also in absence of surfactant [16-29] . Very recently, networks of connected wormlike micelles have also attracted interest [29,30]. In the case of the microemulsion networks, the interfacial contribution, however, was not found to be zero, due to weak attractive interactions between the sur-factant molecules and the silanol groups on the silica surface [15,31].
In this paper, a study of a pure (surfactant-free) triblock-copolymer system in water is presented, and its reinforcement properties by individually-dispersed silica nanoparticles are discussed in analogy with the silica-latex system. The ex-perimental systems and methods are presented in section II, and we discuss experimental results concerning structure and rheology of filled telechelic hydrogels in section III, and com-pare them to model silica-latex elastomers, before concluding in section IV.
II. MODEL SYSTEMS AND EXPERIMENTAL METHODS
A. Silica-latex nanocomposites
groups, and to the silanol groups on the silica surface which have the same function of charge stabilisation, the structure of these solutions is pH- and electrolyte responsive. In practice, the silica nanoparticles (B30,R≃10nm) were incorporated in a latex matrix containing poly(methyl methacrylate) and poly(butyl acrylate) in such proportions that the glass transi-tion temperature was set to 33oC. The initial radius of the latex particles was R = 14 nm.
B. Silica-telechelic hydrogels
Synthesis of the triblock copolymer CH3−(CH2)17− NH−CO−O−(CH2−CH2−O)n−CO−NH−(CH2)17− CH3has been described elsewhere [32,33] . Here we study
a 35k-poly(ethylene oxide) chain which has a hydrophobic C18-sticker at each extremity, connected through a urethane
group. The radius of gyration of the PEO-block is about 80 ˚A. Bindzil silica (B30/220, 30% wt) suspended in water was a gift from Akzo Nobel. The pH of the delivered stock solu-tions was set between 9 and 10 in order to ensure maximal colloidal stability to the silica by electrostatic repulsion. All silica-containing samples have thus been prepared at pH 10, all others at pH 7. The order of mixing of the components is of importance due to the high viscosity of the telechelic poly-mers networks. First we have prepared the sample containing silica nanoparticules and finally we add the telechelic copoly-mer. Two different batches have been used for the data shown in Figure 3 and all other plots.
C. Rheology
(a) Oscillatory shear experiments: Storage and loss moduli were determined as a function ofωin the linear regime (low amplitudes,γ=10%), and we have checked linearity up to 20%. As with the data presented in the literature,G′andG′′ of telechelic polymer networks show essentially Maxwellian behaviour, i.e. they can be characterized by a modulus G and a single relaxation time. Minor deviations from Maxwellian behavior are discussed later in the article.
(b) Stretching: The mechanical properties of silica-latex nanocomposites have been tested by uniaxial stress-strain isotherms. The reference case for the mechanical tests was given by the stress-strain isotherms of the pure latex films. These were found to depend strongly on pH, which is why the reinforcement factor presentation was chosen to highlight the filler contribution to the stress. This presentation con-sists in normalising at each deformation the nanocompos-ite stress by the stress of the pure latex sample at the same pH,σ(λ)/σlatex(λ). It thus answers the question, how much stronger the composite with respect to its own matrix is.
D. Small Angle Neutron Scattering (SANS)
Scattering experiments have been performed on beamline PACE at LLB (Saclay) and on the beamline D11 at ILL (Grenoble). The configurations were (1 m and 4.68 m at 6
˚
A; 4.68 m at 13 ˚A) at LLB and (1.2 m, 5 m, 20 m at 6 ˚A;
34 m at 10 ˚A) at ILL. Samples have been prepared inD2O,
small quantities ofH2Ofrom the silica stock solution have
been accounted for in the calculation of the solvent scatter-ing length densities. Empty cell scatterscatter-ing has been sub-tracted, and detector efficiency has been corrected as usual with light water. Data were normalized either by an empty beam measurement (LLB), or by using beamline constants determined from standards (ILL). The incoherent background substraction was performed by comparing to Porod scattering expected for smooth interfaces.
III. RESULTS
A. Silica-latex nanocomposites
Several papers have been published on the silica-latex model system, and in particular on the structure of the silica in this particular polymer matrix [34,35]. For the sake of comparison with the hydrogel system, important results are recalled and put into perspective.
The structure of the silica nanoparticles in the matrix re-sults from the colloidal interactions, mainly electrostatics and Van der Waals, in solution before film formation. Exper-imentally, the structure is accessible by Small Angle Scat-tering, e.g. of neutrons, which essentially see a binary con-trast between particles and matrix. The scattering signal can then be decomposed in a form and structure factor contribu-tion, where the form factor can be measured independently using highly dilute silica stock solutions. The scattering ex-periment allows thus to access directly the structure factor, which is nothing but the Fourier transform of the pair corre-lation functions of the silica particles. Detailed analysis of the scattering data has been performed in the past [35], and the following, simplified picture was found to be compatible with the scattering experiment: silica particles, which inter-act mainly through electrostatic repulsion, carry more electro-static charges at higher pH in solution. This mechanism leads to a better dispersion of the nanoparticles in the polymer ma-trix, i.e. less aggregation, at high pH of the precursor solution. At lower pH (down to 4), the particles tend to aggregate in clusters of several thousands, which leads to very strong for-ward scattering. At intermediate solution pH, around 7, parti-cles aggregate in clusters of approximately one hundred, but the remaining repulsion between particles induces a strong liquid-like ordering of the clusters within the matrix. This leads to a characteristic peak in q-space, the position of which can be used to estimate the average aggregation number with good precision; in any event, such a structure is compatible with the scattering data, as shown by Reverse Monte Carlo simulations [35] .
In Figure 1, the mechanical response of the silica-latex nanocomposites is plotted as a function of elongation λ= L/L0, where L and Lo are sample length and initial length,
(about 4, 7, 9, called acid, neutral, and basic). The aggre-gation numbers indicated in the plot have been determined from the peak positions of the scattered intensities. It is clear from Figure 1, that the reinforcement factor, which tells us how much stronger the nanocomposite is with respect to the pure matrix, depends strongly on the state of dispersion of the nanoparticles. In particular, higher aggregation leads to con-siderably stronger reinforcement, especially at lowλwhere Young’s modulus is probed. At higher deformations, the rein-forcement factor decreases in all cases, but stays still superior in the case of the low-pH samples. A simple interpretation of thisλ-dependence is that big aggregates contribute strongly to reinforcement, and that they break up under deformation, thereby reducing the reinforcement factor of the composites [36]. At large deformation, finally, only small aggregates and potentially slightly different interfacial interactions contribute to the reinforcement.
FIG. 1: Reinforcement factor of silica-latex nanocomposites (Φsi= 5%, three samples at pH ca. 4, 7 and 9), as a function of relative elongationλ=L/L0. The average aggregation numbers have been
measured by Small Angle Neutron Scattering, see text for details.
This analysis of the reinforcement factor emphasises the fact that in silica-latex nanocomposites the contribution of the interface is if not constant, at least negligible with re-spect to the contribution of the structure or nanoparticle dis-persion. On the other hand, the dominant influence of the structure is clearly visible, as smaller aggregates contribute less to the reinforcement. Such considerations have motivated the study of a completely different system, based on water-soluble polymer network structures, where it was thought that the nanoparticles can be individually dispersed in the solvent, with little or no interaction with the polymer. As indicated in the introduction, a first system, based on a microemulsion connected with telechelic polymer, has proven to interact with the silica due to formation of surfactant micelles on the sil-ica surface [15]. In this paper, we present new experimental evidence for a surfactant-free transient network system. It displays interesting rheological properties, which are further enhanced by addition of silica nanoparticles.
A. Silica-telechelic hydrogels
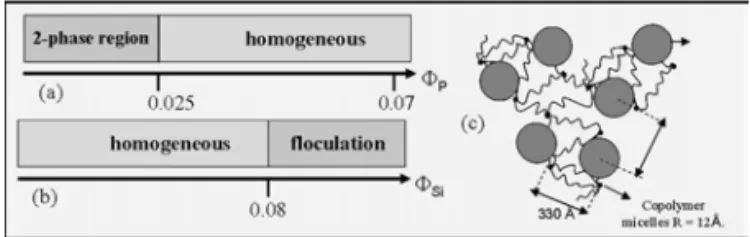
The phase behaviour of telechelic copolymer C18 −PEO(35k)−C18 in water has been studied at
22oC. In Figure 2, the system is seen to phase separate at low volume fractions, and to present a homogeneous phase above
Φp=2.5%. This homogeneous phase is transparent and colourless, and upon simple visual inspection viscoelastic properties are found. Note that in microemulsion systems, a fluid monophasic domain made of flowers (unconnected copolymer micelles) is usually found at very low volume fractions [37] , but this was not the scope of the present study. If we add silica nanoparticles in aqueous solution, at a fixed polymer volume fraction of Φp=3% and at a pH of the mixture of 10 to ensure nanoparticle dispersion, the system stays monophasic up to silica volume fractions of
Φsi=8%, and flocculates above. We have determined typical sizes and distances by Small Angle Neutron Scattering, cf. below, and in Figure 2 the result of this analysis is sketched on the right-hand side. The dense transient network of the copolymer is made of rather small hydrophobic domains (the nodes), connected by the PEO-chains. The silica particles, although of nanometric size (R=100 ˚A), are embedded in this network, and positioned at typical distances of 400 ˚A.
FIG. 2: Phase diagram of 35k copolymer in water for increasing polymer volume fractionΦp at pH 10. (b) Phase diagram of 35k copolymer in water atΦp=3% for increasing silica volume fraction at pH 10. (c) Schematic view of transient copolymer network.
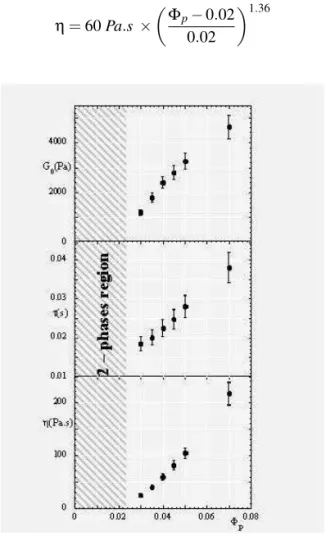
The rheological properties of the pure copolymer network in water have been studied as a function of polymer volume fraction Φpin the monophasic region (cf. Fig. 2) by small amplitude oscillatory shear experiments and flow curvesσ(˙γ). The oscillatory shear experiments, performed in the linear do-main (ω=1−300rad.s−1,γ=10%), give access toG′and G′′, whereas the flow curves yield the viscosityη. A Maxwell model was fitted toG′andG′′(ω), giving the plateau modu-lusGand the relaxation timeτ, cf. ref. [15] for details. The main results are summarized in a single plot as a function of polymer volume fraction Φp in Figure 3. The outcome of the two experiments, oscillatory shear and flow, is coher-ent within errorbars, as the viscosity of a Maxwell fluid is also given by η=Gτ. Unlike the treatment in terms of a percolation model suitable for the connected microemulsion model, the existence of a phase separation does not allow us to use such a model over the complete concentration range. We have nonetheless tempted a percolation fit on the mod-ulus, the relaxation time, and the viscosity, and obtain the following equations:
G=2200Pa×
Φp−0.02 0.02
0.8
τ=0.022s×
Φ
p−0.02 0.02
η=60Pa.s×
Φ
p−0.02 0.02
1.36
FIG. 3: ModulusGinPa,τinsandηinPa.sof 35k copolymer network as a function of polymer volume fractionΦp.
The critical value characterizing the onset of percolation in polymer volume fraction, 0.02, is found to be identical for all three quantities. It is located within the two-phase re-gion, which is expected given that the monophasic region has gel properties up to the phase boundary. The prefactors and the exponent satisfy the relationship for Maxwell fluids quite well, as the product of the prefactors of modulus and relax-ation time is comparable to the one of the viscosity, and the exponents add up. For further comparison, keep in mind that the data in Fig. 3 have been obtained with a different polymer batch, but all observed tendencies are robust.
The changes in the rheological properties of the copoly-mer network atΦp=3% upon addition of silica nanopar-ticles have been measured following the same experimental protocol. As it will be shown below, the network still shows a dominant single relaxation time, with a minor second contri-bution in presence of silica. We have thus fittedG′andG′′(ω) as before, and in Figure 4 the resulting modulusGis plotted as a function of silica volume fraction. The modulus is found to increase by about 30% in the observed range, and a linear fit givesG=2300Pa(1+5.2Φsi).
In Figure 5, the relaxation time τ determined through the Maxwell fit is represented as a function of silica con-tent. This quantity is found to increase considerably, by more than 50% in the observed range, and a linear fit gives
τ=0.02s(1+Φsi). Such a behaviour is striking. In par-ticular, we have previously observed in filled microemulsion networks that the relaxation time decreases with silica vol-ume fraction, proportional to (1−2ΦSi). The interpretation
FIG. 4: ModulusGin Pa of filled 35k copolymer network (Φp= 3%) for increasing silica volume fractionΦSi. All samples are at pH 10.
of this peculiar behaviour is unclear at the moment, and prob-ably related to differences in the microstructure. The PEO chains may interact through hydrogen bonding with the nega-tively charged silica surface (high pH). The energetic barrier, however, would be of the order of kT for one such bond, thus very small with respect to the energy necessary to pull out a C18-sticker out of a hydrophobic domain. An alternative
ex-planation might be that the silica particles sterically hinder reorganisation of the polymer molecules, and thus relaxation. In other words, a sticker leaving a micelle might not be able to reach another micelle, and might return to its original state of stress. To solve this issue, experiments as a function of temperature might give further hints on the physical origin of the slow down of this relaxation mode.
FIG. 5: Relaxation time in s of filled 35k copolymer network (Φp= 3%) for increasing silica volume fractionΦSi. All samples are at pH 10.
silica particles in solution. In a control experiment, we have measured the viscosity of pure silica solutions at the same pH (10), and the fit to this data is shown in Figure 6 (dotted line) for comparison. Given the much stronger rheological response of the filled copolymer network, with a viscosity re-inforcement of more than a factor of two, one can again only speculate on the physical origin of this effect.
FIG. 6: Viscosity in Pa.s of filled 35k copolymer network (Φp= 3%) for increasing silica volume fractionΦSi. Data is compared to the viscosity of a pure silica solution (dotted line) and to the Einstein prediction (solid line). All samples are at pH 10.
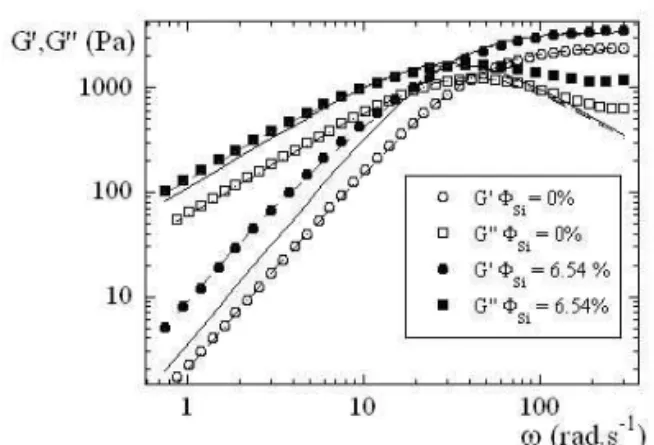
We now come back to the existence of a second relaxation time in the silica-filled copolymer network. Experimental ev-idence is plotted in Figure 7, whereG′andG′′(ω)with and without silica filler are compared. In the pure copolymer net-work, the Maxwellian fit is satisfactory, whereas a mismatch at low frequencies was observed in the silica-filled system. For the sake of clarity, only the calculation for G′(ΦSi= 0.0654)andG′′(ΦSi=0.0654), single mode is shown in Fig-ure 7 as illustration of the mismatch (solid line).G′andG′′for both systems have been fitted with a model expression with two relaxation times (dotted lines), and thus four parameters in total, all given in the figure caption. The corresponding fit is seen to be much better at low frequencies, for all data, although essentially the same relaxation times were used for the fits (0.2sand 0.032s). Note that due to the weakness of the effect, the choice of the parameters of the slower mode is not unambiguous, and several couples (G2,τ2) may be found.
They all have in common, however, thatG2is much smaller
thanG1 , andτ2much larger thanτ1. It is also clear from
these parameters (lowG2) that the silica-free network does
not need a second mode for a proper description.
As indicated in Figure 2, we have quantitative information on the structure of the telechelic gel filled with silica nanopar-ticles. We start with the structure of the pure hydrogel at a copolymer volume fraction ofΦp=2% inD2O. The change
in solvent is necessary to highlight the polymer in Small An-gle Neutron Scattering. As usual, it slightly shifts the phase boundaries, and the 2% sample inD2Owas monophasic and
in a gel state. In Figure 8, the scattering cross sectionI(q)is plotted as a function of wavevectorq. Three different scat-tering regimes are found. At low q, the intensity decreases roughly proportional to 1/q2. This low-qbehaviour is related to the concentration fluctuations of the copolymer, whose hy-drophobic blocks constantly form and break-up small
mi-FIG. 7: StorageG′(Pa) (
•
) and lossG′′(Pa) () modulus as a function of ωof (a) a filled 35k copolymer network ( Φp=3%,Φsi=6.54%) compared with a copolymer network without silica (G′ (
◦
) andG′′(),Φp=3% andΦsi=0%). With silica, departures from Maxwellian behaviour are emphasized inG′′at highω, and inG′at lowω, which is illustrated by the solid line calculated forG′with silica, using a single relaxation time (G1=3200Pa;τ1=
0.032s). The dottted lines are fits with a double Maxwell model
G1=3200Pa;G2=140Pa,τ1=0.032s;τ2=0.2sfor the filled
network andG1=2400Pa;G2=15Pa;τ1=0.024s;τ2=0.2s
for the pure network.
cellar regions. Around q0≃0.02 ˚A−1, a prominent
correla-tion peak can be seen, which we interpret as the signature of the positional correlations between the small micellar re-gions. From the properties of the Fourier transformation, a typical average distance of 2π/q0≃320 ˚Abetween centers
of micelles can be deduced. The number of micelles per unit volume is thus 3.1016 cm−3, whereas the number of
poly-mer molecules at 2%V is 3.4·1017cm−3. Eleven molecules
or 22 stickers thus participate in the formation of an aver-age micelle. Using the typical size of a hydrophobic C18
-sticker, we can estimate the volume of a hydrophobic do-main to V ≃10000 ˚A3, which corresponds to a radius of 13 ˚A. The form factor scattering of these hydrophobic regions would start at approximately I0=Φh∆ρ2V , which is very low (0.1cm−1, with the volume fraction of the hydrophobic region 3.10−4, and the contrast estimated to 5·1010 cm−2)
compared to the observed signal. The entire chain thus con-tributes to the scattering, and an analogous calculation for the form factor scattering of a single chain gives 3cm−1. At high q, finally, a scattering law typical for chains in good solvent is found (I∝q−1.7). It must be emphasized that the typi-cal sizes clearly visible in neutron scattering and the equally well-known chain characteristics appear to be in contradic-tion, as the radius of gyration is considerably smaller than the average distance between objects. Chains do not appear to be stretched on average, if one trusts the high-q behaviour. A consistent picture would be that only a fraction of chains is stretched to connect the hydrophobic domains, whereas the others are present as loops or dangling ends. Concerning this latter hypothesis, it may be noted that the hydrophobic do-mains, which are rather small, fluctuate constantly, possibly up to complete disintegration, and that single stickers may be found in solution (dangling ends).
index-FIG. 8: Scattered intensityI incm−1 as a function of wave vector
qin ˚A−1 in pureD2Oof 35k copolymer network with a volume
fractionΦp=2% (). The data is compared to the intensity of the same network containing 6.54%V of index matched silica particles (
•
, ρsolv=ρSi=3.5·1010cm−2). The latter intensity has been rescaled to the one of the pure copolymer in order to compensate the differences in contrast.matched (and thus invisible) silica particles. The intensity has been rescaled to compensate the difference in scatter-ing length density of the solvent, and the good superposi-tion at large-q shows that the chains obey the same chain statistics (good solvent). The difference in the low-q scatter-ing (an apparentq−1.1power-law) and the slight shift in the peak position indicate that the positional correlations between the hydrophobic domains have been ordered by the presence of the silica particles. This may have been caused by the crowded environment created by the silica particles, as we have sketched it in Figure 2. Note that there is no straightfor-ward interpretation for the low-q scattering laws in absence or presence of silica. The only sure fact is the absence of a low-qscattering plateau, which indicates that there are con-centration fluctuations involving many molecules.
As a last point, we now discuss the dispersion of the silica in the copolymer network. Unfortunately, we do not have a complete data set on the same system. In Figure 9, scattered intensities collected on a very similar system, made of small micelles connected by the same 35k-copolymer are shown. In this case, the small micelles have been indexed-matched, and only the silica contributes to the scattering. In a second experiment, the pure silica was measured in solution indepen-dently, and the two data sets have been rescaled to identical contrast conditions. As can be seen from the very good su-perposition of the intensities, the silica in the copolymer net-work is dispersed just as well as it is dispersed in pure solvent. The same result was found for the 35k-silica system, where the scattering was measured only at intermediate angles, and good superposition obtained. In conclusion, this proves that the silica particles are individually dispersed at these high pH values.
If we collect all the information obtained by rheology and scattering, it appears that there is a specific effect of the sil-ica nanoparticles on the flow properties of the copolymer net-work. Due to their electrostatic charge, the nanoparticles are suspended individually in the network in exactly the same way they are suspended in pure water. On the other hand, the configurations of the copolymer molecules are clearly seen to
FIG. 9: Scattered intensityI incm−1 as a function of wave vec-tor q in ˚A−1 of filled 35k networks containing contrast-matched microemulsion (, Φsi =6%, R = 30 ˚A, 4%, ρsolv = ρm = 0.3.1010cm−2). This is compared to the intensity of pure silica (
•
)at the same volume fraction, rescaled to identical contrast condi-tions.
be affected by the addition of the particles. It is unclear at the moment, if this effect is due to interactions between the poly-mer and the silica, or if the simple presence of the silica forces the polymer to reorganize spatially. In any event, important rheological changes are observed, and must be related to the modified polymer microstructure, as evidenced by SANS.
IV. CONCLUSIONS AND OUTLOOK
We have investigated and compared two very different nanocomposites. One is typical for elastomer reinforcement, where hard silica particles are dispersed in a latex polymer matrix. The other is a hydrogel, thus containing solvent, and silica particles suspended in the solvent. In the silica-latex system, mechanical reinforcement has been measured for different states of aggregation, for more or less identi-cal polymer-silica interactions. This allows us to identify the contribution of the filler structure to the reinforcement effect. The second system was designed to investigate the influence of structure in a similar way, and in this article a first series of results on a pure (surfactant-free) copolymer network with in-dividually dispersed silica particles is presented. When com-paring the reinforcement effect for similar silica volume frac-tions (5%−7%) in the two systems, it appears that it is of the same order of magnitude for low aggregation numbers. In both cases, the contribution is stronger than the Einstein pre-diction, and also stronger than the viscosity increase of a pure silica solution. In the case of the silica-latex nanocompos-ites, the origin of the effect is thought to be due to interfacial interactions, whereas in the hydrogels the situation is more complicated. In particular, it is not clear if the adsorption of copolymer onto the silica shall be viewed as an interfacial modification or a change in network connectivity. In future work, it will be interesting to create hydrogels filled with ag-gregated silica particles to allow for a full comparison.
flow around an isolated spherical particle [38]. In the other extreme, Smallwood has shown that Einstein’s prediction ap-plies also to the reinforcement of the modulus of a purely elastic solid [39] . In our case, we have measured both the modulus (Fig. 4) and the viscosity (Fig. 6) of a viscoelas-tic reinforced system. Note that the modulus corresponds to what would have been measured in a step-strain experiment, i.e.it is measured in absence of relaxation of the samples. As a result, it seems that we can both apply Smallwoods equation to the modulus, and Einsteins equation to the viscosity. How-ever, as the viscosity is given by the product of the modulus and the relaxation time, this can only work if the relaxation time is constant. In this article, we have provided evidence that this is not always the case, and that specific interactions can slow down (or speed up [15]) the relaxation time. This introduces an additional dependence on particle volume frac-tion, not taken into account in the original theories.
A possible extension of this system is to vary the structure of the silica particles, by decreasing the pH and thus the electrostatic interactions between nanoparticles. This can
be done in close analogy with the study of the silica-latex nanocomposites, where the aggregation numbers could be varied from a few to several thousands. It is unclear if a good control of monodispersity can be obtained using a similar protocol (pH changes); nonetheless, it would allow to conclude independently on the contributions of filler struc-ture, and specific filler-matrix interactions, some evidence of which has been reported on in this paper.
Acknowledgements
Work conducted within the scientific program of the Eu-ropean Network of Excellence Softcomp: Soft Matter Com-posites: an approach to nanoscale functional materials’, sup-ported by the European Commission. Silica stock solutions were a gift from Akzo Nobel.
[1] J. E. Mark, B. Erman and F. R. Eirich, Science and Technology of Rubber, Academic Press, San Diego, 1994.
[2] D. C. Edwards,J Mat Sci, 1990, 25, 4175.
[3] A. I. Medalia,Journal of Colloid and Interface Science, 1970, 32, 115-131.
[4] A. Voet,Macromolecular Reviews Part D-Journal of Polymer Science, 1980, 15, 327- 373.
[5] D. W. McCarthy, J. E. Mark, S. J. Clarson and D. W. Schaefer,
Journal of Polymer Science Part B-Polymer Physics, 1998, 36, 1191-1200.
[6] D. W. McCarthy, J. E. Mark and D. W. Schaefer, Journal of Polymer Science Part B- Polymer Physics, 1998, 36, 1167-1189.
[7] Z. C. Pu, J. E. Mark, J. M. Jethmalani and W. T. Ford, Chem-istry of Materials, 1997, 9, 2442-2447.
[8] J. Berriot, F. Lequeux, H. Montes and H. Pernot, Polymer, 2002, 43, 6131-6138.
[9] J. Berriot, F. Martin, H. Montes, L. Monnerie and P. Sotta,
Polymer, 2003, 44, 1437- 1447.
[10] J. Berriot, H. Montes, F. Martin, M. Mauger, W. Pyckhout-Hintzen, G. Meier and H. Frielinghaus, Polymer, 2003, 44, 4909-4919.
[11] J. Oberdisse,Macromolecules, 2002, 35, 9441-9450.
[12] J. Oberdisse and B. Deme,Macromolecules, 2002, 35, 4397-4405.
[13] J. Oberdisse, A. El Harrak, G. Carrot, J. Jestin and F. Boue,
Polymer, 2005, 46, 6695- 6705.
[14] J. Oberdisse,Soft Matter, 2006, 2, 29-36.
[15] N. Puech, S. Mora, V. Testard, G. Porte, C. Ligoure, I. Grillo, T. Phou and J. Oberdisse,EPJE, 2008, DOI: 10.1140/epje/i2007-10275-3.
[16] T. Annable, R. Buscall, R. Ettelaie and D. Whittlestone, Jour-nal Of Rheology, 1993, 37, 695-726.
[17] G. Fleischer, F. Stieber, U. Hofmeier and H. F. Eicke, Lang-muir, 1994, 10, 1780- 1785.
[18] D. Vollmer, J. Vollmer, B. Sthn, E. Wehrli and H. F. Eicke,
Physical Review E, 1995, 52, 5146.
[19] M. Odenwald, H. F. Eicke and W. Meier, Macromolecules, 1995, 28, 5069-5074.
[20] M. Filali, R. Aznar, M. Svenson, G. Porte and J. Appell, Jour-nal of Physical Chemistry B, 1999, 103, 7293-7301.
[21] B. Xu, L. Li, A. Yekta, Z. Masoumi, S. Kanagalingam, M. A. Winnik, K. W. Zhang and P. M. Macdonald,Langmuir, 1997, 13, 2447-2456.
[22] H. BaggerJorgensen, L. Coppola, K. Thuresson, U. Olsson and K. Mortensen,Langmuir, 1997, 13, 4204-4218.
[23] E. Michel, M. Filali, R. Aznar, G. Porte and J. Appell, Lang-muir, 2000, 16, 8702- 8711.
[24] F. Molino, J. Appell, M. Filali, E. Michel, G. Porte, S. Mora and E. Sunyer, Journal of Physics-Condensed Matter, 2000, 12, A491-A498.
[25] F. E. Antunes, K. Thuresson, B. Lindman and M. G. Miguel,
Colloids and Surfaces a- Physicochemical and Engineering Aspects, 2003, 215, 87-100.
[26] P. Kujawa, H. Watanabe, F. Tanaka and F. M. Winnik, Euro-pean Physical Journal E, 2005, 17, 129-137.
[27] G. Porte, C. Ligoure, J. Appell and R. Aznar,Journal of Statis-tical Mechanics-Theory and Experiment, 2006.
[28] Y. Serero, V. Jacobsen, J. F. Berret and R. May, Macro-molecules, 2000, 33, 1841- 1847.
[29] T. P. Lodge, R. Taribagil, T. Yoshida and M. A. Hillmyer,
Macromolecules, 2007, 40, 4728-4731.
[30] L. Ramos and C. Ligoure,Macromolecules, 2007, 40, 1248-1251.
[31] G. Despert and J. Oberdisse,Langmuir, 2003, 19, 7604-7610. [32] D. Calvet, A. Collet, M. Viguier, J. F. Berret and Y. Serero,
Macromolecules, 2003, 36, 449-457.
[33] J. P. Kaczmarski and J. E. Glass,Macromolecules, 1993, 26, 5149-5156.
[34] J. Oberdisse, Y. Rharbi and F. Boue,Computational and Theo-retical Polymer Science, 2000, 10, 207-217.
[35] J. Oberdisse, P. Hine and W. Pyckhout-Hintzen, Soft Matter, 2007, 2, 476-485.
[36] H. Luo, M. Kluppel and H. Schneider,Macromolecules, 2004, 37, 8000-8009.
[37] M. Filali, M. J. Ouazzani, E. Michel, R. Aznar, G. Porte and J. Appell,Journal of Physical Chemistry B, 2001, 105, 10528-10535.
[38] A. Einstein,Ann. Phys., 1906, 19, 289.