GNSS/NTRIP SERVICE AND TECHNIQUE: ACCURACY
TESTS
Testes de acurácia para o serviço e técnica GNSS/NTRIP
JORGE PIMENTEL CINTRA1 MARCELO ANTONIO NERO2
DANILO RODRIGUES3 1
Escola Politécnica - USP Av. prof. Luciano Gualberto, Trav. 3, n. 380
CEP- 05508-010 – São Paulo - SP 2
Departamento de Engenharia Cartográfica - UFPE Centro de Tecnologia e Geociências – CTG Departamento de Engenharia Cartográfica – DECart
Av. Acad, Hélio Ramos, s/n – DECart 50740-530 - Recife - Pernambuco - Brasil
3
Alezi Teodolini
[email protected]; [email protected]; [email protected]
ABSTRACT
Keywords: NTRIP; NTRIP Network in Brazil; NTRIP and Accuracy of Coordinates; Test of Accuracy of GPS Receivers.
RESUMO
O presente trabalho descreve e analisa as experiências realizadas na Escola Politécnica utilizando a tecnologia GNSS/NTRIP, em termos de acurácia. O método consiste em utilizar os dados de uma estação de referência, no caso estações da RBMC-IP do IBGE, coletados na estação remota, através de internet e telefonia celular para obter em tempo real coordenadas com maior precisão que as do método de navegação. Os experimentos consistiram no levantamento de pontos de coordenadas conhecidas e análise dos erros obtidos. Primeiro em distâncias curtas na base USP de calibração de equipamentos e, a seguir, em distâncias crescentes até aproximadamente 30 km, em função dos limites previstos para o método RTK; e também para distâncias maiores utilizando o método DGPS, até 2.700 km. Foram testados e analisados: o uso de diferentes estações de referência; a variação da acurácia com a distância; o uso de um receptor L1 e outro L1/L2, bem como o uso das técnicas RTK e DGPS em termos de acurácia, isto é, a diferença entre essas coordenadas e aquelas consideradas como padrão, verificando se os equipamentos atingem os valores previstos nas especificações técnicas.
Palavras-chave: NTRIP; Rede NTRIP do IBGE, NTRIP e Precisão de Coordenadas, Teste de Acurácia de Receptores GPS.
1. INTRODUCTION
Some years ago, in cooperation with different institutions, IBGE implemented the Brazilian Continuous Monitoring Network (RBMC), constituted of some stations that have their final coordinates with a ± 5 mm accuracy. In each of them, with fully automated operation, the receivers continuously collect and store observations on the code and on the carrier phase transmitted by GPS satellites. These data have daily been transmitted from each station to the RBMC control center, in files corresponding to sessions starting at 00h 01min and closing at 24h 00min (universal time), with a 15 s tracking interval.
The collection service, at a 1s rate, was recently implemented in different stations (RBMC-IP network, Figure 1) and the transmission of these data to the IBGE Control Center via Internet. A user, registered at IBGE with login and password, can thus access this control center and obtain the data referring to the stations of interest. These data are basically station coordinates, antenna height, system parameters, events data and mainly the GPS and GLONASS, L1 and L2 observation data, which allow calculating accurate positions, using both code (DGPS) and carrier (RTK).
Maritime Services. In turn, the protocol involved in the NTRIP service is based on the HTTP, an acronym for Hypertext Transfer Protocol, an abbreviation Internet users are familiarized with, since it appears in all Internet addresses (http://www). In this paper, NTRIP is proposed to be classified as a Service and not as a mere
Protocol, even though the data have a specific format.
This scheme allowed users of a single receiver to calculate positions with greater accuracy, processing data deriving from the RBMC-IP information with their own data. These data transmissions, which used to be made by radio, can now also be made by cell phone, using the GSM/GPRS technology (Global System for Mobile Communications/General Packet Radio Service).
For relatively short distances (up to 10-15 km), the RTK (Real Time Kinematic) technique is used, which works with phase and is more accurate; for longer distances, the DGPS technique is applied, which works with code and corrections of the distance satellite-receiver, and provides smaller accuracy.
Some experiments conducted atthe School of Engineering of the University of Sao Paulo, are presented here, involving these techniques and technologies. The corresponding station of the RBMC-IP is named POLI (figure 1).
2. OBJECTIVES AND METHODOLOGY
As stated in the Introduction, we propose to classify the NTRIP as a service and not only as a protocol. This service, using cell phone and Internet, provides the user with a single receiver to access the data of the RBMC-IP and calculates the coordinates of points of interest with good accuracy and in real time.
Since the service uses known technologies and methods, theoretical or scientific developments of the NTRIP itself are not expected, although technological improvements are possible. Thus, there are no published papers with scientific characteristics, but descriptions of use (COLOMBO, 2008), descriptions of implementation (IBGE, 2009), presentations of test results (CHEN and LI, 2004), applications and benefits (LENZ, 2004), cost studies (FRASER et al, 2005), and an article about improvement precision (WEBER and al., 2007), wich despite its title, applies equally to other methods, not specifically to NTRIP.
After all, one feels the lack of published articles that specifically examine not only the precision, but also the accuracy of the equipment using these services. Thus, the purpose of this paper is to present a methodology to test the accuracy of the equipment working in NTRIP networks, and more specifically, using the RBMC-IP as a study case, to verify whether the values are reached or not by checking the manufacturer's technical specifications.
The methodology consist in comparing the coordinates resulting from field surveying with more accurate ones, in this case, those of the USP Base for Equipment Calibration which furnishes the coordinates of points and distances accurately with accuracy better than the millimeter (PACILÉO NETTO, 1997).
In the development and application of this methodology, tests were performed to verify the discrepancies in the three coordinates (N, E, h), using equipment of one (L1) and two frequencies (L1/L2). Fixed a reference station, well-known coordinate points have been taken at increasing distances: 0.5 to 35 km for L1 equipment and 0.5 to 109 km for L1/L2 equipment. In other test, chosen a fixed point of known coordinates, points of the RBMC IP at increasing distances (0.5 to 2,700 km) are taken as a reference to study the variation with very large distances. This methodology allows verifying if the errors found are within the range recommended by the manufacturer's technical specifications, which usually is presented in an equation form with one fixed term and another variable with distance p = ± (a+b.s).
3. ACCURACY TEST AT THE USP BASE USING THE POLI STATION AS A REFERENCE
In order to test the accuracy of equipment and techniques, a first test was performed at the USP Base for Equipment Calibration (Figure 2), near the Olympic race-course of the University. This was done by means of comparing the coordinates provided by the equipment with the official and adjusted coordinates from 5 pillars (P01, P1A, P1, P2A and P2) which present very good (millimetric) accuracy and were considered a comparison standard.
As a RBMC-IP reference station, the POLI station (international code 93800) was used, which is located near to the Polytechnic Engineers Association
(AEP-Associaçao dos Engenheiros Politecnicos) building and to the one of the Administration building of the Escola Politecnica of USP, at Cidade Universitaria
(Sao Paulo, Brazil), and also located near the USP Base (less than 1 km).
In the first experiment, the rover equipment used was the Magellan Promark3-L1 receiver, i.e., with a single carrier. In the field work, a PAD/cell phone, connected to the RBMC Control Center, obtained the data from the POLI Station and transmitted them to the receiver by using the Bluetooth communication technology. The receiver, using its own data and those received, calculated the proper position with a delay, called latency, of 2s.
Figure 2 – USP Base for Equipment Calibration, with the approximate position of the pillars used in the experiments. Adapted from Google image.
equipment provided the coordinates of the pillar in question (N, E, h), which were configured for the SIRGAS 2000. After occupying the 5 reference pillars (for near 10s at each point), the coordinates were transferred to an electronic spreadsheet for comparison with the reference coordinates. Table 1 shows the results of the calculations for the first pillar and Table 2 summarizes the differences found in the 5 pillars.
Table 1 – Comparison between reference and collected coordinates (L1).
Pillar P01 Coordinates UTM (m) Discrepancies
Coordinate Collected Reference Delta (m)
N 7,394,441.133 7,394,441.125 0.008 E 323,237.628 323,237.627 0.001
h 718.245 718.230 0.015
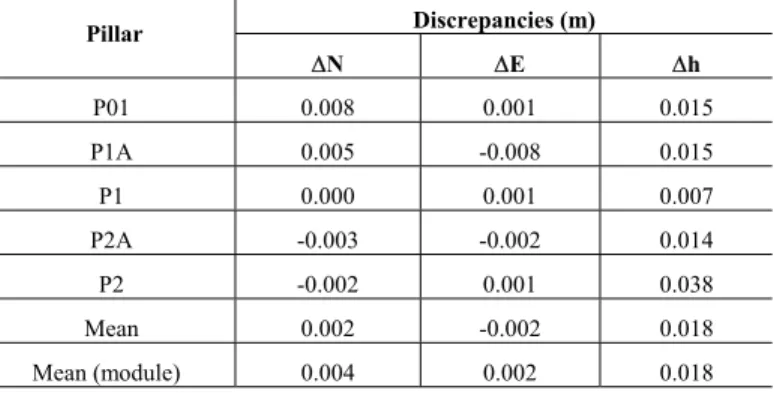
Table 2 – Discrepancies between reference and collected coordinates (L1).
Discrepancies (m) Pillar
∆N ∆E ∆h
P01 0.008 0.001 0.015
P1A 0.005 -0.008 0.015
P1 0.000 0.001 0.007
P2A -0.003 -0.002 0.014
P2 -0.002 0.001 0.038
Mean 0.002 -0.002 0.018
Mean (module) 0.004 0.002 0.018
The same test was conducted with a dual frequency equipment, the Magellan Promark-500 receiver, which dispenses the use of a cell phone, once it counts on a small internal plate (cell chip) which conducts the communication function directly with the RBMC control center-IP computer. The 5 pillars were occupied by the equipment and their coordinates collected; the result is shown in Table 3.
The comparison between Table 3 and Table 2 shows that there was practically no improvement in average accuracy with the change in equipment at this short distance (which was to be expected); the values of the differences of coordinates
Table 3 - Discrepancies between reference and collected coordinates (L1/L2).
Discrepancies (m) Pillar
∆N ∆E ∆h
P01 0.010 0.002 0.021
P1A 0.005 0.004 -0.024
P1 -0.001 0.001 -0.013
P2A -0.003 -0.001 -0.007
P2 0.000 -0.004 -0.017
Mean 0.002 0.000 -0.008
Mean (module) 0.004 0.002 0.016
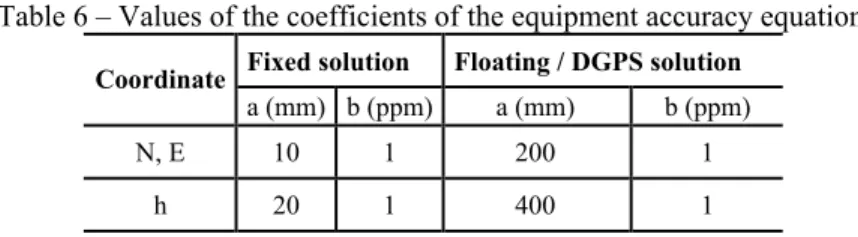
The accuracy of these two models of equipment, specified in the handbook, is the same and obeys the equation p = ± (10 mm + 1 ppm*d), for the horizontal components and p = ± (20 mm + 1 ppm*d), for the vertical component; d is the distance between the 2 stations. As the average distance between these points (near one another) and the POLI station is about 500m, the accuracy for these measurements should be below p = 10.5 mm (N,E) and 20.5 mm (h). Thus, these values are within the specifications, except for the vertical coordinate of point P1A, which slightly exceeds this value, a variation which lies within the statistical forecast. It can be pointed out that this accuracy is more than enough for a wide range of applications wished to be worked on in real time.
4. TEST WITH THE EQUIPMENT AT SHORT INCREASING DISTANCES This test, conducted in several campaigns (2 months), consisted in occupying different points of known and accurate coordinates, at growing distances, always within the range foreseen by the manufacturer, with the two types of equipment already described and in verifying the accuracy attained, comparing it with the value expressed in the catalogue, i.e., verifying whether it meets the specifications.
The data using the L1 and L1/L2 equipment (in an occupation time of 10 s approximately) are summarized in Tables 4 and 5, respectively, and are represented in the Figures 3 and 4.
(Tiradentes); in the three following vertexes, part of the solutions is fixed and part is floating (F/F); in the last point, the solution was floating. These values are compatible with the manufacturer indications: up to 10 km in one case and up to 40 km in the other.
Table 4 – Discrepancies between reference and collected coordinates (L1) in meters.
Vertex Place Distance (km)
∆N
(m)
∆E
(m)
∆h
(m) Obs. Solution
SAT
91607 USP 0.547 0.003 -0.001 -0.019 IBGE Fix
V-2295 Sumare 5,740 -0.009 0.020 -0.066 PMSP
Network Fix
V-2296 Anhangabau 9,466 -0.031 0.262 -0.598 PMSP
Network Float
V-2009 Perus 17,143 -0.076 -0.206 -0.184 PMSP
Network Float
V-2837 Parelheiros 30,421 -0.093 0.060 -0.131 PMSP
Network Float
V-2510 Tiradentes 34,858 -0.032 0.008 -0.099 PMSP
Network Float
Table 5 – Discrepancies between reference and collected coordinates (L1/L2) in meters.
Vertex Place Distance
(km) ∆N (m) ∆E (m) ∆h (m) Obs. Solution
SAT91607 USP 0.547 0.004 0.002 0.036 IBGE Fix
V-2295 Sumare 5,740 -0.015 0.014 -0.041 PMSP
Network Fix V-2296 Anhangabau 9,466 -0.005 -0.003 -0.006 PMSP
Network Fix V-2009 Perus 17,143 -0.011 0.015 -0.065 PMSP
Network Fix V-2837 Parelheiros 30,421 -0.01 -0.004 0.003 PMSP
Network Fix V-2510 Tiradentes 34,858 -0.014 0.004 -0.019 PMSP
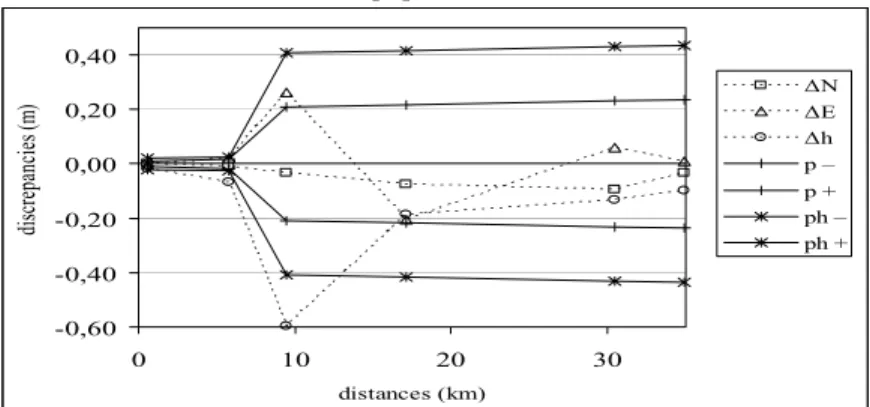
Figure 3 – Discrepancies in N, E and h, compared with the values of the manual. Equipment L1. -0,60 -0,40 -0,20 0,00 0,20 0,40
0 10 20 30
distances (km) di sc re panc ie s ( m
) ∆∆NE
∆h p – p + ph – ph +
Figure 4 – Discrepancies in N, E and h compared with the values of the manual. Equipment L1/L2. -0,60 -0,40 -0,20 0,00 0,20 0,40 0,60
0 20 40 60 80 100 120
distances (km) di sc re pa nc ie s ( m
) ∆N
∆E ∆h p – p + ph – ph +
Table 6 – Values of the coefficients of the equipment accuracy equation.
Fixed solution Floating / DGPS solution Coordinate
a (mm) b (ppm) a (mm) b (ppm)
N, E 10 1 200 1
h 20 1 400 1
In Figure 3, it can be seen that the third point (Anhangabau) presents greater discrepancy than that specified by the equipment: about 2 cm in the E coordinate and 20 cm in the h coordinate, extrapolating the accuracy limits. In Figura 4, no point exceeds the limits.
From these Figures (and corresponding Tables) one concludes that the equipment meets the specification: all the discrepancies are within the range defined by the p + and p- accuracy dashed lines; except at one point in E and h coordinates.
5. ACCURACY TEST USING RIOD STATION AS A REFERENCE
Taking advantage of the equipment availability and of the USP Base, new tests were carried out, using data obtained from other reference stations, starting from the RIOD station (Rio de Janeiro, RBMC-IP, 360 km far from the USP Base), in which the 5 pillars were occupied. Table 7 summarizes the differences.
Table 7 – Discrepancies between reference and collected coordinates (L1).
Pillar Discrepancies (m)
∆N ∆E ∆h
P01 -0.24 -0.16 0.63
P1A -0.25 -0.19 -0.20
P1 -0.33 -0.22 -0.14
P2A -0.42 -0.16 -0.07
P2 0.47 -0.14 0.35
Mean -0.15 -0.17 0.11
Mean (module) 0.34 0.17 0.28
The same test was conducted with the L1/L2 equipment, and the result is summarized in Table 8.
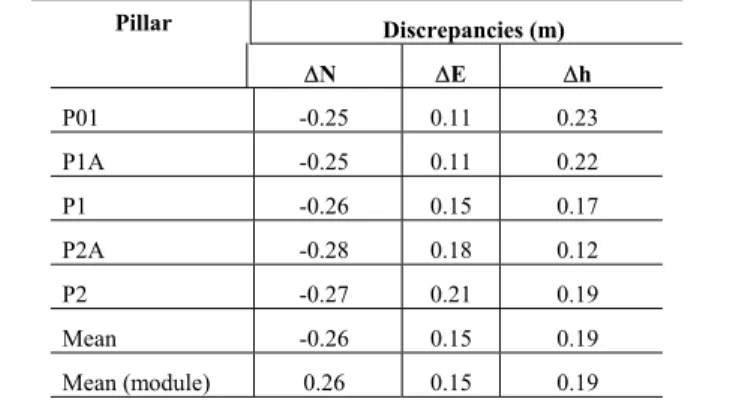
Table 8 – Discrepancies between reference and collected coordinates (L1/L2).
Pillar Discrepancies (m)
∆N ∆E ∆h
P01 -0.25 0.11 0.23
P1A -0.25 0.11 0.22
P1 -0.26 0.15 0.17
P2A -0.28 0.18 0.12
P2 -0.27 0.21 0.19
Mean -0.26 0.15 0.19
Mean (module) 0.26 0.15 0.19
In these two Tables, the greatest errors are observed to occur in the N coordinate of pillar P2 (47 cm) and in the h coordinate of pillar P01 (63 cm), both in the measurement with L1 equipment (Table 7). By the accuracy equation, calculated with the values in Table 6, and for a distance of 360 km (from RIOD to base) limits of ± 56 cm for the planimetry and ± 76 cm for the altimetry are reached, for both types of equipment, which count on the same accuracy as the catalogue for this case. Even though the L1/L2 equipment presents smaller values than the L1 equipment, all the measurements are within tolerance.
As expected and specified in the manual, there was a large growth in discrepancies as a result of the increase in distance (360km and not 0.5 km, as in the case of POLI station), yet these values (submetric accuracy, in all the coordinates) are very useful for several applications. One just has to think that, in the 1:2,000 scale, the maximum planimetric error (0.47m corresponding to 0.24 mm) is below 0.25mm, compatible with the IBGE class A parameters (0.3mm). In altimetry, the error is below 1/3 of the contour curves equidistance (0.67 m or 1/3 of 2m, in this case). For the L1/L2 equipment, the maximum error in any coordinate is below 30 cm, compatible with class A, in the 1:1,000 scale.
6. ACCURACY TEST WITH REFERENCE STATIONS AT INCREASING DISTANCES
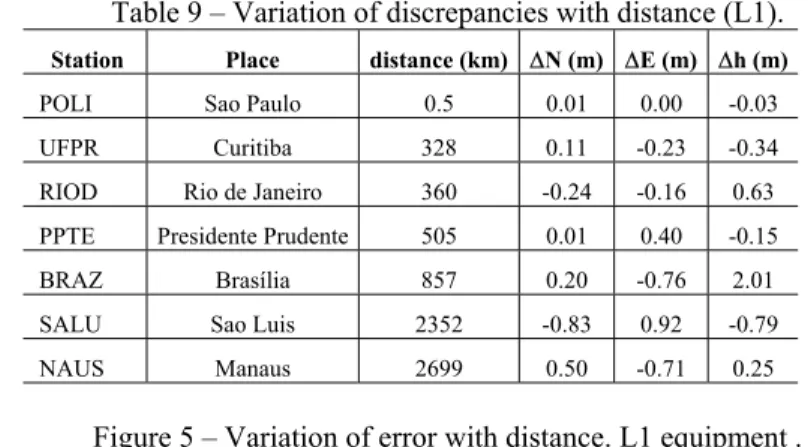
Table 9 – Variation of discrepancies with distance (L1).
Station Place distance (km) ∆N (m) ∆E (m) ∆h (m)
POLI Sao Paulo 0.5 0.01 0.00 -0.03
UFPR Curitiba 328 0.11 -0.23 -0.34
RIOD Rio de Janeiro 360 -0.24 -0.16 0.63 PPTE Presidente Prudente 505 0.01 0.40 -0.15
BRAZ Brasília 857 0.20 -0.76 2.01
SALU Sao Luis 2352 -0.83 0.92 -0.79
NAUS Manaus 2699 0.50 -0.71 0.25
Figure 5 – Variation of error with distance. L1 equipment .
-4,00 -3,00 -2,00 -1,00 0,00 1,00 2,00 3,00 4,00
0 500 1000 1500 2000 2500 3000 distances (km)
di
sc
re
pa
nc
ie
s (
m
) ∆N
∆E ∆h p – p + ph – ph +
From these values, it can be concluded that the error is submetric for all the coordinates, except for the Brasília station, for which the error is about 2m. It is worth emphasizingthat all these measures were repeated, resulting in values that confirm the first measurement. In dashed line, the straight lines that define the catalogue accuracy p = ± (a+ b.s) were included and, as pointed out, all the measurements N and E are verified to be within the specification; the only coordinate out of the specifications is that of Brasília. The line referring to ph+ was added to the graph and corresponds to the vertical positive accuracy, maximum limit, the a coefficient of which is equal to 40 cm.
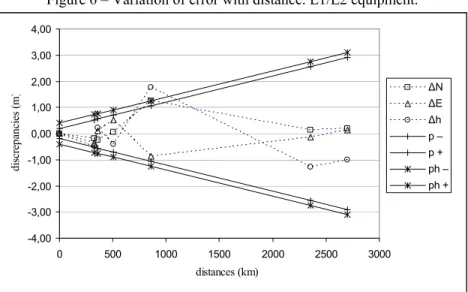
Table 10 – Variation of discrepancies with distance (L1/L2).
Station Place distance (km) ∆N (m) ∆E (m) ∆h (m)
POLI Sao Paulo 0.5 0.01 0.00 -0.03
UFPR Curitiba 328 -0.19 -0.35 -0.49
RIOD Rio de Janeiro 360 -0.25 0.11 0.23
PPTE Presidente Prudente 505 0.05 0.51 -0.40
BRAZ Brasília 857 1.24 -0.86 1.76
SALU Sao Luis 2352 0.14 -0.15 -1.27
NAUS Manaus 2699 0.19 0.14 -1.01
Figure 6 – Variation of error with distance. L1/L2 equipment.
-4,00 -3,00 -2,00 -1,00 0,00 1,00 2,00 3,00 4,00
0 500 1000 1500 2000 2500 3000
distances (km)
di
sc
re
p
anc
ie
s (
m
) ∆N
∆E ∆h p – p + ph –
ph +
Using the data from the Manaus station, located at a distance of 2,700 km, the error in the three coordinates was below 71 cm, showing the system potential (stations, equipment, programs, techniques) to obtain coordinates at very distant points (for the whole country) with good accuracy, based on this net.
good in planimetry, with errors below 20 cm in 2,700 km. Altimetry, in this and in all the cases is the coordinate with the worst accuracy, exceeding the dashed line referring to the accuracy of the h coordinate (ph+) in Brasília.
7. CONCLUSIONS
As a consequence of the results obtained, the equipment can generally be said to meet the specified accuracy, except in two cases:
a) Anhangabau Station, in the RTK/L1 technique, probably due to a situation in which the ambiguity was not solved (Float); the user should be alert to this fact and verify if the accuracy obtained meets the needs of the survey; in a negative case, the L1/L2 equipment should be used as in the present case (Table 5).
b) There may be a problem at a station (Brasília), with the DGPS technique, in which the h coordinate presented lower accuracy than that foreseen (about 2m).
Assessing the service and accuracy obtained for these points of the RBMC-IP one can say that:
c) These accuracies serve different applications in the mapping areas (punctual and linear features) and others, by using the RTK technique, in distances of up to about 10 km for L1 and to about 100 km for the L1/L2 equipment. It is worth noting that the accuracy attained (L1/L2 case) meets the requirements for class A mapping, according to the IBGE cartographic accuracy standards (PEC), for maps at a 1:1,000 scale which is 30 cm in the N, E coordinates and 0.33 cm in the h coordinate. In the L1 case, meets the requirements for class A for 1:2,000 scale or class B for 1:1,000 scale.
d) The good results from very distant stations such as that of Manaus, about 3,000 km away: less than 20 cm in the N coordinate, and about 70 cm in the h coordinate, give an idea of the present potentiality of the system, which can be further improved when there are more RBMC-IP stations and a more comprehensive cellular telephony coverage in the country.
The methodology used (namely the occupation of vertexes with known and precise coordinates) is eventually a method to firstly verify whether a type of equipment meets the values specified by the manufacturer.
Finally, it is worth remarking that the accuracy attained in each case strongly depends on the receivers and on the ionospheric activity; these are actually in-field data processors: they count on elaborated computational programs and capacity for performing very fast calculations in the field. Also, each receiver or manufacturer implements different programs and strategies to solve ambiguity and to calculate the coordinates
ACKNOWLEDGEMENTS
REFERENCES
CHEN R.; LI X. (2004): Test Results of an Internet RTK System Based on The Ntrip Protocol. European Navigation Conference GNSS 2004, Rotterdam, 16-19 May 2004 (1995).
COLOMBO, O. Real-Time, Wide-Area, Precise Kinematic Positioning Using Data from Internet NTRIP Streams, Colombo, O.L., Proceedings ION GNSS 2008, Savannah, Georgia. 2008.
FRASER, R.; MOWLAM, A.; Collier, P. Augmentation of Low–Cost GPS Receivers via Web Services and Wireless Mobile Devices”, Journal of Global Positioning Systems, Vol. 3, No, 1-2, 2005, pp. 85-94
IBGE, RBMC-IP: Rede Brasileira de Monitoramento Contínuo dos Sistemas GNSS em Tempo Real, 2009, disponível em http://www.ibge.gov.br/home/ geociencias/geodesia/rbmc/ntrip/presRBMC_IP.pdf, último acesso, novembro de 2010.
IBGE, RBMC - Rede Brasileira de Monitoramento Contínuo dos Sistemas GNSS, mapa da Localização das Estações RBMC-IP, disponível em
http://www.ibge.gov.br/home/geociencias/geodesia/rbmc/ntrip, Rio de Janeiro, último acesso em abril de 2011.
LENZ, E. Networked Transport of RTCM via Internet Protocol (NTRIP) – Application and Benefit in Modern Surveying Systems, FIG working week, Athens, Greece, 22-27 May 2004, Online (2006 February): http://www.fig.net/ pub/athens/papers/ts03/ts03_2_lenz.pdf.
PACILÉO NETTO, N. Campo de Provas para instrumentos de medição e posicionamento. Tese de Livre-docência, Escola Politécnica da USP, São Paulo, 1997.
WEBER, G., MERVART, L., LUKES, Z., C. ROCKEN, Real-time Clock and Orbit Corrections for Improved Point Positioning via NTRIP, Proceedings of the ION GNSS 2007, Fort Worth, September 2007.
(Recebido em novembro de 2010. Aceito em abril de 2011).