Article
J. Braz. Chem. Soc., Vol. 22, No. 8, 1539-1548, 2011. Printed in Brazil - ©2011 Sociedade Brasileira de Química
0103 - 5053 $6.00+0.00
A
*e-mail: [email protected]
#Present address: Universidade Federal da Fronteira Sul (UFFS),
89813-140 Chapecó-SC, Brasil - http://www.uffs.edu.br
Supramolecular Complexes Formed by the Association of Poly(ethyleneimine) (PEI),
Sodium Cholate (NaC) and Sodium Dodecyl Sulfate (SDS)
Arlindo C. Felippe,*,a Ismael C. Bellettini,a Renato Eising,a Edson Minattia and
Fernando C. Giacomellib
aDepartamento de Química, Universidade Federal de Santa Catarina, 88040-900 Florianópolis-SC, Brazil
bCentro de Ciências Naturais e Humanas, Universidade Federal do ABC, 09210-170 Santo André-SP, Brazil
A formação de complexos supramoleculares em solução aquosa pela associação do polieletrólito poli(etilenoimina) (PEI) com misturas do biossurfactante colato de sódio (NaC) e o surfactante aniônico dodecil sulfato de sódio (SDS) foi aqui investigado usando as técnicas de condutivimetria, tensiometria, luorimetria, espalhamento de raios X a baixos ângulos (SAXS) e medidas de pH. Os resultados de luorimetria, condutivimetria e medidas de pH levaram à conclusão de que os monômeros de NaC e SDS ligam-se primeiramente em sítios especíicos das cadeias do polieletrólito PEI via interação eletrostática e posteriormente através de associação cooperativa. A interação do NaC com o PEI é mais fraca do que a interação do SDS com o PEI, porém, a adição de SDS ao sistema NaC-PEI levou à formação de micelas mistas SDS-NaC que interagiram fortemente com o polieletrólito PEI. Os resultados de SAXS sugeriram que o complexo supramolecular possui característica elipsoidal e essa forma não depende da concentração de surfactante nem da χNaC.
The formation of supramolecular complexes produced by association of poly(ethyleneimine) (PEI) and mixtures of sodium cholate (NaC) and sodium dodecyl sulfate (SDS) was investigated by pH, electrical conductivity, luorescence spectroscopy and small angle X-ray scattering (SAXS) measurements. The luorescence linked to previously measured values of pH and conductivity led to the conclusion that NaC and SDS molecules irstly bind to speciic sites of the PEI chains via electrostatic interaction and secondly undergo self-assembly through regular cooperative association. The interaction of NaC with the polyelectrolyte PEI is weaker than that of SDS and the addition of SDS to the NaC-PEI system led to the formation of mixed NaC-SDS micelles which stronger interact with PEI. The SAXS results suggested that the micellar aggregates have a considerably ellipsoidal characteristic and the micellar shape is not affected by the surfactant concentration nor by χNaC.
Keywords: sodium cholate, sodium dodecyl sulfate, poly(ethyleneimine), polymer-surfactants
interaction
Introduction
Bile salts are naturally-occurring amphiphilic molecules. They are physiologically important in the solubilization and transport of fats and lipids. The structure of bile salts in water has been extensively investigated. Although they are comparable to common surfactants, the general conclusion is that biosurfactants self-assemble in a different way than the standard surfactants.1-13
Poly(ethyleneimine) (PEI) is a member of a large family of water-soluble polyamines having different molecular
weights (Mw) and polymer architectures. Polyamines are
formulations for transfection and expression of genes in vitro and in vivo14,15 and also in catalysis as an artiicial enzyme.16
Polymers and surfactants associate in aqueous solution leading to the formation of thermodynamically stable complexes and the inal physicochemical characteristics differ from those observed in pure surfactant micellar solutions.17-19 The mixture induces, for example, the formation of aggregates at an early stage than the critical micelle concentration (cmc) of the pure surfactant in
solution in a point that it is called critical aggregation concentration (cac). Therefore, it is possible to prepare
formulations by adding a polymeric component to a surfactant solution with a reduced amount of the latter one having the same or improved properties than the formulations containing solely surfactants.17,19
Our research group has extensively studied micellar systems formed by the self-assembly of copolymers20,21 and surfactants.22-25 We have investigated a large collection of synthetic polymers and biopolymers,26-28 as well as surfactants and biosurfactants.27-30 Interestingly, interactions between water-soluble uncharged polymers and the anionic surfactants have been widely investigated for several decades. On the other hand, few studies concerning the interactions of mixtures of bile salts and polyelectrolytes are found in the literature.
Polyelectrolytes, such as PEI, can interact with speciic surfactants leading to the formation of polymer-surfactant complexes. The structure of such complexes is dependent on the way in which the interaction occurs. These interactions might be purely through electrostatic interactions or inluenced by the molecular characteristics of the charged groups, the lexibility and architecture of the polymer chains and the types of counter-ions present in the system.31 Some researchers suggest that the formation of a polyelectrolyte-surfactant complex is accompanied by conformational changes in the polymer chains. Several techniques have been used to monitor these structural changes including luorescence, light scattering, small angle X-ray scattering (SAXS) and viscosity. Recently, SDS-PEI complexes have been investigated.31-36 Wang
et al.32 explored the inluence of the pH on the binding properties of SDS in linear and branched PEI. Winnik
et al.31,33,34 studied the inluence of the pH values and surfactant concentration on the SDS-PEI interaction through conductivimetry, light scattering, nuclear magnetic resonance (NMR), microcalorimetry and electrical conductivity. Meszaros et al.35 also studied this system and demonstrated that the interaction occurs in two steps: irstly there is a speciic binding of dodecyl sulfate ions (in the monomer form) to protonated amine
groups (evidenced by the increase in pH) and, secondly, a cooperative interaction of a hydrophobic nature occurs. Bastardo et al.36 performed light scattering and small angle
neutron scattering measurements on SDS/PEI complexes in order to probe the structure of the complexes at different pH values and SDS concentration. The experiments evidenced the presence of disk-like aggregates at low SDS concentration and more complex three-dimensional structures with increasing surfactant concentration.
Herein, we focus on the association of the bile salt sodium cholate (NaC) and mixtures of NaC and SDS and the polyelectrolyte poly(ethyleneimine) (PEI). The main aim was to verify and discuss the variations in the parameters such as critical micelle concentration (cmc), critical
aggregate concentration (cac) and polymer saturation point
(psp) as a function of surfactant concentration and molar
fraction of the biosurfactant (χNaC) in the presence of PEI, as well as in PEI-free solutions. The investigations were supported by pH value, electrical conductivity, steady-state luorescence of pyrene and SAXS measurements. In this regard, a model of the interaction between SDS, NaC and their mixtures with the polyelectrolyte PEI is proposed.
Experimental
Materials
Sodium dodecyl sulfate (SDS), sodium cholate (NaC) and pyrene were supplied by Sigma and used without further puriication. Poly(ethyleneimine) (PEI), Mw = 25000 g mol−1 was purchased from Aldrich. A stock PEI solution was prepared by dissolving the polymer in pure distilled water and the resulting solution was stirred gently at room temperature overnight. This stock solution was used to prepare those containing the surfactants. The PEI concentration is given as mass/volume percentage (% m/v) and the surfactant concentration mmol L−1. All results were obtained at (25.0 ± 0.1) °C.
pH and speciic conductivity measurements
conductometer. The pH value measurements were acquired
in a similar way using a Beckman φ 71 pH meter with a
combined glass electrode. The aliquots were added using a semi-automatic burette Metrohm Herisau (Multi-Burette type model E-485).
Steady-state luorescence
Measurements of the steady-state fluorescence of pyrene were performed in water. Firstly, a stock pyrene (Aldrich 99%) solution (0.001 mol L−1) was prepared in dry ethanol and a 10−6 mol L−1 pyrene aqueous solution was then prepared by adding 0.25 mL of the stock solution to 250 mL of water. The surfactant and surfactant-PEI samples were prepared using the aqueous pyrene solution. A steady-state luorescence spectrum of pyrene was recorded on a Hitachi F4500 Spectroluorimeter equipped with a thermostated cell holder set at 25.0 °C and the samples were continuously stirred in a quartz cell with a path length of 10 mm. Both the slits of excitation and emission monochromators were adjusted to 2.5 nm. The samples were excited at 336 nm and the emission spectra were recorded from 360 to 500 nm. Typically, the luorescence spectrum was recorded after the addition of each µL of surfactant solution. The I1/I3 ratio was
estimated by taking into account the ratio of the maximum peak intensity at 372.8 nm (I1) and at 384.0 nm (I3).37-41
Small angle X-ray scattering (SAXS)
The SAXS experiments were performed at the SAXS2 beamline of the Brazilian Synchrotron Light Laboratory (LNLS, Campinas-SP, Brazil). The wavelength (λ) of the incoming beam was set to 0.1488 nm. The samples were injected into a 1 mm-thick sample holder specially
designed for the LNLS SAXS beamlines.42 The collimated
beam crossed the samples through an evacuated light tube
(P < 0.1 mBar) and was scattered to a 2D CCD marCCD
detector with active area of 16 cm2. The sample-to-detector distance was set to 809 mm (Silver Behenate was used as the sample-to-detector distance calibration since it has a well-known lamellar structure, d = 58.48 Å). In this
geometry, the q range was covered from 0.18 to 4.5 nm−1. In all cases, the 2D-images were found to be isotropic and were corrected by taking into account the detector dark noise and normalized by the sample transmission. The corrected and normalized 2D images of the samples were subtracted from the corrected and normalized 2D image of the solvent, and the resulting images were then azimuthally integrated considering the 360o scan to give the inal Ivs.q proiles. The above procedures were carried out using the FIT2D software developed by Hammersley.43 The scattering
proiles of the aggregates were modelled by considering the form factor P(q) of an ellipsoidal core-shell object
with the inner core and the outer shell having different scattering length densities. The interparticle structure factor
S(q) was taken into account by using the mean spherical
approximation (MSA) according to Hayter and Penfold.44
A more detailed description of the model used is given in the next section. The itting procedures were performed using the SASit software which uses the least-squares itting approach consisting of minimizing the squared
chi (χ2). The SASit software package was developed by
Kohlbrecher and is available online.45
Results and Discussion
pH and speciic conductivity measurements
The aggregation processes were irstly monitored by means of conductivity and pH titration of the polymer solutions with surfactant solutions. These techniques provide useful information on the ionic mobility and availability of free ions in the system. By means of conductivity measurements, it is possible to observe the onset of surfactant aggregation in the polymer chains as well as the polymer saturation through the surfactant.46-49 In the titration process for strong polyelectrolyte case, the electrical conductivity variation is proportional to the amount of added surfactant, whereas for weak polyelectrolytes, such as PEI, it is dependent on the dissociation equilibriums that are related to the degree of ionization of the polymer chain.
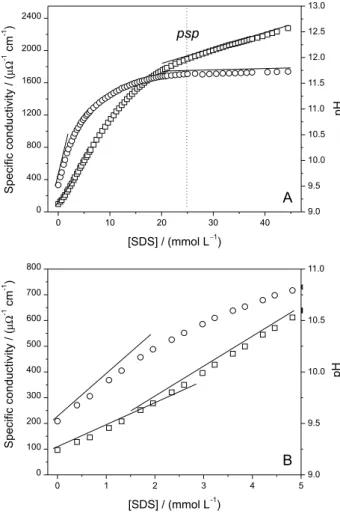
The variations of the speciic conductivity and pH value during the titration of a PEI solution 0.2% m/v with known amounts of SDS and NaC are given in Figures 1A and 2A, respectively. Figures 1B and 2B show the speciic conductivity and pH proiles at the beginning of each titration procedure.
Three different regions can be quite clearly distinguished in the specific conductivity and pH profiles given in Figures 1 and 2.
Surfactant concentration below cac
The pH value of a 0.2% m/v PEI aqueous solution is alkaline (pH ca. 9.5) due to the presence of the protonated
of the solution. The speciic binding of dodecyl sulfate (DS−) or cholate anions to the positively charged sites of
the PEI chains shifts the acid-base equilibrium towards the right-hand side of equation 1, i.e., in the direction of
hydroxide formation.
R3N(aq) + H2O(1) R3NH+(aq) + OH–(aq) (1)
In the same region, the increase in the solution electrical conductivity is related to the higher equivalent conductance of the hydroxyl (198.6 Ω−1 cm2 mol−1) compared to the dodecyl sulfate (21.59 Ω−1 cm2 mol−1) or cholate (13.90 Ω−1 cm2 mol−1) ion.29 At the end of the binding process,
i.e., when all the positively charged sites of PEI are illed, the
polymer chains behave as a neutral entity and the interaction with the surfactants SDS and NaC starts to take place through a cooperative process similar to the system constituted by the surfactant SDS and the neutral polymer poly(ethylene oxide) that is widely discussed in the literature.18,22,29,50,51 The beginning of the cooperative association between
polymer and surfactants, deined here as cac, starts at the
irst discontinuity in the proiles of speciic conductivity vs.
surfactant concentration, at ca. 5.0 mmol L−1 for NaC. For the PEI-SDS system, the proile does not show clearly the cac,
meaning that such technique is limited in the determination surfactant under low concentrations. Figures 1B and 2B show in details the regions.
Surfactant concentration between cac and psp
Moving from the cac to a higher surfactant concentration,
the pH value of the solution increases less abruptly than at the beginning of the titrations. This occurs up to around 25.0 mmol L−1 when the pH value is approximately 11.7 for the SDS system (Figure 1A) whereas the same phenomenon is observed up to 20.0 mmol L−1, when the pH value of the solution is ca. 10.5 for the NaC system (Figure 2A). These
concentrations indicate the second point of discontinuity in the profiles of specific conductivity vs. surfactant
concentration, which is denoted here as the saturation point of the polymer, psp. The formation of polymer-surfactant
Figure 1. Speciic conductivity () and pH () variation during the titration of PEI solution 0.2% m/v with SDS (A). The proiles at the beginning of the titrations are enlarged in (B). The drawn lines are just eye-guides.
supramolecular complexes takes place in the region between
cac and psp.
Surfactant concentration above psp
Finally, the pH value at quantities above psp is
surfactant-concentration independent. The pH value remained at ca. 11.7 for SDS and at ca. 10.5 for NaC. This
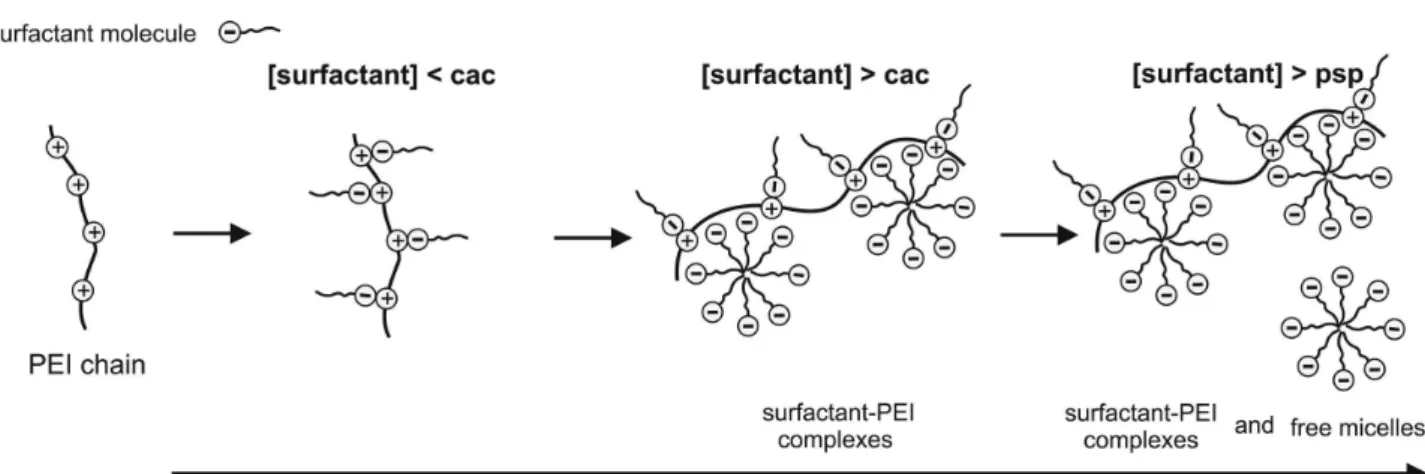
characterizes the third region of the aggregation proile. This behavior can be attributed to the formation of free micelles of SDS and NaC which are in equilibrium with the SDS-PEI and NaC-PEI supramolecular complexes. Figure 3 schematically represents the common steps of the PEI-surfactant associations.
Fluorescence measurements
Techniques using luorescent probes such as pyrene have been extensively used to monitor the surfactant aggregation processes.5,33,37,38,40,41 They are undoubtedly useful in determining key parameters, such as cmc and cac.
The luorescent probe pyrene has ive luorescent bands and the ratio between its I1(372.8 nm) and I3 (384.0 nm) bands
is sensitive to small changes in the environmental polarity. It is possible to monitor pyrene migration from a polar (water) to an apolar (micellar core) environment through the luorescence spectroscopy by measuring the I1/I3 ratio.40,41 The I1/I3 ratio of pyrene is used as a criterion to evaluate
the micropolarity of the microenvironments of micellar aggregates, and extreme values of this polarity scale comprise
ca. 1.8 for water and ca. 0.6 for hexane.40,41 Since the pyrene probe migrates from the polar aqueous medium to the apolar micellar cores during the surfactant micellization, the I1/I3
ratio becomes possible to follow the aggregation path. The proiles of I1/I3 ration vs. [SDS] and [NaC] in
PEI-free solution and in the presence of 0.2% m/v PEI
are shown in Figures 4A and 4B, respectively. The I1/I3
ratio in the presence of small amounts of SDS or NaC is around 1.80-1.85, what is consistent with the water
polarity.5 The cmc values were determined in
polymer-free solution at the surfactant concentration where the upper plateau ends. According to this methodology, the
cmc values for SDS and NaC were determined as 7.0
and 10.0 mmol L−1, respectively. These cmc values are in agreement with the ones found in the literature and were measured through surface tension (6.0 mmol L−1 for SDS and 10 mmol L−1 for NaC)29 and electrical conductivity (7.8 mmol L−1 for SDS).30 The presence of PEI in the SDS solution shifts the proile considerably and the upper plateau ends at a remarkably lower SDS concentration
(Figure 4A). The SDS-PEI solution shows a clear cac at
0.07 mmol L−1. Likewise, the addition of PEI to the NaC solution (Figure 4B) led to a shift in the cac towards a
lower NaC concentration, however, not as low as that one for the SDS system. The cac in the latter case is at
around 5.0 mmol L−1. Hence, the presence of a cac in both systems can be used as a ingerprint of the formation of SDS-PEI and NaC-PEI supramolecular complexes developed through a cooperative process.
The determination of a cac in the polymer-surfactant
mixture presupposes the existence of a driving force similar to that of normal surfactant micellization with strongly cooperative binding. The cac value is dependent
on the strength of the polymer-surfactant interaction and can be quantitatively evaluated by using the phase separation model of micelle formation: the free energy for the equilibrium of free micelles and micelle-polymer aggregates represents the polymer-surfactant interaction and is given by equation 2.52
(2)
The pH value, speciic conductivity and luorescence measurements suggest that the bile salt NaC binds to PEI chains less intensely than SDS, since the cac is around two
orders of magnitude smaller than cmc in the latter case,
whereas the cac is only around half the cmc for NaC-PEI.
Therefore, the cac/cmc ratio is smaller in the SDS system
and consequently ∆Go is more negative. In order to promote
the association of the biosurfactant NaC to PEI at lower surfactant concentrations, known amounts of SDS were added into the mixture. The results are shown in Table 1.
The addition of a small amount of SDS to the NaC-PEI system was sufficient to stabilize the PEI-SDS-NaC
supramolecular complexes. At χNaC = 0.9, the cac
determined was 0.8 mmol L−1, which is well below the cmc (8.0 mmol L−1) in the polymer-free solution, as can be seen in Figure 4C and Table 1. Furthermore, a gradually decrease in the cac/cmc parameter can be noted by reducing χNaC.
It can also be seen that, the interaction between mixed micelles and PEI is relatively weak (∆Go is less negative)
for χNaC > 0.75 since the micelles are NaC-rich. The strength of the interaction increases in the intermediate region (0.25 ≤χNaC≤ 0.75), as noted by the reduction in
cac, andthere is the clear formation of a plateau in the
∆Go vs. χ
NaC proile (Figure 5). Finally, the interaction
Figure 4. I1/I3vs. surfactant concentration in polymer-free () or 0.2%
m/v PEI () solution (A - SDS, B - NaC and C - χNaC = 0.90).
Table 1. Micellization parameters obtained from the SDS-NaC-PEI
mixtures
χNaC [cmc] /
(mmol L−1)
[cac] / (mmol L−1)
cac/cmc ∆Go /
(kJ mol−1)
0.00 7.0 0.07 0.010 −11.42
0.10 6.5 0.10 0.015 −10.35
0.25 6.1 0.15 0.025 −9.19
0.50 6.4 0.20 0.031 −8.59
0.75 7.9 0.25 0.032 −8.56
0.90 8.0 0.80 0.100 −5.71
1.00 10.0 5.00 0.500 −1.72
Figure 5.∆Govs. χ
process at χNaC < 0.25 occurs strongly since the mixed micelles are SDS-rich.
Small angle X-ray scattering measurements
The SAXS measurements were acquired in the region between (5-20 mmol L-1) cac and psp and at 0.25 < χNaC < 0.75, hence, in the range where only surfactant-PEI complexes and nonexistence of free micellar aggregates were detected by previous pH value, conductivimetry and luorescence measurements.
The SAXS scattering intensity (I(q)), of an isotropic
solution of monodisperse particles embedded in a matrix with a constant scattering length density is given by:
I(q) = NP(q) S(q) (3)
wherein N is in the number of particles per unit volume, P(q) is the form factor of an individual particle and S(q) is
related to the interference particle factor which arises from long-range correlations between scattering centers. The
P(q) form factor of the scattering objects is linked to their
size and shape. In this study, the micellar aggregates were geometrically modeled as ellipsoidal core-shell objects with different scattering length densities of the apolar and polar regions. The description of the size and shape of SDS micelles by using an ellipsoidal core-shell model is straightforward53,54 and it is schematically represented in Figure 6.
The aggregates were assumed to be formed of a hydrophobic ellipsoidal region with principal axes a and b
(a > b), which contains the surfactants hydrophobic tail. In
the hydrophilic shell of thickness d, there is the surfactant
polar headgroup, the irst methylene units,55 the hydration of water molecules, a fraction of counterions and possibly a fraction of the neutralized PEI chain bounded to the polar region.56 The scattering length density of the solvent water
(ρwater) was a ixed parameter (ρwater = 9.42 × 10⁻⁶ Å−2). Besides a, b and d, the scattering length density of the polar
shell (ρshell) and of the hydrophobic core (ρcore) were itting parameters of P(q).
The S(q) structure factor was taken into account by
using the mean spherical approximation (MSA) developed by Hayter and Penfold.44 It describes the structure factor of charged objects in a dielectric medium and combined with P(q) allows the inclusion of interparticle interference
effects due to screened Coulomb repulsion between charged particles. The salt concentration used to compute the ionic strength of the solution, which in turn is used to compute the Debye screening length, was ixed as the molar concentration of surfactant monomers. The effective particle charge (Z) was a free parameter of S(q).
The SAXS measurements were employed in order to evaluate morphological evolutions in the supramolecular complexes as the concentration of surfactants and the molar fraction of NaC (χNaC) change. Figure 7 shows representative SAXS patterns measured for χNaC = 0.25, 0.2% m/v PEI and different concentrations of surfactant according to the legend.
Visually, the SAXS profiles across the whole concentration range are similar. There is always a broad shoulder at around qca. 1.5-2.0 nm−1 and a pronounced and sharp scattering peak at the low-q region (qca. 0.36 nm−1). The broad shoulder is related to the intramicellar form factor, whereas the latter feature is a ingerprint of the interference function related to the interaction between scattering centres (charged micelles).53 Qualitatively, it can be seen that the intensity of the form factor bump increases as the surfactant concentration increases. It also moves towards the long-q region. Furthermore, interparticle
Figure 6. Schematic representation of the NaC-SDS-PEI supramolecular
complexes.
Figure 7. SAXS patterns measured for χNaC = 0.25, 0.2% m/v PEI and
interference is always visible and indeed related to the electrostatic repulsion between the negatively charged micelles. It should be noted that although I(q) is given in
arbitrary units (a.u.), the SAXS proiles were normalized by the transmitted X-ray intensity integrated over time and thus they can be quantitatively compared. One may notice that when the surfactant concentration increases, the intensity of the sharp low-q range peak increases. It
means that the repulsion forces between close charged objects are enhanced due to the higher effective charge of the micelles (higher concentration of negatively charged entities forming the micellar aggregates). On the other hand, the peak position is not strongly affected by the surfactant concentration and remains very close to qca. 0.36 nm−1.
The solid black lines in Figure 7 are the itting results by using P(q) and S(q) modelled as detailed above. The itting
approach describes the experimental results reasonably well. The extracted parameters for this set of measurements are summarized in Table 2.
For the particular molar fraction of NaC (χNaC = 0.25), the core and shell scattering length densities (ρcore and ρshell) remained essentially the same, ρshell being even higher than ρwater, as previously demonstrated for other SDS complexes.53,54 The a/b ratio gives a qualitative evaluation of the micellar shape and it can be noted that the micellar core has a considerably ellipsoidal characteristic since a/bca. 2.5.
As a matter of comparison, the ellipsoidal characteristic of CTAC micelles interacting with TPPS4 was found to be even more pronounced with an a/b (axial ratio) ca. 3.0.57 Regarding the hydrophobic region, the predicted length of a dodecyl chain is ca. 1.67 nm.58 However, it is hard to evaluate the structural packing of the micellar hydrophobic core since it deals with SDS/NaC mixed micelles. Nevertheless, they are ellipsoids with the smallest semi-axis (ca. 1.0 nm) and the
longest semi-axis (ca. 2.5 nm). Therefore, the dimensions are
reasonable to accommodate the hydrophobic section of the polymer-surfactant complexes, albeit the structural packing has to be further evaluated.
In the current study, the a/b ratio remained almost
the same across the whole range of concentration, meaning that the micellar shape is not affect by the surfactant concentration. Consequently, the changes in
P(q) (Figure 7) must be related to changes in the micellar
size. The displacement of the bump towards the long-q
region, when the surfactant concentration increases, gives a qualitative indication that the complexes are smaller at higher concentrations, as seen quantitatively in Table 2. A systematic reduction in the dimension (a + d) is observed
in the range of the investigated concentration.
Since the core scattering length density is higher than the shell scattering length density contrast ((ρcore−ρwater) >(ρshell−ρwater)), the former (ρcore−ρwater) contributes to a greater extent to the form factor region profile. The increase in the surfactant concentration increases the number of aggregation of the mixed micelles (not shown here). Therefore, a greater contribution of (ρcore − ρwater) to the form factor region is expected and consequently a more pronounced bump is observed.
The observed polar thickness (d) can be considered to
be remarkably large. However, this is not surprising since it probably comprises a series of different entities, as previously described. Finally, the effective surface charge of the micelles (Z) is also inluenced by the surfactant concentration. As the
number of aggregation of the mixed micelles increases, a higher number of negatively charged surfactant headgroups composes the polar region of the complexes. Thus, it is straightforward to conclude that the repulsion between the aggregates will be enhanced, as experimentally evidenced in the intensity of the interference peak, by the increase in the effective surface charge of the aggregates.
Figure 8 shows the representative SAXS patterns
obtained for [surfactant] = 15 mmol L−1, 0.2% m/v PEI
and different χNaC values. The solid black lines correspond to the best its obtained using the above-detailed model. The extracted itting parameters are summarized in Table 3.
The bump in the SAXS proiles is only visible when
χNaC < 0.75. The shape of the supramolecular complexes (a/b) and the effective surface charge (Z) are unaffected by
χNaC. The micellar size is slightly dependent on χNaC. The micellar growth from χNaC = 0.75 to χNaC = 0.25 is of only 0.17 nm (a + d). Qualitatively, a slight (almost negligible)
displacement of the form factor bump towards the low-q
region is seen in Figure 8. However, its intensity is strongly inluenced by χNaC.
Table 2. Micellar parameters directly obtained from SAXS ittings for χNaC = 0.25, 0.2% m/v PEI and different concentrations of surfactant
[surfactant] / (mmol L−1)
a / nm b / nm d / nm (a + d) / nm a/b ρcore / 10−6 Å−2 ρshell / 10−6 Å−2 Z
5.0 2.69 1.11 1.63 4.32 2.4 7.77 9.66 17.4
10.0 2.66 1.05 1.65 4.31 2.5 7.73 9.68 17.7
12.5 2.58 1.04 1.51 4.09 2.5 7.82 9.67 18.4
15.0 2.51 1.02 1.40 3.91 2.4 7.70 9.69 18.8
Considering that the irst methylene units of the surfactant chains makes part of the polar region, the hydrophobic core of the micellar aggregates comprises the C11H23 fragment of the linear SDS chains and the C22H37O3 fragment of NaC. Since the scattering length density is proportional to Σnizi
(which is the number of electrons of each apolar segment), C22H37O3 has approximately two times more electrons than the apolar region of SDS, C11H23 (89 e− for SDS and 193 e− for NaC). Therefore, it is clear that when χNaC increases, ρcore increases (Table 3) and approaches ρwater (9.42 × 10⁻⁶ Å−2). Thus, the scattering length density contrast of the core (ρcore− ρwater), which is the main contributor to the P(q) signal, is reduced making dificult (if not impossible) to observe the micellar form factor. This happens due to an inadequate particle-solvent contrast. The reduction in the number of aggregation as χNaC increases (not shown here) also contributes to the reduction in the bump region signal.
To summarize, the aggregate size and shape are only slightly dependent on χNaC, although great differences in the SAXS proiles are observed. Besides, the sharp interference peak in the low-q region does not show any systematic
trend as a function of χNaC, remaining basically in the same position and with approximately the same intensity.
Conclusions
The association of the bile salt sodium cholate (NaC), sodium dodecyl sulfate (SDS) and mixtures of these two
surfactants with the polyelectrolyte poly(ethyleneimine) (PEI) was investigated in detail by means of pH value, electrical conductivity, steady-state luorescence and SAXS measurements. The luorescence, pH and conductivity results suggested that the polyelectrolyte-surfactant association takes place through two steps: (i) the NaC
and SDS entities bind speciically to sites of the PEI chains via electrostatic interaction and (ii) a self-assembly
through regular cooperative association and hydrophobic interactions occurs. The NaC-PEI interaction is weaker; however, it can be enhanced by adding SDS to the NaC-PEI system leading to the formation of mixed NaC-SDS micelles which more strongly interact with the polyelectrolyte PEI, as evidenced by the luorescence measurements and also determination of ∆Go as a function of χ
NaC. The SAXS results suggested an ellipsoidal characteristic and micelles aggregates independently of the surfactant concentration or χNaC. The supramolecular entities are smaller at higher surfactant concentrations and their size and shape are only slightly dependent on χNaC. The SAXS itting procedures also evidenced changes in the scattering length density contrast of the hydrophobic core as a function of χNaC which also supports the formation of NaC-SDS mixed micelles.
Acknowledgements
We acknowledge the Brazilian Synchrotron Light Laboratory (LNLS, Campinas-SP, Brazil) for the beamline use and Conselho Nacional de Desenvolvimento Cientíico e Tecnológico (CNPq) for the inancial support and PhD fellowships. F. C. G. acknowledges Fundação de Amparo à Pesquisa do Estado de São Paulo (FAPESP) (grant No. 2010/06348-0).
References
1. Small, D. M.; Penkett, S. A.; Chapman, D.; Biochim. Biophys. Acta1969, 176, 178.
2. Barry, B. W.; Gray, G. M. T.; J. Colloid Interface Sci. 1975, 52, 314.
3. Oakenfull, D. G.; Fisher, L. R.; J. Phys. Chem.1977, 81, 1838. 4. Fisher, L. R.; Oakenfull, D. G.; J. Phys. Chem.1980, 84, 936. 5. Zana, R.; Guveli, D.; J. Phys. Chem.1985, 89, 1687. 6. Kratohvil, J. P.; Hsu, W. P.; Kwok, D. I.; Langmuir 1986, 2,
256.
Figure 8. SAXS patterns measured for [surfactant] = 15 mmol L−1,
0.2% m/v PEI and different χNaC according to the legend.
Table 3. Micellar parameters directly obtained from SAXS ittings for [surfactant] = 15 mmol L−1, 0.2% m/v PEI and different χ NaC
χNaC a / nm b / nm d / nm (a + d) / nm a/b ρcore / 10−6 Å−2 ρshell / 10−6 Å−2 Z
0.75 2.39 1.09 1.35 3.74 2.2 8.58 9.67 19.0
0.50 2.42 1.02 1.38 3.80 2.4 8.04 9.72 18.7
7. Small, D. M.; Adv. Chem. Series 1968, 84, 31.
8. Coello, A.; Meijide, F.; Nunez, E. R.; Tato, J. V.; J. Phys. Chem.
1993, 97, 10186.
9. Ju, C.; Bohne, C.; J. Phys. Chem.1996, 100, 3847.
10. Waissbluth, O. L.; Morales, M. C.; Bohne, C.; Photochem. Photobiol. 2006, 82, 1030.
11. Partay, L. B.; Jedlovszky, P.; Sega, M.; J. Phys. Chem. B 2007, 111, 9886.
12. Partay, L. B.; Sega, M.; Jedlovszky, P.; Langmuir 2007, 23, 12322.
13. Warren, D. B.; Chalmers, D. K.; Hutchison, K.; Dang, W. B.; Pouton, C. W.; Colloids Surf., A 2006, 280, 182.
14. Meszaros, R.; Varga, I.; Gilanyi, T.; Langmuir2004, 20, 5026. 15. Nam, Y. S.; Kang, H. S.; Park, J. Y.; Park, T. G.; Han, S. H.;
Chang, I. S.; Biomaterials 2003, 24, 2053.
16. Shuai, X. T.; Merdan, T.; Unger, F.; Kissel, T.; Bioconjugate Chem.2005, 16, 322.
17. Goddard, E. D.; J. Colloid Interface Sci. 2002, 256, 228. 18. Zanette, D.; Lima, C. F.; Ruzza, A. A.; Belarmino, A. T. N.;
Santos, S. D.; Frescura, V. L. A.; Marconi, D. M. O.; Froehner, S. J.; Colloids Surf., A 1999, 147, 89.
19. Holmberg, K.; Jonsson, B.; Kronberg, B.; Lindman, B.; Surfactants and Polymers in Aqueous Solution, John Wiley & Sons Ltda: Chichester, 2002.
20. Minatti, E.; Borsali, R.; Putaux, J. L.; Schappacher, M.; Defieux, A.; Viville, P.; Lazzaroni, R.; Narayanan, T.; Langmuir
2003, 19, 6.
21. Minatti, E.; Viville, P.; Borsali, R.; Schappacher, M.; Defieux, A.; Lazzaroni, R.; Macromolecules 2003, 36, 4125.
22. Zanette, D.; Ruzza, A. A.; Froehner, S. J.; Minatti, E.; Colloids Surf., A1996, 108, 91.
23. Minatti, E.; Zanette, D.; Colloids Surf., A 1996, 113, 237. 24. Norwood, D. P.; Minatti, E.; Reed, W. F.; Macromolecules 1998,
31, 2957.
25. Minatti, E.; Norwood, D. P.; Reed, W. F.; Macromolecules 1998, 31, 2966.
26. Dal Bo, A.; Schweitzer, B.; Felippe, A. C.; Zanette, D.; Lindman, B.; Colloids Surf., A 2005, 256, 171.
27. Schweitzer, B.; Felippe, A. C.; Dal Bo, A.; Minatti, E.; Zanette, D.; Lopes, A.; J. Colloid Interface Sci.2006, 298, 457. 28. Schweitzer, B.; Felippe, A. C.; Dal Bo, A.; Minatti, E.; Zanette,
D.; Macromol. Symp. 2005, 229, 208.
29. Zanette, D.; Felippe, A. C.; Schweitzer, B.; Dal Bo, A.; Lopes, A.; Colloids Surf., A 2006, 279, 87.
30. Felippe, A. C.; Schweitzer, B.; Dal Bo, A. G.; Eising, R.; Minatti, E.; Zanette, D.; Colloids Surf., A 2007, 294, 247. 31. Winnik, M. A.; Bystryak, S. M.; Chassenieux, C.; Strashko, V.;
Macdonald, P. M.; Siddiqui, J.; Langmuir2000, 16, 4495. 32. Wang, H.; Wang, Y. L.; Yan, H.; Zhang, J.; Thomas, R. K.;
Langmuir2006, 22, 1526.
33. Winnik, M. A.; Bystryak, S. M.; Siddiqui, J.; Macromolecules
1999, 32, 624.
34. Bystryak, S. M.; Winnik, M. A.; Siddiqui, J.; Langmuir 1999, 15, 3748.
35. Meszaros, R.; Thompson, L.; Bos, M.; Varga, I.; Gilanyi, T.; Langmuir 2003, 19, 609.
36. Bastardo, L. A.; Garamus, V. M.; Bergström, M.; Claesson, P. M.; J. Phys. Chem. B 2004, 109, 167.
37. Turro, N. J.; Yekta, A.; J. Am. Chem. Soc. 1978, 100, 5951. 38. Turro, N. J.; Baretz, B. H.; Kuo, P. L.; Macromolecules1984,
17, 1321.
39. Zana, R.; Yiv, S.; Strazielle, C.; Lianos, P.; J. Colloid Interface Sci. 1981, 80, 208.
40. Zana, R.; Mixed Surfactant Solutions, Marcel Dekker: New York, 1993, chapter 12.
41. Winnik, F. M.; Regismond, S. T. A.; Colloids Surf., A 1996, 118, 1. 42. Cavalcanti, L. P.; Torriani, I. L.; Plivelic, T. S.; Oliveira, C. L.
P.; Kellermann, G.; Neuenschwander, R.; Rev. Sci. Instrum.
2004, 75, 4541.
43. Hammersley, A. P.; Scientific Software FIT2D, ESRF Synchrotron, France, 2009.
44. Hayter, J. B.; Penfold, J.; Mol. Phys. 1981, 42, 109.
45. Kohlbrecher, J.; Software Package SASit for Fitting Small-Angle Scattering Curves, Paul Scherrer Institute, Switzerland, 2010. 46. Jones, M. N.; J. Colloid Interface Sci. 1967, 23, 36.
47. Schwuger, M. J.; J. Colloid Interface Sci. 1973, 43, 491. 48. Benrraou, M.; Bales, B.; Zana, R.; J. Colloid Interface Sci.
2003, 267, 519.
49. Ghoreishi, S. M.; Li, Y.; Bloor, D. M.; Warr, J.; Wyn-Jones, E.; Langmuir 1999, 15, 4380.
50. Zanette, D.; Ruzza, A. A.; Belarmino, A. T. N.; Santos, S.; Lima, C. F.; Froehner, S. J.; Frescura, V. L. A.; J. Am. Chem. Soc. 1997, 213, 265.
51. Zanette, D.; Frescura, V. L. A.; J. Colloid Interface Sci. 1999,
213, 379.
52. Lindman, B.; Wennerström, H.; Top. Curr. Chem. 1980, 87, 1. 53. Caetano, W.; Gelamo, E. L.; Tabak, M.; Itri, R.; J. Colloid
Interface Sci. 2002, 248, 149.
54. Romani, A. P.; Gehlen, M. H.; Itri, R.; Langmuir2005, 21, 127. 55. Zemb, T.; Charpin, P.; J. Phys. France1985, 46, 249. 56. Colafemmina, G.; Fiorentino, D.; Ceglie, A.; Carretti, E.;
Fratini, E.; Dei, L.; Baglioni, P.; Palazzo, G.; J. Phys. Chem. B
2007, 111, 7184.
57. Santiago, P. S.; Neto, D. D. S.; Barbosa, L. R. S.; Itri, R.; Tabak, M.; J. Colloid Interface Sci.2007, 316, 730.
58. Tanford, C.; J. Phys. Chem.1972, 76, 3020.
Submitted: November 29, 2010
Published online: May 10, 2011
![Table 1. Micellization parameters obtained from the SDS-NaC-PEI mixtures χ NaC [cmc] / (mmol L −1 ) [cac] / (mmol L −1 ) cac/cmc ∆G o / (kJ mol −1 ) 0.00 7.0 0.07 0.010 −11.42 0.10 6.5 0.10 0.015 −10.35 0.25 6.1 0.15 0.025 −9.19 0.50 6.4 0.20 0.0](https://thumb-eu.123doks.com/thumbv2/123dok_br/18995270.461999/6.892.453.800.310.496/table-micellization-parameters-obtained-sds-nac-pei-mixtures.webp)

![Figure 8 shows the representative SAXS patterns obtained for [surfactant] = 15 mmol L −1 , 0.2% m/v PEI and different χ NaC values](https://thumb-eu.123doks.com/thumbv2/123dok_br/18995270.461999/8.892.67.799.138.264/figure-shows-representative-patterns-obtained-surfactant-different-values.webp)
![Figure 8. SAXS patterns measured for [surfactant] = 15 mmol L −1 , 0.2% m/v PEI and different χ NaC according to the legend.](https://thumb-eu.123doks.com/thumbv2/123dok_br/18995270.461999/9.892.94.446.141.502/figure-saxs-patterns-measured-surfactant-different-according-legend.webp)
