Article
J. Braz. Chem. Soc., Vol. 29, No. 1, 45-57, 2018. Printed in Brazil - ©2018 Sociedade Brasileira de Química*e-mail: [email protected]
Effect of Acetonitrile and
N
,
N
-Dimethylformamide on the Formation of
Poly(ethylene oxide)-Sodium Alkyl Sulfate Aggregates
Guilherme M. D. Ferreira,a,b Gabriel M. D. Ferreira,a Maria C. Hespanhol,a Álvaro J. P. Agudelo,a Jaqueline P. Rezende,c Ana C. S. Piresc and Luis H. M. Silva*,a
aGrupo de Química Verde Coloidal e Macromolecular, Departamento de Química,
Centro de Ciências Exatas e Tecnológicas, Universidade Federal de Viçosa (UFV), Av. P. H. Rolfs s/n, 36570-900 Viçosa-MG, Brazil
bDepartamento de Química, Universidade Federal de Lavras (UFLA), Campus Universitário,
CP 3037, 37200-000 Lavras-MG, Brazil
cDepartamento de Tecnologia de Alimentos, Universidade Federal de Viçosa,
Av. P. H. Rolfs s/n, 36570-900 Viçosa-MG, Brazil
The effects of low contents of acetonitrile (AN) or N,N-dimethylformamide (DMF) on the aggregation of sodium alkyl sulfate surfactants, in the absence and presence of poly(ethylene oxide) (PEO), were investigated using conductivity and isothermal titration calorimetry. The cosolvents slightly changed the critical micellar concentrations and did not alter the critical aggregation concentrations of the surfactants sodium decyl sulfate (DSS) and sodium dodecyl sulfate (SDS) with PEO. However, AN and DMF turned the micellization of the surfactants and their binding to the polymer enthalpically more favorable. For instance, for SDS, the micellization enthalpy, , decreased from close to 0 kJ mol–1 in water to −14.3 kJ mol–1 in the presence of 2.50 mol% AN,
and the integral enthalpy change for aggregate formation with the polymer, ∆Hagg(int), decreased
from −1.1 kJ mol–1 in water to −15.5 kJ mol–1 in the same AN concentration. This was attributed to
the modification of the solvation shells of both SDS and PEO by the cosolvent molecules, which reduced the entropic contribution to formation of the aggregates. Consequently, when SDS was replaced with DSS, the AN affected to a lesser extent, with a decrease of 9.1 kJ mol–1, while
the ∆Hagg(int) values were not altered, highlighting the influence of hydrophobic interactions in
the surfactant aggregation process.
Keywords: poly(ethylene oxide), sodium alkyl sulfates, acetonitrile, N,N-dimethylformamide, isothermal titration calorimetry
Introduction
Properties of systems containing mixed surfactants and polymers are of great interest from both practical and theoretical perspectives, due to their various applications in separation,1,2 dispersion,3 and solubilization processes.4-6
The properties of such systems can be improved by adding modifiers such as cosolvents,7,8 cosurfactants,9
electrolytes,10,11 and ionic liquids.12,13 Although studies
of the effect of modifiers on polymer-surfactant systems have contributed to the understanding of the mechanisms involved in their aggregation, there is still insufficient information concerning the role of the solvent molecules in
this phenomenon. Therefore, it is of interest to investigate the effect on polymer-surfactant interactions of the presence of cosolvents with high cohesive energy and high dielectric constant, which form hydrogen bonds with water, hence increasing its tertiary structure. Acetonitrile (AN) and N,N-dimethylformamide (DMF) possess these properties and can be used as model cosolvents in aqueous systems containing polymers and surfactants.
Extensive studies of water/AN mixtures have shown that the molecular microstructure in these solutions depends on the molar fraction of the cosolvent. Bertie and Lan14 used infrared measurements to demonstrate
measurements and molecular dynamics simulations to show that the water structure was enhanced. At AN mole fractions from 0.3 to 0.5 (depending on the method employed), disruption of the water structure occurs and water/AN mixtures exhibit microheterogeneity, with strong preferential solvation of water by water and AN by AN. When the AN mole fraction is increased to 0.9, water-AN complexes surrounded by acetonitrile are formed. In the same way, studies of water/DMF mixtures have demonstrated that the water structure is dependent on the DMF concentration. For instance, Lei et al.16 used molecular dynamics simulations to show that DMF enhanced the water structure in dilute solutions, while at higher DMF concentrations there was breakdown of the water tertiary structure. Therefore, AN and DMF can change the solvophilic/solvophobic balance involved in the process of aggregation between polymer and surfactant.
Among a variety of polymeric structures, poly(ethylene oxide) (PEO) has received great attention for the formation of complexes with surfactants, especially sodium dodecyl sulfate (SDS).17-21 A delicate balance of interactions
governs the process of SDS aggregation with PEO, which occurs in different stages.22 At the critical aggregation
concentration (cac), which is lower than the critical micellar concentration (cmc) of the surfactant, SDS aggregates consisting of a small number of SDS monomers are formed on the polymer chain. Then, as the SDS concentration increases, the size of the SDS aggregates increases, with transfer of PEO segments to the aggregate surface. Finally, after saturation of the PEO chain, free SDS micelles are formed in the bulk matrix. All these stages can be affected by the presence of cosolvents that can modify the relative stability between the surfactant micelles and the PEO-surfactant aggregates. For example, Ferreira et al.13 demonstrated that
concentrations of 1-butyl-3-methylimidazolium halides below 10 mmol L−1 resulted in the SDS micelles being more
stable than the PEO-SDS aggregates.
To the best of our knowledge, there has been only one report investigating the effect of polar organic cosolvents on the PEO-SDS interaction. Dai and Tam19 evaluated
the effect of different glycols on the SDS aggregation process in the presence of PEO and showed that with small amounts of the cosolvent (0-8.0 mol%), the cac increased. However, the PEO-SDS aggregates were more stable than SDS micelles in the bulk matrix. The higher stability of PEO-SDS aggregates compared with SDS micelles was mainly attributed to the hydrophobic interactions between the surfactant and the polymer. The presence of glycol reduced the solubility of PEO, minimizing both the dehydration and rehydration processes of the PEO chain and increasing the cac.
Among several techniques used to investigate the aggregation of surfactants in PEO aqueous solutions, isothermal titration calorimetry (ITC) provides a powerful tool.10,13,22-24 Here, we used ITC to evaluate the effect of
AN and DMF as cosolvents on the aggregation between sodium dodecyl sulfate (SDS) or sodium decyl sulfate (DSS) and the poly(ethylene oxide) polymer. Conductivity and ITC measurements were also performed to obtain thermodynamic parameters associated with the surfactant aggregation processes in the absence of polymer, namely cmc, degree of micelle ionization, micellization enthalpy, micellization entropy, and micellization Gibbs energy.
Experimental
Materials
Poly(ethylene oxide) with an average molar mass of 35000 g mol–1 (designated as PEO 35000), sodium
dodecyl sulfate (98.5%), and sodium decyl sulfate (98.0%) were purchased from Fluka. Acetonitrile and N,N-dimethylformamide were obtained from Aldrich. All the chemicals were used without further purification. Deionized water was used to prepare all the solutions.
Isothermal titration calorimetry
Calorimetric experiments were performed using a CSC-4200 microcalorimeter (Calorimeter Science Corp.) fitted with 1.75 mL reaction cells (sample and reference). The titrations were carried out by means of step-by-step injections (5 µL) of a concentrated surfactant solution (341.5 mmol L-1 SDS or 330.0 mmol L-1 DSS) into
surfactant, which was plotted against the total surfactant concentration in the calorimetric cell.
Conductivity measurements
Electrical conductivity was measured at 298.2 ± 0.1 K using a digital conductivity meter (DM-32, Digimed, Brazil) equipped with a conductivity cell (DMC-010M) with platinized platinum electrodes. Prior to the measurements, the cell was calibrated using an aqueous KCl standard solution (DM-S6A, Digimed). A concentrated solution of SDS was added to a water-jacketed cell containing 12.0 mL of the solvent (0.0, 0.20, 0.80, 1.00, or 2.50 mol% AN) in step-by-step injections (5 µL) performed with a Hamilton microsyringe (250 µL). After each addition of the surfactant titrant solution, the conductance was measured while mixing.
Results and Discussion
Effects of the cosolvents on SDS and DSS micellization
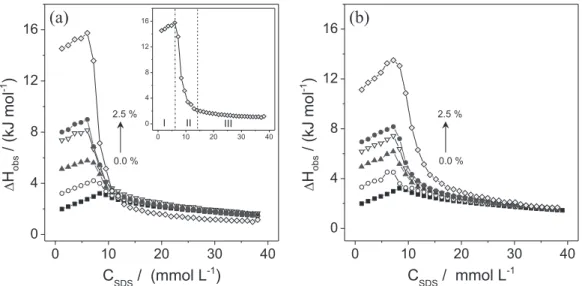
Low contents of polar organic cosolvents such as acetonitrile and N,N-dimethylformamide can effectively modulate the solvent quality of water, altering the SDS and DSS surfactant aggregation properties in the presence of PEO. However, in order to understand the effects of the cosolvents in this process, it is necessary to elucidate the ways that AN and DMF modify the delicate balance of intermolecular forces involved in the micellization of the surfactants. Figure 1 shows the calorimetric curves obtained from the titration of 341.5 mmol L–1 SDS into the
calorimetric cell containing the solvent comprising AN/
water or DMF/water mixtures with different molar ratios of the cosolvent, at 298.2 K. Each curve is a plot of the observed molar enthalpy change, ∆Hobs, versus the final
surfactant concentration (CSDS).
In the absence of the cosolvents, the ∆Hobsversus CSDS
curve presented a maximum ∆Hobs value at around
8.3 mmol L–1, considered to be the cmc of this surfactant.
The profile observed in this curve was distinct from the sigmoidal shape usually observed in the calorimetric curves of dilution of common surfactants.25,26 This profile
for SDS at 298.2 K has been attributed to the very small micellization enthalpy change of SDS at this temperature. Calorimetric curves of SDS dilution in pure water have been extensively studied in the literature, showing a strong dependence on temperature.27
The addition of AN or DMF made three regions evident in the ∆Hobsversus CSDS curves (these regions are
highlighted in the inset in Figure 1a). In the first region, corresponding to the first few injections in the sample cell giving final surfactant concentration below the cmc, the
∆Hobs values increased slightly as CSDS increased (Figure 1a,
inset, region I). These values were associated with dilution/ demicellization of the SDS micelles and subsequent dilution of SDS monomers in the sample cell. In the second region (Figure 1a, inset, region II), the ∆Hobs values suddenly
decreased when the SDS concentration in the sample cell increased. In this range of concentration, only part of the added SDS micelles broke up into monomers, while part remained as micelles. The cmc value can be considered as the concentration at which the start of micelle formation is detected from the calorimetric curve (the concentration in the beginning of region II). However, as recommended by Olofsson and Loh,27 the cmc was chosen as the inflexion
point in the surfactant dilution calorimetric curve. Finally, at higher final surfactant concentrations, where the ∆Hobs
values decreased slightly (Figure 1a, inset, region III) when CSDS increased, the added micelles were only diluted in the
calorimetric cell.
The differences between the aggregation behavior of SDS in pure water and in the cosolvent/water mixtures can be understood quantitatively from the thermodynamic parameters of micellization. The micellization enthalpy change, , was taken as the difference in the observed enthalpy changes just below and above the cmc (Figure S1, in the Supplementary Information, shows how was determined). Additionally, the micellization Gibbs free energy change, , can be estimated from the cmc using equation 1:
(1)
in which α is the degree of micelle ionization. The α values were calculated as the ratio of the slopes above
and below the cmc in the conductivity curves (Figure S2 in the Supplementary Information). The value is the standard Gibbs free energy difference between one mole of surfactant as aggregates and one mole of surfactant as monomers in the solvent. This thermodynamic parameter allows a comparison between the stability of the surfactant aggregates formed in the cosolvent/water mixtures and the stability of the micelles in pure water. Finally, the value can be obtained using the classical thermodynamic
relationship , giving the complete
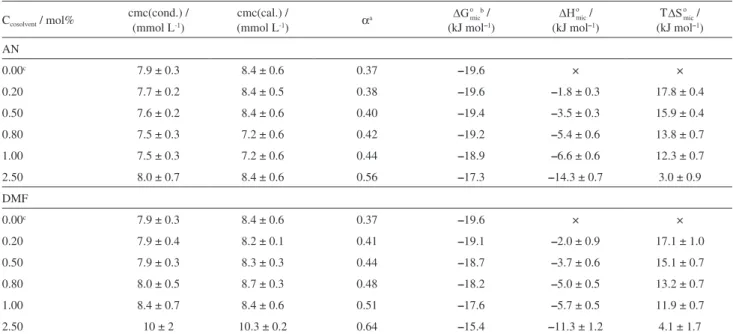
thermodynamic characterization of the SDS micellization process. Table 1 shows the cmc, α, and thermodynamic
parameters of SDS micellization ( , , and ) obtained from the conductivity and/or calorimetric data acquired in the presence of the cosolvents at different concentrations.
The cmc values obtained by calorimetry and conductivity agreed with each other, and they changed slightly as the cosolvent concentration increased. For AN, the cmc values initially decreased as the cosolvent concentration increased up to 0.80 mol%. Then, further addition of cosolvent made the cmc values increase, being this effect more pronounced in the presence of DMF. In addition, increase of the AN (or DMF) concentration caused an increase in the α value,
indicating that the cosolvent acted to decrease the mole fraction of the Na+ counterions of the SDS that screen the
headgroup electrostatic repulsion on the electric double shell of the micelle.
The release of Na+ ions from the micelle electric double
layer to the bulk phase is determined by the electrostatic interactions at the micellar surface that depend on the bulk phase permittivity (ε). Whereas dielectric constants
for water, AN, and DMF are 78.5,28 35.95,29 and 36.71,30
respectively, an increase in the cosolvent content decreases the magnitude of ε, increasing the repulsive electrostatic
interaction among the SDS headgroups on the micelle surface. For this reason, the micellar volume increases, reducing the charge density on the micelle surface that
Table 1. Thermodynamic parameters of SDS micellization in cosolvent/water mixtures, at 298.2 K
Ccosolvent / mol%
cmc(cond.) / (mmol L-1)
cmc(cal.) /
(mmol L-1) αa
b / (kJ mol–1)
/ (kJ mol–1)
T /
(kJ mol–1)
AN
0.00c 7.9 ± 0.3 8.4 ± 0.6 0.37 –19.6 × ×
0.20 7.7 ± 0.2 8.4 ± 0.5 0.38 –19.6 –1.8 ± 0.3 17.8 ± 0.4
0.50 7.6 ± 0.2 8.4 ± 0.6 0.40 –19.4 –3.5 ± 0.3 15.9 ± 0.4
0.80 7.5 ± 0.3 7.2 ± 0.6 0.42 –19.2 –5.4 ± 0.6 13.8 ± 0.7
1.00 7.5 ± 0.3 7.2 ± 0.6 0.44 –18.9 –6.6 ± 0.6 12.3 ± 0.7
2.50 8.0 ± 0.7 8.4 ± 0.6 0.56 –17.3 –14.3 ± 0.7 3.0 ± 0.9
DMF
0.00c 7.9 ± 0.3 8.4 ± 0.6 0.37 –19.6 × ×
0.20 7.9 ± 0.4 8.2 ± 0.1 0.41 –19.1 –2.0 ± 0.9 17.1 ± 1.0
0.50 7.9 ± 0.3 8.3 ± 0.3 0.44 –18.7 –3.7 ± 0.6 15.1 ± 0.7
0.80 8.0 ± 0.5 8.7 ± 0.3 0.48 –18.2 –5.0 ± 0.5 13.2 ± 0.7
1.00 8.4 ± 0.7 8.4 ± 0.6 0.51 –17.6 –5.7 ± 0.5 11.9 ± 0.7
2.50 10 ± 2 10.3 ± 0.2 0.64 –15.4 –11.3 ± 1.2 4.1 ± 1.7
promotes the release of Na+ ions.31 Besides, addition of
the cosolvents decreases the solvent polarity, increasing the solubility of the surfactant monomers for decreasing the hydrophobic effect. This can explain the cmc increase at cosolvent concentrations above 0.80 mol%.
Increases in the α values for SDS micellization have
been also reported for mixtures of water with other organic solvents, namely formamide, N-methyl acetamide, and N-methyl propionamide. Such increases have been accompanied by large increases in the cmc values.32
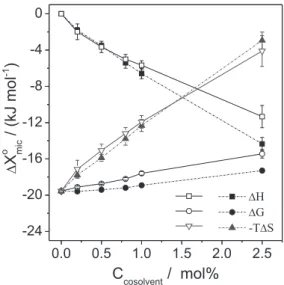
The micellization thermodynamic parameters ( , , and ) for SDS were strongly dependent on the presence of the cosolvents (Table 1). Figure 2 shows the effect of the cosolvent concentration on these thermodynamic parameters.
Interestingly, the effects of both cosolvents on the thermodynamic parameters of SDS micellization were quite similar, suggesting that AN and DMF act on the SDS aggregation process in a similar way, in the cosolvent concentration range evaluated. Although the values were negative for all thermodynamic conditions, their magnitude became less negative as the cosolvent concentration increased, showing that the cosolvents turned the SDS micellization less favorable. Despite this, in the equilibrium state, the cosolvent did not hinder SDS micellization, as can be seen in Table 1 where, for some cosolvent concentrations, the cmc decreased compared with the cmc in pure water. The decrease in the stability of the SDS micelles was due to the change in the enthalpic/ entropic balance promoted by the AN and DMF cosolvents: whereas the SDS micellization changed from almost athermic in pure water to exothermic in the presence of the
cosolvents ( < 0), the process became less entropically favorable as the cosolvent concentration increased.
As discussed above, the decrease in the dielectric constant of the solvent, due to the addition of the organic cosolvents, led to increased electrostatic repulsion among the SDS headgroups at the micelle surface, which was enthalpically unfavorable. Therefore, the exothermic enthalpic contribution to the SDS micellization process in the presence of the cosolvent could be attributed to the SDS chain-solvent and solvent-solvent interaction energies, which were modified by AN and DMF. Hence, the strong effect of the cosolvents on the values, even at low concentrations, highlights that the cosolvents affected the solvation shell of the SDS monomers.
The decrease in the values in the presence of the cosolvents (AN or DMF) was probably associated with the changes in the water structure solvating the SDS hydrophobic chain. This phenomenon reduced the energy required for the desolvation process of the surfactant hydrophobic chain, and/or increased the release of energy associated with formation of the solvent-cosolvent interactions in the bulk solution, compared with micellization in pure water. Regarding the first hypothesis, the decrease in energy required for the desolvation of surfactant hydrophobic chain was associated with the decrease in the water tridimensional structure in the presence of the cosolvents, making the hydrogen bonds among water molecules solvating the hydrophobic chain of SDS less intense. In the case of acetonitrile, the second hypothesis agreed with the findings of Bertie and Lan,33
who reported that at very low mole fractions of AN in water (up to 3.3 mol%), the cosolvent was fully hydrogen bonded by water molecules and the mixing of AN with water was an exothermic process.
Behbehani and Waghorne34 determined the solvation
parameters for the hydrophobic solutes tetrabutylammnium bromide and tetrapentylammnium bromide in water-acetonitrile mixtures, and also suggested that AN participates in the solvation shell of these solutes and that this phenomenon was due to the hydrophobic effect. This hypothesis provides an explanation for the decrease in the entropic contribution for SDS micellization as the molar fraction of AN increased (Figure 2). In pure water, the entropy increase associated with SDS micellization is derived from the release of the water molecules solvating the surfactant chain, which are in a more ordered arrangement around it than in the bulk matrix, overcoming the decrease in the configurational entropy of the system due to the aggregation of the monomers.35
Different from this arrangement, which is produced by a network of hydrogen bonds among the water molecules,
the arrangement of the water and AN molecules solvating the surfactant chain is less ordered. Hence, in AN/water mixtures, the system entropy associated with the water and AN molecules solvating the SDS hydrocarbon chains is higher than the system entropy associated with the water molecules solvating the SDS molecules. Therefore, when the SDS aggregation process takes place, is less positive in the presence of the cosolvent.
In terms of the effects caused by the different cosolvents, the replacement of DMF by AN did not affect the magnitude of , but made more exothermic as the cosolvent concentration increased (Figure 2), showing that AN interacted more favorably with water molecules in the solvation shell of the surfactant chain. In fact, thermodynamic data for the solvation of hydrophobic compounds in mixed solvents (water/AN and water/DMF) show that AN affects the solvation shell of hydrophobic solutes more intensely than DMF.34
The effect of AN and DMF on SDS micellization obtained in our work was similar to the one reported by Dai and Tam19 on the effect of glycols on this process. They
found that, for addition of low contents of glycols (up to 4.7 mol%), the cosolvent “only alters the effect of charged surfactant head groups” by promoting “the shielding of charge interaction, which will have negligible impact on the solvent properties”. However, the authors did not evaluate the effect of the glycols on the ionization degree of the micelle (α), which would give invaluable information about
the SDS micellization process. In the present paper, we have found that addition of AN and DMF increased α values while
the dielectric constant of the bulk was decreased. These factors would be expected to increase the micellization enthalpy change, which did not happen, showing that even in low AN and DMF concentration, changes in
micellization parameters coming from the addition of AN and DMF are mostly due to the change in the energy of the solvation/desolvation processes of the surfactants.
The effect of the surfactant hydrophobic chain length on the micellization process in the presence of AN was evaluated using calorimetric curves of DSS dilution. Figure 3a shows these curves for the titration of 330.0 mmol L-1 DSS into AN/water mixtures.
The removal of two methylene groups of SDS changed the ITC curve for the surfactant dilution in pure water, making the DSS micellization process endothermic ( = 2.3 ± 0.3 kJ mol–1). Interestingly, the addition of AN
also caused a decrease in for the DSS micellization process, which shifted from endothermic to exothermic ( = –6.8 ± 0.8 kJ mol–1 at 2.50 mol% AN), with slight
changes in the cmc value. This finding suggested that the cosolvent acted similarly in the micellization of SDS and DSS, that is, AN decreased the water tridimensional structure surrounding the surfactant hydrophobic chain. In support of this hypothesis, the data showed that the effect of AN on was greater when the surfactant was SDS (the differences between the values in pure water and in 2.50 mol% AN were 14.3 ± 0.7 kJ mol–1 for SDS
and 9.1 ± 1.1 kJ mol–1 for DSS). Similar results were
obtained for DMF/water mixtures (Figure 3b) and the same discussion can be considered.
Effect of cosolvents on the PEO-surfactant interactions
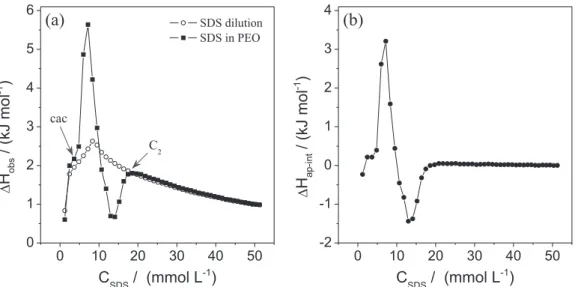
Figure 4a presents the calorimetric titration curves for the addition of SDS to 0.100% (m/v) PEO 35000 aqueous solution, where the observed molar enthalpy change (∆Hobs) for each injection is plotted against the
total SDS concentration. The curve for SDS dilution in
water is shown for comparison. We chose 0.100% (m/v) as the PEO concentration in the experiments because at this concentration the polymer solution is in the dilute regime, where polymer chains interact mainly with solvent molecules.
At low SDS concentrations (the first two injections in the calorimetric experiment), the ∆Hobs values for both
curves (SDS addition to 0.100% (m/v) PEO and SDS dilution in water) were the same, indicating that there was no calorimetrically detectable interaction between PEO and SDS. When the surfactant concentration reached the critical aggregation concentration (cac) at 3.6 ± 0.1 mmol L-1, the ∆Hobs values became more positive in the case of the curve
for SDS addition to PEO solution, compared with the curve for SDS dilution in water, and an abrupt change in the slope of the curve for SDS addition to PEO appeared. This concentration characterizes the beginning of the process of surfactant association on the PEO chain. Then, as the SDS concentration increased above the cac, the difference between the ∆Hobs values for both curves in Figure 4a
depended on the SDS concentration and two distinct regions could be identified. In the first region, the curve for SDS titration in PEO solution displayed an endothermic peak relative to the curve for SDS dilution in water (∆Hobs for
SDS titration in PEO > ∆Hobs for SDS dilution in water). In
the second region, an exothermic peak appeared (∆Hobs for
SDS titration in PEO < ∆Hobs for SDS dilution in water).
The endothermic processes occurring in the presence of PEO were associated with the formation of aggregates of low aggregation number that solubilized the ethylene oxide segments of PEO, promoting the dehydration of both the PEO segments and the SDS monomers. As the CSDS
increased, SDS monomers were added to the aggregates
formed on the PEO chain, moving the PEO segments from the core to the surface of the SDS aggregates and promoting a partial rehydration of the PEO segments (exothermic process).22 At 18 ± 1 mol L-1 SDS, the PEO chain became
saturated with SDS monomers and no additional interaction between the polymer and the surfactant occurred. This critical concentration, defined as the concentration at which the curve for surfactant addition to polymer solution joins the curve for surfactant dilution in water, is known as the saturation concentration, C2. From C2, the added surfactant
micelles will dilute, forming free SDS micelles in the bulk matrix.
Whereas the determination of binding isotherms for polymer-surfactant systems is difficult to access by ITC,27
the number of SDS monomers that interacted with the polymer at each injection in the calorimetric cell remained unknown. Therefore, it was not possible to calculate the exact molar enthalpy change for the PEO-SDS interaction, but only an apparent molar enthalpy change, ∆Hap−int. To
obtain ∆Hap−int for the PEO-SDS interaction, the curve
for SDS dilution in water was subtracted from the curve for SDS titration in the polymer solution, for each SDS concentration. Figure 4b shows the ∆Hap−int versus CSDS
curve for the PEO-SDS interaction in pure water, obtained from the curves in Figure 4a.
Despite the limitation of the ∆Hap−intversus CSDS curve,
its features provide important qualitative information about the progress of the aggregation phenomenon, allowing comparison among the PEO-SDS interaction energies obtained for different solvents. In order to evaluate the effects of AN and DMF on the PEO-SDS interaction, calorimetric experiments involving the addition of SDS to 0.100% (m/v) PEO 35000 were performed using
different AN concentrations, obtaining the corresponding
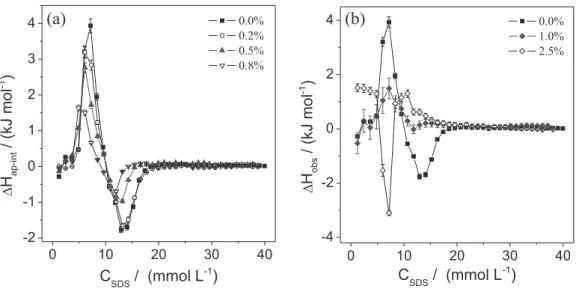
∆Hap−intversus CSDS curves. Figure 5 presents the apparent
molar enthalpy change curves for the PEO-SDS interactions at different AN concentrations.
The profiles of the ∆Hap−intversus CSDS curves for AN
concentrations up to 0.80 mol% (Figure 5a) were similar to that observed in the absence of the cosolvent, with all the curves displaying endothermic and exothermic peaks. However, the areas of both endothermic and exothermic peaks decreased as the amount of AN increased from 0 to 0.80 mol%, suggesting that AN modified the solvation processes associated with the PEO-SDS interaction. For AN concentrations above 0.80 mol% (Figure 5b), the profiles of the calorimetric curves changed. At 1.00 mol% AN, the endothermic peak remained, while the exothermic peak disappeared. At 2.50 mol% AN, only one exothermic peak was detected, at low SDS concentration, indicating changes in the mechanism of interaction in the system.
The decreases in the endothermic and exothermic peaks for AN concentrations ranging from 0.0 to 1.00 mol% showed that this cosolvent modified the energies associated with the processes of desolvation of both SDS monomers and PEO segments and with the re-solvation processes of PEO segments. The changes in the energies were mainly attributed to the effect of the cosolvent on the solvation shell in the hydrophobic regions of the SDS monomers and PEO segments. As discussed for the SDS micellization process, the values became more exothermic in the presence of AN due to the decrease in the water tridimensional structure around the surfactant hydrophobic chain, which reduced the desolvation enthalpic energy of the SDS monomers. In the same way, for the PEO-SDS interaction process, the energy of desolvation of the surfactant in the presence of
the cosolvent was reduced, making the ∆Hap−int values less
positive at the lowest SDS concentrations (endothermic peaks) and contributing to the decrease in the endothermic peak area.
Additionally, the results suggested that the PEO solvation shell was also altered by the presence of AN. Otherwise, the exothermic peak area would increase for the same reason that the endothermic peak area decreased. One of the events determining the ∆Hap−int values associated with the exothermic
peak was the transfer of the PEO segments from the core to the surface of the SDS aggregates, re-solvating the PEO chain, with the re-solvation process probably involving some AN molecules. In this process, the enthalpic energy released was smaller than that released when PEO was re-solvated by water molecules in the absence of the cosolvent, making
∆Hap−int less exothermic in the second peak. The presence of a
single peak of low magnitude at 1.00 mol% AN indicated that the desolvation and re-solvation of both the SDS monomers and the PEO segments that took place during the interaction process mainly involved less structured water molecules around hydrophobic regions.
In the case of the ITC curve obtained in the presence of 2.50 mol% (5.05 wt.%) AN, a similar result was reported by Dai and Tam19 for the interaction between PEO and
SDS in the presence of glycerol at concentrations ranging from 8 wt.% (1.7 mol%) to 15 wt.%. At this glycerol concentrations, only an exothermic peak appeared in the ∆Hap−int versus CSDS curves, which was attributed to
the decrease in the solvent polarity and to disruption of hydrogen bonds between PEO and water. This minimized the desolvation and re-solvation processes, with direct solubilization of PEO into the cores of SDS aggregates by means of the exothermic hydrophobic interaction. It should
also be highlighted that Dai and Tam19 evaluated different
glycols less polar than water, with propylene glycol (with the lowest polarity) presenting the most intense effect on PEO-SDS aggregation. The authors attributed this result to the smaller polarity of this glycol, which increased the SDS solubility and decreased the PEO solubility. However, in this work, we evaluated cosolvents with high dipolar moment, showing that their ability to promote the same effect on SDS-PEO aggregation occurred at a lower concentration (5 wt.%) compared with the concentration of propylene glycol needed to promote the same effect in the Dai and Tam19 study (10 wt.%). The same was true for the
effect of cosolvents on the surfactant micellization process. In addition to analysis of the profiles of the
∆Hap−int versus CSDS curves, estimates of the interaction
thermodynamic parameters at different AN concentrations can also provide important information about the role of AN in the PEO-SDS interaction. These parameters include cac, C2, the decrease in Gibbs free energy change for SDS
aggregation in the presence of PEO, compared with SDS aggregation in the solvent (∆∆Gagg), the integral enthalpy
change for aggregate formation (∆Hagg(int)), and the extent
of binding of SDS to PEO (Ns). Table 2 provides all the
aggregation thermodynamic parameters obtained. The addition of small amounts of AN, up to 1.00 mol%, did not affect the cac values, but decreased C2, indicating
a reduction in the binding capacity of SDS to PEO. This result agreed with the decrease in the extent of binding (Ns), which provide the moles of SDS bound to ethylene
oxide (EO) unities in the PEO chain at C2. Extent of binding
values were calculated according to equation 2:
(2)
where nEO and Vt are the mole number of EO unities and the
total volume in the sample calorimetric cell, respectively. At 2.50 mol% AN, the cac value could not be precisely obtained because the ∆Hap−int values for the first SDS
concentrations (associated with the first injections in
the calorimetric experiment) were very different from zero. This suggested that for the first SDS concentration (1.2 mmol L-1), the PEO-SDS interaction had already
occurred, with a marked decrease in the cac value, which was followed by an increase in C2.
To evaluate the relative stability of the surfactant aggregates formed on the polymer chain, compared with the formation of free surfactant micelles in solution, the ∆∆Gagg
parameter was obtained using the following equation:
(3)
in which R is the universal gas constant and T is the absolute temperature.27 The cac and cmc values used
to calculate the ∆∆Gagg values were obtained from
calorimetric experiments. For PEO-SDS interaction in pure water, ∆∆Gagg = −2.1 ± 0.6 kJ mol–1 indicated
that the SDS aggregates were stabilized by PEO. This stabilization was mainly due to the solubilization of ethylene oxide groups on the micelle surface,36 with a
concomitant decrease in electrostatic repulsion among the SDS headgroups.18 As the AN content increased, the ∆∆Gagg values remained negative and increased slightly,
indicating that the cosolvent decreased the stability of the SDS aggregates formed on the PEO chain, compared to the SDS aggregates formed in AN/water mixtures without polymer, but only to a low degree. Hence, the addition of AN affected the enthalpic/entropic balance associated with the PEO-SDS interaction.
The ∆Hagg(int) parameter was used to elucidate the way
that AN affected the enthalpic contribution to the formation of the PEO-SDS aggregates. This parameter was estimated using equation 4, proposed by Olofsson and Loh:27
(4)
in which it was assumed that C2 had been achieved after Y
injections of ninj moles of surfactant, giving a total volume
Vy. At C2, the concentration of free monomers was equal to
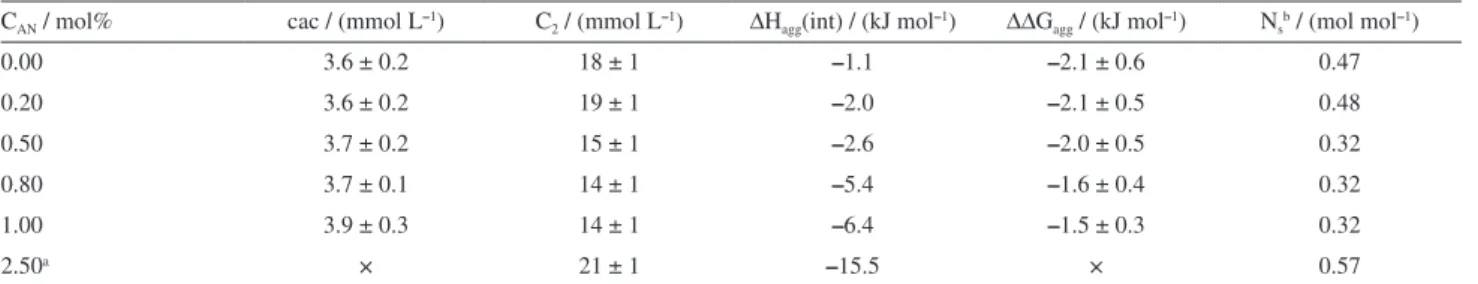
Table 2. Thermodynamic parameters for PEO-SDS interactions at different acetonitrile concentrations
CAN / mol% cac / (mmol L–1) C2 / (mmol L–1) ∆Hagg(int) / (kJ mol–1) ∆∆Gagg / (kJ mol–1) Nsb / (mol mol–1)
0.00 3.6 ± 0.2 18 ± 1 –1.1 –2.1 ± 0.6 0.47
0.20 3.6 ± 0.2 19 ± 1 –2.0 –2.1 ± 0.5 0.48
0.50 3.7 ± 0.2 15 ± 1 –2.6 –2.0 ± 0.5 0.32
0.80 3.7 ± 0.1 14 ± 1 –5.4 –1.6 ± 0.4 0.32
1.00 3.9 ± 0.3 14 ± 1 –6.4 –1.5 ± 0.3 0.32
2.50a × 21 ± 1 –15.5 × 0.57
the cmc of the surfactant in the solvent, and the total amount of surfactant added was Yninj. Out of this total, Vycmc moles
of surfactant did not interact with the polymer; Σqobs is the
energy measured in the interaction process; and Yqdemic+dil is
the energy of demicellization and dilution. The ∆Hagg(int)
value shows the enthalpy change for formation of the aggregates from one mole of surfactant monomers in a concentration range from cac to C2.
In pure water, the ∆Hagg(int) value was only –1.1 kJ mol-1,
due to the similar areas of the endothermic and exothermic peaks in Figure 4b. This compensation effect on the integral enthalpy change for the PEO-SDS interaction originated in the dehydration and rehydration of PEO segments and has been discussed in detail by da Silva et al.37 When AN
was added to the system, the ∆Hagg(int) value became more
negative, which mainly resulted from the lower amount of energy for desolvation of the surfactant monomers and the ethylene oxide segments of PEO, in the presence of the cosolvent. Interestingly, in the AN concentration range from 0.0 to 1.00 mol%, the decrease in the ∆Hagg(int) value was
accompanied by an increase in ∆∆Gagg and a decrease in Ns,
suggesting a reduction in the entropic contribution for the aggregation of SDS on the polymer chain. This indicated that the presence of AN in the system decreased the solvophobic effect by decreasing the water tridimensional structure around hydrophobic part of the SDS monomers and PEO, reducing the entropic gain of the system due the aggregation process.
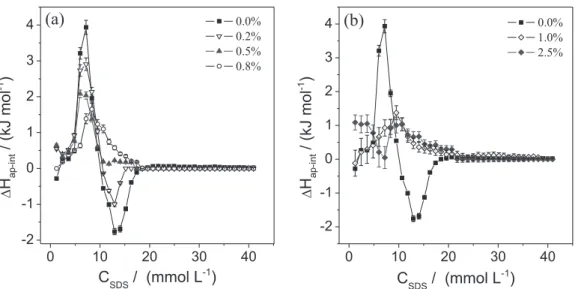
DMF affected the ITC curves for the PEO-SDS interaction in a similar way to that observed for the AN cosolvent (Figure 6). A similar interpretation of the results can be made, although some differences may be highlighted.
The use of DMF changed the profiles of the
∆Hap−int versus CSDS curves to a greater extent than AN,
with the exothermic peak at high SDS concentrations already disappearing at 0.50 mol% of the cosolvent. At 2.50 mol% DMF, the ITC curve presented a similar profile to that observed using the same concentration of AN. However, the ∆Hap−int values obtained were always
positive. A better understanding of the role of DMF in the PEO-SDS interaction can be obtained from analysis of the aggregation thermodynamic parameters determined in the presence of this cosolvent (Table 3).
The addition of DMF to the system in the concentration range up to 1.00 mol% did not affect the cac values for the PEO-SDS interaction. The C2 values decreased at
0.50 mol% DMF and then increased up to 1.00 mol%, reflecting an increase in the binding capacity of SDS to PEO (an opposite trend was observed in the presence of AN). At 2.50 mol%, the cac values could not be precisely obtained, for the same reason already discussed for the PEO-SDS interaction in the presence of 2.50 mol% AN.
The main differences between the effects of AN and DMF could be explained by the changes in the enthalpic and entropic contributions of the cosolvent in the PEO-SDS aggregation processes. As observed for the aggregation in the presence of DMF, the global process was exothermic and the ∆Hagg(int) values became more negative as the
DMF concentration increased. However, DMF made the process less exothermic than AN, for the same cosolvent concentrations. This effect was similar to the effects of the cosolvents on , once again suggesting that AN altered more the water tridimensional structure around the SDS hydrophobic chain, releasing a higher amount of enthalpic energy in the desolvation process.
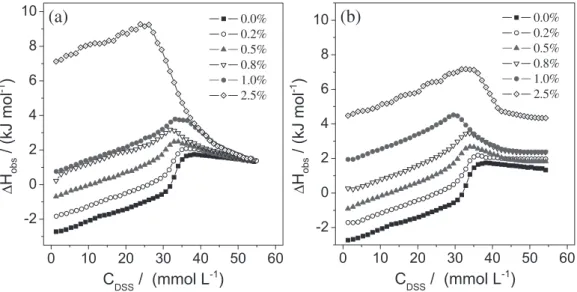
Important information about the effects of AN and DMF on the aggregation process can be obtained by studying the effect of the surfactant chain length on the PEO-surfactant interaction and the influence of AN and DMF on the thermodynamic parameters associated with that interaction. The ∆Hap−int versus CDSS curves
for the binding of DSS to PEO 35000 at different AN concentrations are shown in Figure 7. Similar results were obtained in the presence of DMF (Figure S3 in the Supplementary Information).
The profile of the ∆Hap−int versus CDSS curve for
the PEO-DSS interaction in water, with the presence of an endothermic peak followed by an exothermic peak, was similar to that observed for the PEO-SDS interaction, indicative of similar binding features for both surfactants. When AN cosolvent was added to the system in the concentration range from 0.0 to 0.80 mol%, the
∆Hap−intversus CDSS curves for the binding of DSS to PEO
showed decreases in the areas of both peaks. This suggested that the solvation shells of the DSS monomers and polymer segments were altered by the AN molecules, modifying
the enthalpy change involved in the solvation/desolvation processes. At 1.00 mol% AN, only an endothermic peak was observed. Interestingly, no peak was observed at 2.50 mol% AN, suggesting that the interaction between DSS and PEO had ceased at this concentration. It is likely that since DSS has a smaller hydrophobic tail than SDS, addition of 2.50 mol% AN cosolvent eliminated the contribution of the hydrophobic effect, i.e., the entropic gain due to the water releasing disappeared when the PEO-DSS interaction took place. This AN effect highlighted the main contribution of the hydrophobic interactions to the surfactant-PEO interaction.
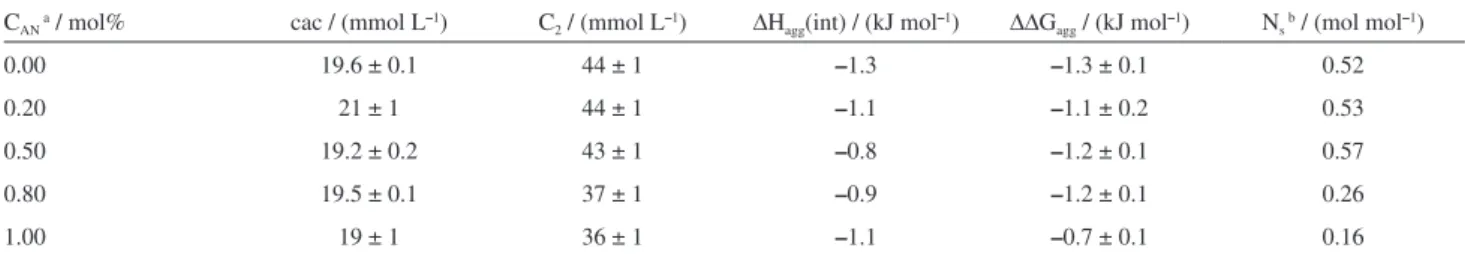
Table 4 shows the thermodynamic parameters calculated for the PEO-DSS interaction in the presence of water/acetonitrile at different molar ratios.
The increase in the AN concentration from 0 to 0.80 mol% did not affect the cac values, but decreased C2,
hence reducing the capacity of binding of the surfactant to the PEO chain and slightly increasing the ∆∆Gagg values,
similar to the results observed for the PEO-SDS interaction (Table 2).
Table 3. Thermodynamic parameters of the PEO-SDS interaction at different N,N-dimethylformamide concentrations
CAN / mol% caca / (mmol L–1) C2 / (mmol L–1) ∆Hagg(int) / (kJ mol–1) ∆∆Gagg / (kJ mol–1) Nsb / (mol mol–1)
0.00 3.6 ± 0.2 19 ± 1 –1.1 –2.0 ± 0.3 0.47
0.20 3.8 ± 0.2 15 ± 1 –1.2 –1.8 ± 0.4 0.37
0.50 3.7 ± 0.4 17 ± 1 –2.5 –1.8 ± 0.5 0.26
0.80 3.7 ± 0.3 19 ± 1 –3.2 –2.0 ± 0.4 0.47
1.00 4.0 ± 0.4 22 ± 1 –5.1 –1.8 ± 0.3 0.62
2.50 × 22 ± 1 –7.7 × 0.57
aThe cac value could not be determined from the profile of the ∆H
ap−intversus CSDS curves at 2.50 mol% DMF; bvalues are expressed as mole of SDS per mole of ethylene oxide unit.
Interestingly, the ∆Hagg(int) values for the PEO-DSS
and PEO-SDS interactions in water were quite similar (−1.1 and −1.3 kJ mol–1 for SDS and DSS, respectively),
confirming the energetic compensation effect caused by dehydration and rehydration processes of PEO segments at different stages of the aggregation. However, as the AN concentration increased, the ∆Hagg(int) values became more
negative for the PEO-SDS interaction and remained almost constant for the PEO-DSS interaction. It therefore appeared that the decrease in the size of the hydrocarbon chain of the surfactant modified the extent of hydrophobic interaction between the surfactant and the polymer.
Literature reports that morphological aspects of SDS micelles and PEO are affected by addition of cosolvents. For instance, using different organic polar cosolvents, Almgren and Swarup38 showed that the
apparent aggregation number of SDS micelles was reduced as cosolvent concentration increased. Lal and Hakem,39 using small-angle neutron scattering, showed
that PEO had an unusual expansion of its chain in water/AN mixtures (0.49-0.59% D2O) compared with
that observed in the pure solvents. The concentrations that have been investigated in that work, however, are too high to provide some insights for our discussion. In view of this, additional study using other physical techniques (NMR, dynamic light scattering (DLS) or small angle X-ray scattering (SAXS), for instance) should still be explored to elucidate unresolved issues about structural information of PEO-SDS aggregates in presence of AN and DMF.
Conclusions
Low contents of the organic cosolvents AN and DMF (0.0 to 2.5 mol%) affected the micellization process of sodium alkyl sulfate surfactants (SDS and DSS), altering the thermodynamics of aggregation of the surfactants in the presence of PEO. Calorimetric results suggested that both cosolvents modified the solvation shells of the species studied (polymer and surfactants) by altering the water
tridimensional structure. For this reason, the desolvation enthalpic energies of the surfactants and the polymer were decreased, making the aggregation processes less endothermic (or more exothermic). This effect depended on the hydrophobic chain length of the surfactant and the nature of the cosolvent. On the other hand, despite favoring the surfactant aggregation processes enthalpically, the cosolvents had almost no effect on the relative stability among the surfactant aggregates formed in the absence and in the presence of PEO.
Supplementary Information
Supplementary information (figures showing conductance versus SDS concentration curves in presence of AN and DMF; calorimetric curves of DSS dilution and apparent molar enthalpy change of PEO-DSS interaction in presence of DMF) is available free of charge at http://jbcs.sbq.org.br.
Acknowledgments
The authors are grateful to Fundação de Amparo à Pesquisa do Estado de Minas Gerais (FAPEMIG), Conselho Nacional de Desenvolvimento Científico e Tecnológico (CNPq), Financiadora de Estudos e Projetos (FINEP), and Instituto Nacional de Ciências e Tecnologias Analíticas Avançadas (INCTAA) for their financial support. G. M. D. F. and G. M. D. F. acknowledge CAPES for research fellowships.
References
1. Inori, R.; Okada, T.; Arie, T.; Akita, S.; Nanotechnology2012,
23, 235708.
2. Mukherjee, P.; Padhan, S. K.; Dash, S.; Patel, S.; Mishra, B. K.; Adv. Colloid Interface Sci.2011, 162, 59.
3. Di Crescenzo, A.; Aschi, M.; Del Canto, E.; Giordani, S.; Demurtas, D.; Fontana, A.; Phys. Chem. Chem. Phys.2011,
13, 11373.
Table 4. Thermodynamic parameters for PEO-DSS interaction at different acetonitrile concentrations
CAN a / mol% cac / (mmol L–1) C2 / (mmol L–1) ∆Hagg(int) / (kJ mol–1) ∆∆Gagg / (kJ mol–1) Ns b / (mol mol–1)
0.00 19.6 ± 0.1 44 ± 1 –1.3 –1.3 ± 0.1 0.52
0.20 21 ± 1 44 ± 1 –1.1 –1.1 ± 0.2 0.53
0.50 19.2 ± 0.2 43 ± 1 –0.8 –1.2 ± 0.1 0.57
0.80 19.5 ± 0.1 37 ± 1 –0.9 –1.2 ± 0.1 0.26
1.00 19 ± 1 36 ± 1 –1.1 –0.7 ± 0.1 0.16
4. Jiang, Z.; Li, X.; Yang, G.; Cheng, L.; Cai, B.; Yang, Y.; Dong, J.; Langmuir2012, 28, 7174.
5. Zhang, H.; Zeeb, B.; Salminen, H.; Feng, F.; Weiss, J.; J. Colloid Interface Sci.2014, 417, 9.
6. Lichtenberg, D.; Ahyayauch, H.; Alonso, A.; Goni, F. M.; Trends Biochem. Sci.2013, 38, 85.
7. Zdziennicka, A.; Jańczuk, B.; Appl. Surf. Sci.2010, 257, 1034. 8. Liu, J.; Han, B.; Zhang, J.; Mu, T.; Li, G.; Wu, W.; Yang, G.;
Fluid Phase Equilib.2003, 211, 265.
9. Sjöblom, J.; Blokhus, A. M.; Sun, W. M.; Friberg, S. E.;
J. Colloid Interface Sci.1990, 140, 481.
10. Barbosa, A. M.; Santos, I. J. B.; Ferreira, G. M. D.; da Silva, M. C. H.; Teixeira, A. V. N. C.; da Silva, L. H. M.; J. Phys. Chem. B2010, 11967.
11. Aghdastinat, H.; Javadian, S.; Tehrani-Bagha, A.; Gharibi, H.;
J. Phys. Chem. B2014, 118, 3063.
12. Gu, Y.; Shi, L.; Cheng, X.; Lu, F.; Zheng, L.; Langmuir2013,
29, 6213.
13. Ferreira, G. M. D.; Ferreira, G. M. D.; Agudelo, Á. J. P.; da Silva, M. C. H.; Rezende, J. P.; Pires, A. C. S.; da Silva, L. H. M.;
J. Phys. Chem. B2015, 119, 15758.
14. Bertie, J. E.; Lan, Z.; J. Phys. Chem. B1997, 101, 4111.
15. Kovacs, H.; Laaksonen, A.; J. Am. Chem. Soc.1991, 113, 5596. 16. Lei, Y.; Li, H.; Pan, H.; Han, S.; J. Phys. Chem. A2003, 107,
1574.
17. Jones, M. N.; J. Colloid Interface Sci.1967, 23, 36.
18. Dai, S.; Tam, K. C.; J. Phys. Chem. B 2001, 105, 10759. 19. Dai, S.; Tam, K. C.; J. Phys. Chem. B2006, 110, 20794.
20. Barbosa, A. M.; Santos, I. J. B.; Ferreira, G. M. D.; da Silva, M. C. H.; Teixeira, A. V. N. C.; da Silva, L. H. M.; J. Phys. Chem. B2010, 114, 11967.
21. Bayat, E.; Sadeghi, R.; Colloids Surf., A2013, 436, 260.
22. Niemiec, A.; Loh, W.; J. Phys. Chem. B 2008, 112, 727.
23. Bogomolova, A.; Keller, S.; Klingler, J.; Sedlak, M.; Rak, D.; Sturcova, A.; Hruby, M.; Stepanek, P.; Filippov, S. K.; Langmuir
2014, 30, 11307.
24. Peng, B.; Han, X.; Liu, H.; Tam, K. C.; J. Colloid Interface Sci.
2013, 412, 17.
25. Dai, S.; Tam, K. C.; Colloids Surf., A2003, 229, 157.
26. Liu, J.; Dong, B.; Sun, D.; Wei, X.; Wang, S.; Zheng, L.;
Colloids Surf., A2011, 380, 308.
27. Olofsson, G.; Loh, W.; J. Braz. Chem. Soc.2009, 20, 577. 28. Aragones, J. L.; MacDowell, L. G.; Vega, C.; J. Phys. Chem. A
2011, 115, 5745.
29. Takamuku, T.; Tabata, M.; Yamaguchi, A.; Nishimoto, J.; Kumamoto, M.; Wakita, H.; Yamaguchi, T.; J. Phys. Chem. B
1998, 102, 8880.
30. Marcus, Y.; Ion Solvation; Wiley: New York, USA, 1985. 31. Behera, K.; Pandey, S.; J. Colloid Interface Sci.2007, 316, 803.
32. Rodríguez, A.; Graciani, M. D.; Moya, M. L.; Langmuir2008,
24, 12785.
33. Bertie, J. E.; Lan, Z.; J. Phys. Chem. B1997, 101, 4111. 34. Behbehani, G. R.; Waghorne, W. E.; Thermochim. Acta2008,
478, 1.
35. Southall, N. T.; Dill, K. A.; Haymet, A. D. J.; J. Phys. Chem. B
2002, 106, 521.
36. Cabane, B.; J. Phys. Chem.1977, 81, 1639.
37. da Silva, R. C.; Loh, W.; Olofsson, G.; Thermochim. Acta2004,
417, 295.
38. Almgren, M.; Swarup, S.; J. Phys. Chem.1985, 89, 4621. 39. Lal, J.; Hakem, I. F.; Eur. Phys. J. E: Soft Matter Biol. Phys.
2004, 15, 217.
Submitted: March 24, 2017
Published online: June 20, 2017