A Comparative Study of the Polarographic Behavior of Cobalt(II),
Nickel(II), Manganese(II), and Zinc(II) in Azide Solutions
Claudia Giovedi*, and Roberto Tokoro
Instituto de Química, Universidade de São Paulo, C.P. 26077, 05599-970 São Paulo - SP, Brazil
Re ceived: June 30, 1996; Jan u ary 9, 1997
O comportamento eletroquímico dos metais cobalto(II), níquel(II), manganês(II) e zinco(II) foi estudado por polarografia em diferentes concentrações do ligante azoteto. As ondas de redução do cobalto(II) e níquel(II) apresentam deslocamento para potenciais mais positivos com o aumento da concentração de azoteto na solução. A antecipação máxima é de 300 mV para o cobalto(II) e de 370 mV para o níquel(II). No caso do zinco(II) registrou-se apenas uma pequena antecipação de 27 mV em baixas concentrações do ligante, ocorrendo em seguida o deslocamento da onda para potenciais mais negativos. O manganês(II), de comportamento diferente dos demais metais estudados, mostra apenas deslocamento no sentido de aumento da sobretensão.
The elec tro chem i cal be hav ior of co balt(II), nickel(II), man ga nese(II), and zinc(II) was stud ied by polarography at sev eral azide con cen tra tions. The re duc tion waves of co balt(II) and nickel(II) ex hibit a shift of the po ten tial to wards more pos i tive val ues, with the in creas ing ligand con cen tra tion in so lu tion. The max i mum an tic i pa tion ob served is 300 mV for co balt(II) and 370 mV for nickel(II). In the case of zinc(II), an an tic i pa tion of only 27 mV is ob served at low ligand con cen tra tions, and for sub se quent ad di tions of ligand the re duc tion wave shifts to -wards more neg a tive po ten tials. The be hav ior of man ga nese(II) is dif fer ent, as the re duc tion wave only shifts to wards more neg a tive po ten tials.
Key words:azide, cat a lytic ligand
In tro duc tion
The pseudohalide1 azide, N
3-, acts as a bridg ing ligand in re dox re ac tions in ho mo ge neous me dia, mak ing the elec -tron trans fer easy2. In nonhomogeneous me dia, the cat a -lytic ef fect is also ob served due to the ad sorp tion of the ligand on the mer cury sur face, with the long axis re main ing per pen dic u lar to the metal sur face3. A shift in the re duc tion wave to wards more pos i tive po ten tials is ob served in the pres ence of the ligand4, as com pared with the wave of the metal aquo ion. The azide can there fore be clas si fied as a cat a lytic ligand5.
Studies of the elec tro chem i cal be hav ior of some met als in azide me dia show that the ex ten sion of the cat a lytic ac -tion changes from one metal to an other6. The ac tion of azide as a cat a lytic ligand de pends not only on ligand ad
-sorp tion on the elec trode sur face, but also on the na ture of the metal pres ent.
The re sults ob tained by means of sys tem atic polarographic stud ies of the elec tro chem i cal be hav ior of some met als be long to the Irving-Williams or der7 at the pres ence of azide are shown in this pa per.
Ex per i men tal
All re agents were chem i cally pure or of an a lyt i cal grade. The azide and per chlor ate so lu tions were stan dard -ized by the gravimetric method. The per chlor ate so lu tions of co balt(II), nickel(II), man ga nese(II), and zinc(II) were pre pared by re act ing perchloric acid in ex cess with the metal car bon ate. These so lu tions were stan dard ized by Atomic Emis sion Spec tros copy with In duc tive Ar gon Plasma8. The free-acid pres ent in the stock so lu tions was de ter mined by the method of stan dard ad di tion9. The ionic Ar ti cle
strength was main tained con stant in 2.0 mol/L with the ad -di tion of so -dium per chlor ate.
The nor mal and dif fer en tial pulse polarograms were car ried out with an EG&GPARC 273A potentiostat at -tached to a Static Mer cury Drop Elec trode 303A cell stand. The work ing elec trode was a me chan i cally con trolled drop ping mer cury elec trode. The ref er ence elec trode was Ag/AgCl, and the aux il iary elec trode was a plat i num wire. All so lu tions were deoxygenated with ar gon, and the tem per a ture was al ways 25 °C. The con cen tra tions of co -balt(II), man ga nese(II), and zinc(II) were 1 x 10⁻³ mol/L, and for nickel(II) the con cen tra tion was fixed at 0.5 x 10⁻³ mol/L to avoid polynuclear com plex for ma tion. The azide con cen tra tion was var ied from 0 to 2.0 mol/L.
The ex per i ments were car ried out with suc ces sive ad di -tions of a metal so lu tion in 2.0 mol/L NaN3 to a so lu tion in 2.0 mol/L NaClO4 of the same metal. Since the metal con -cen tra tion in both so lu tions was the same, its con -cen tra tion and the ionic strength re mained con stant, chang ing only the azide con cen tra tion.
Perchloric acid was added to so lu tions in the ex per i -ments with co balt(II) and zinc(II) in or der to pre vent the hy dro ly sis of the metal. The ad di tion of strong acid to the sys tem re sults in a buffer so lu tion formed by the weak acid, HN3, and its salt NaN3. The cor rect acid con cen tra tion was de ter mined us ing the Henderson-Hasselbach equa tion10. The ad di tion of perchloric acid was avoided as pos si ble due to the great ox i dant power of the HN3 formed, which can cause cat a lytic waves, as ob served in the co balt(II)/azide sys tem11.
Re sults and Dis cus sion
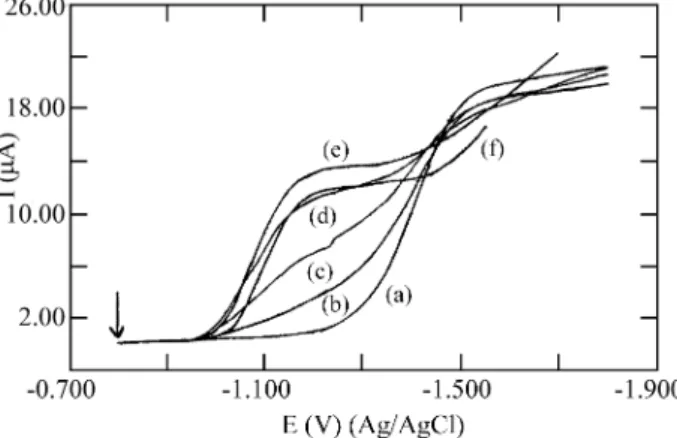
The nor mal pulse re duc tion wave of co balt(II) in azide me dia shows a pro gres sive an tic i pa tion, with a split into two waves with E1/2 equal to -1.070 and -1.370 V vs. Ag/AgCl, re spec tively (Fig. 1). The cur rent as so ci ated with the first wave (E1/2 = -1.070 V) in creases with the grad ual
ad di tion of azide. With the sec ond wave (E1/2 = -1.370 V) the op po site oc curs: the cur rent de creases un til it dis ap -pears for an azide con cen tra tion equal to 0.70 mol/L. In pre vi ous re search it was shown that the first wave cor re -sponds to the re duc tion of the metal com plex spe cies, and the sec ond, to the free uncomplexed metal12. The split of the waves orig i nates in the fact that the polarographic ex -per i ments in volve time in ter vals too short to -per mit the trans for ma tion of the metal aquo ion into the complexed spe cies af ter the later are re duced on the mer cury sur face. At high azide con cen tra tions, there is al most no metal aquo ion in so lu tion, and the re duc tion wave of this spe cies dis -ap pears.
The nor mal pulse polarograms re corded for co balt(II) show a signficant de crease in the value of the lim it ing cur rent at high azide con cen tra tions, prob a bly due to the ki -netic prob lems as so ci ated with the elec trode pro cess un der these con di tions.
The max i mum an tic i pa tion of the to tal re duc tion wave in azide me dia as com pared with the metal re duc tion wave in perchorate me dia is ob tained for the ad di tion of 0.70 mol/L azide. This an tic i pa tion is equal to 300 mV.
In the in ter val of azide con cen tra tion from 0.7 to 1.0 mol/L, the E1/2 of the re duc tion wave re mains prac ti -cally con stant, and at con cen tra tions higher than 1.0 mol/L a shift in the re duc tion wave oc curs to wards more neg a tive po ten tials. The max i mum value, 30 mV, is ob tained for 2.0 mol/L azide.
The polarographic re duc tion wave of nickel(II) in per -chlor ate me dia shows E1/2 equal to -1.020 V vs. Ag/AgCl. With the ad di tion of azide, a split ting into two waves oc -curs with E1/2 equal to -0.650 and -1.020 V vs. Ag/AgCl, re -spec tively (Fig. 3). This split ting is ob served for ligand con cen tra tions from 0.05 to 0.10 mol/L, and the first wave (E1/2 = -0.650 V) in creases, while the sec ond de creases with the pro gres sive ad di tion of azide. For ligand con cen
-Fig ure 2. Dif fer en tial pulse polarograms for 1 x 10⁻³ mol/L co balt(II) so lu tion at ionic strength 2.0 mol/L with azide con cen tra tions: (a) 0, (b) 0.05, (c) 0.10, (d) 0.20, (e) 1.0, and (f) 2.0. Scan rate: 10 mV s-1; scan in cre ment: 2 mV; pulse width: 50 ms; pulse height: 25 mV.
tra tions equal to 0.15 mol/L or higher, the curves show only one wave with E1/2 equal to -0.650 V.
The vari a tion of the re duc tion wave height of nickel(II) with the ad di tion of azide is not lin ear with azide con cen tra -tion. A cur rent limit is reached with the ad di tion of 0.50 mol/L azide. For the aquo ion re duc tion wave, the cur rent de creases rap idly, and it be comes zero near 0.20 mol/L azide.
When the azide con cen tra tion is higher than 1.0 mol/L, the re duc tion wave shifts to wards more neg a tive po ten tials, and the most neg a tive value of E1/2 (cor re spond ing to a shift of 50 mV) was ob tained for an azide con cen tra tion of 2.0 mol/L.
The cur rent max i mum re corded for the re duc tion wave of nickel(II) was re ported in pre vi ous pa pers for the lig ands thiosulfate13 and thiocyanate14, how ever the ex pla na tion of the pres ence of this max i mum is not given. Pre vi ous pa pers on max ima in pulse polarography re ported that the in crease in the pulse width can elim i nate the prob lem15,16. This ar ti fice was used in the ex per i ments with nickel(II), and the re -sults ob tained with pulse widths lon ger than 50 ms showed that the cur rent max ima de crease, but are not com pletely elim i nated. This in di cates that in the nickel(II)/ azide sys tem there are other prob lems in the elec trode pro cess, re -sult ing in the max ima and the in crease in the lim it ing cur rent ob served in both tech niques used.
The cur rents re corded by means of both of the tech -niques used (Figs. 3 and 4) show a sig nif i cant in crease with in creas ing azide con cen tra tion. This fact can be ex plained for ex per i ments with dif fer en tial pulse polarography, as -sum ing that this tech nique is sen si tive to the ki netic ef fects of the elec trode pro cess17. Thus, the in crease in the cur rent de notes a mi nor ir re vers ibil ity of the elec trode pro cess.
The ef fect of azide on the re duc tion wave from man ga nese(II) dif fers com pletely of the re sults ob tained for co -balt(II) and nickel(II). The ad di tion of azide to a so lu tion of
man ga nese(II), at an ionic strength of 2.0 mol/L per chlor -ate, causes a grad ual shift in the re duc tion wave to wards more neg a tive po ten tials (Fig. 5). The max i mum shift, 140 mV, was re corded for the ad di tion of 2.0 mol/L azide.
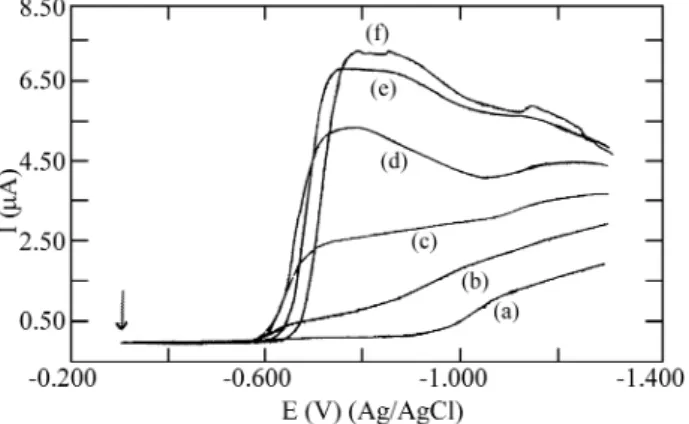
The dif fer en tial pulse polarograms for man ga nese(II) show a sig nif i cant de crease in cur rent for azide con cen tra -tions higher than 0.50 mol/L (Fig. 6), in di cat ing a de crease in the re vers ibil ity of the elec trode pro cess.
For zinc(II), the ad di tion of azide at con cen tra tions lower than 0.030 mol/L causes a shift in the re duc tion wave to wards more pos i tive po ten tials in com par i son with the wave of the metal aquo ion (Fig. 7). The max i mum an tic i -pa tion ob served was 27 mV.
For azide con cen tra tions higher than 0.030 mol/L, the re duc tion wave starts to shift to wards more neg a tive po ten -tials. The max i mum shift to the neg a tive po ten tial, 96 mV, was ob tained with the ad di tion of 2.0 mol/L azide.
An im por tant fact ob served for zinc(II) in the polarograms ob tained in both tech niques (Figs. 7 and 8) is the clear mod i fi ca tion of the re vers ibil ity in the pres ence of
Fig ure 3. Nor mal pulse polarograms for 0.5 x 10⁻³ mol/L nickel(II) so lu tion at ionic strength 2.0 mol/L with azide con cen tra tions: (a) 0, (b) 0.05, (c) 0.10, (d) 0.20, (e) 1.0, and (f) 2.0. Ini tial po ten tial: -0.3 V, scan rate: 10 mVs-1; scan in cre ment: 2 mV; pulse width: 20 ms.
Fig ure 4. Dif fer en tial pulse polarograms for 0.5 x 10 -3 mol/L
nickel(II) so lu tion at ionic strength 2.0 mol/L with azide con cen tra -tions: (a) 0, (b) 0.05, (c) 0.10, (d) 0.20, (e) 1.0, and (f) 2.0. Scan rate: 10 mV s -1; scan increment: 2 mV; pulse width: 20 ms; pulse height: 25mV.
azide. Small con cen tra tions of azide are suf fi cient to cause a great change in the re vers ibil ity of the elec trode pro cess, as ob served in the nor mal pulse polarograms - the curves in the pres ence of azide are more ver ti cal than the curve ob -tained in 2.0 mol/L per chlor ate - and the dif fer en tial pulse polarograms are more pointed in azide me dia.
Con clu sions
The re sults ob tained for co balt(II), nickel(II), man ga nese(II), and zinc(II) in azide me dium con firmed the cat a -lytic ac tion of the ligand on the re duc tion pro cess, and the fact that this ac tion is de pend ent on the metal pres ent.
The cat a lytic ef fect was higher for nickel(II), fol lowed by co balt(II) and zinc(II). For man ga nese(II) this ef fect was not ob served.
The re sults ob tained show that the over all ac tion of the azide on the metal re duc tion pro cess is a re sult of two fac -tors: 1) the ad sorp tion of the ligand on the mer cury sur face, form ing a bridge that makes the elec tron trans fer eas ier (ki
-netic fac tor), con se quently shift ing the wave to wards more pos i tive po ten tials, and 2) the for ma tion of more sta ble complexed spe cies with a higher num ber of more sta ble co -or di nated lig ands which need a higher overpotential to be re duced (ther mo dy namic fac tor), and there fore shift ing the wave to wards more neg a tive po ten tials. An other pos si ble im por tant fac tor in the over all re sults ob tained is the chem i -cal ki net ics of sub sti tu tion of the wa ter mol e cules by azide, which may be an ex pla na tion for the de crease in the lim it ing cur rent (at high azide con cen tra tions) ob served for co -balt(II).
For co balt(II) and nickel(II), the elec tro chem i cal ki -netic fac tor is pre pon der ant up to azide con cen tra tions of 0.70 and 0.50 mol/L, re spec tively, and then the re duc tion waves shift to wards more pos i tive po ten tials. Af ter an azide con cen tra tion of 1.0 mol/L for both met als, the ther -mo dy namic fac tor be comes re spon si ble for the shift of the re duc tion waves to wards more neg a tive po ten tials, due to the for ma tion of more sta ble com plexes.
For zinc(II), low azide con cen tra tions (lower than 0.030 mol/L) are suf fi cient to make the elec tron trans fer eas ier, and makes the elec trode pro cess more re vers ible. For higher azide con cen tra tions, how ever, a shift to wards more neg a tive po ten tials is ob served, in di cat ing the pre -pon der ance of the ther mo dy namic fac tor.
The val ues of the ther mo dy namic for ma tion con stants (β1) for spe cies with one co or di nated azide mol e cule (M(N3)+) for the stud ied met als, at an ionic strength of 2.0 mol/L so dium per chlor ate are 4.218, 5.719, 5.820, and 6.021 (mol/L)-1, for Mn(II), Co(II), Ni(II), and Zn(II), re -spec tively.
The low value ob served for man ga nese(II) ex plains the elec tro chem i cal be hav ior of this metal in azide me dia. The in ter ac tion be tween the metal and the ligand ad sorbed on the mer cury sur face be ing weak, the ef fect of the ligand as a bridge is not ver i fied. The pres ence of the ad sorbed ligand
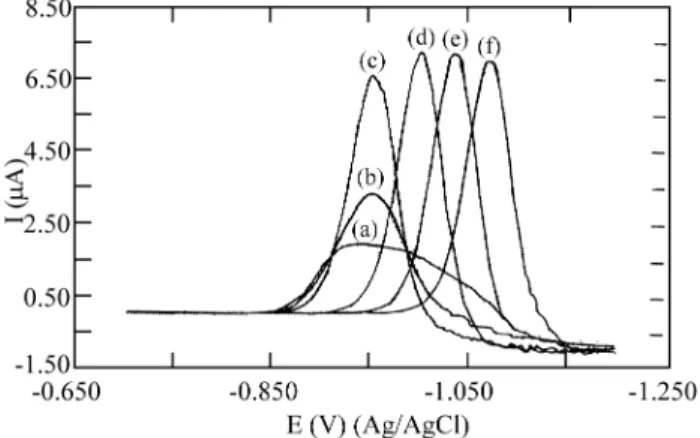
Fig ure 7. Nor mal pulse polarograms for 1 x 10⁻³ mol/L zinc(II) so lu -tion at ionic strength 2.0 mol/L with azide con cen tra -tions: (a) 0, (b) 0.03, (c) 0.10, (d) 0.50, (e) 1.0, and (f) 2.0. Ini tial po ten tial: -0.7 V; scan rate: 10 mV s-1; scan in cre ment: 2 mV; pulse width: 50 ms.
Fig ure 8. Dif fer en tial pulse polarograms for 1 x 10⁻³ mol/L zinc(II) so lu tion at ionic strength 2.0 mol/L with azide con cen tra tions: (a) 0, (b) 0.03, (c) 0.10, (d) 0.50, (e) 1.0, and (f) 2.0. Scan rate: 10 mV s-1; scan in cre ment: 2 mV; pulse width: 50 ms; pulse height: 25 mV.
makes the elec tron trans fer from the elec trode to the metal aquo ion pres ent in so lu tion more dif fi cult, shift ing the re -duc tion wave to wards more neg a tive po ten tials.
Ac knowl edg ments
The au thors thank FAPESP (Fundação de Amparo à Pesquisa do Estado de São Paulo) for fi nan cial sup port.
Ref er ences
1. Golub, A.M.; Kolher, H.; Skopenko, V.V. Chem is try of Pseudohalides; Elsevier; New York ,1986, p 28. 2. Beck, W.; Fehlammer, W.P. In Main Group El e
-ments: Groups V and VI; Butterworths; Lon don, 1972, p 286.
3. Moteo, A.J.; Gon za les, E.R.; Avaca, L.A. Can. J. Chem.1986, 64, 413.
4. Anson, F.C. Acc. Chem. Res.1975, 8, 400.
5. Ruvinskii, O.E.; Tur’yan, Ya.I. J. Anal. Chem. USSR
1976, 3, 460.
6. Senise, P.; Neves, E.A. An. Acad. Brasil. Ciênc.1969, 41, 333.
7. Irving, H.; Wil liams, R.J.P. An a lyst1952, 77, 813. 8. Mermet, J.M. Spec tro scopic Di ag nos tics: Ba sic Con
-cepts in In duc tively Cou pled Plasma Atomic Emis sion Spec tros copy; Wiley Interscience; New York, 1987. 9. Neves, E.A.; Silva, T.V. In Anais do 4° Simpósio
Brasileiro de Eletroquímica e Eletroanalítica1984, São Carlos - SP, Brazil, p 63.
Paulo, 1982, p 522.
11. Tokoro, R.; Neves, E.A. J. Electroanal. Chem. 1981, 125, 115.
12. Giovedi, C. In Estudo da Redução do Cobalto(II) em Meio Aquoso de Azoteto de Sódio por Polarografia de Pulso; Mas ter’s The sis, Instituto de Química da Universidade de São Paulo, São Paulo, 1994. 13. Da vis, A. Anal. Chem.1958, 30, 1729.
14. Tanaka, N. Bull. Chem. Soc. Ja pan1950, 23, 253. 15. Bolzan, J.A. Coll. Czech. Chem. Commun.1987, 52,
587. 16.
721.
17. Osteryoung, J.; Hasebe, K. Rev. of Polarogr. (Kyoto)
1976, 22,1.
18. Moya, H.D. In Estudo Potenciométrico dos Equilíbrios no Sistema Manganês(II)/Azoteto;Mas -ter’s The sis, Instituto de Química da Universidade de São Paulo, São Paulo, 1992 .
19. Neves, E.A.; Tokoro, R.; Suárez, M.E.V. J. Chem. Res. (M)1979, 4401.
20. Suárez, M.E.V.; Neves, E.A. Poly he dron 1992, 11, 759.
21. Neves, E.A.; Sant’Agostino, L. Anal. Chim. Acta