Artigo
*e-mail: [email protected]
SYNCHRONOUS SCANNING PHOSPHORIMETRY FOR THE SELECTIVE DETERMINATION OF CHRYSENE: A METROLOGICAL STUDY
Alessandra L. M. C. da Cunha, Roberta L. Ziolli e Ricardo Q. Aucélio*
Departamento de Química, Pontifícia Universidade Católica do Rio de Janeiro, Rua Marquês de S. Vicente, 225, 22451-900 Rio de Janeiro – RJ, Brasil
Recebido em 28/9/09; aceito em 7/2/10; publicado na web em 21/5/10
Room-temperature phosphorimetry was used to quantify trace levels of chrysene in sugar-cane spirits and in ish bile. A selective phosphorescence enhancer (AgNO3) and synchronous scanning allowed the detection of ng amounts of chrysene. Accuracy (113 ±
17%) and selectivity was evaluated using the CRM-NIST-1647d - Priority Pollutant Polycyclic Aromatic Hydrocarbons in acetonitrile. Analysis of sugar-cane spirit samples enabled recovery of 108 ± 18% which agreed with the one achieved using HPLC. Method’s uncertainty was equivalent to 3.4 ng of the analyte, however, the analyte pre-concentration (SPE) improved sensibility and minimized the relative uncertainty. Characterization and homogeneity studies in ish bile were also performed.
Keywords:synchronous scanning room-temperature phosphorimetry; metrological study; chrysene.
INTRODUCTION
Polycyclic aromatic compounds (PACs) comprise a complex class of condensed multinumbered benzenoid-ring compounds being for-med mainly as a result of pyrolytic processes, specially the incomplete organic materials combustion. Many PACs are capable of producing tumors, being benzo[a]pyrene (BaP) chosen as the model compound in several carcinogenicity studies. Carcinogenicity evidence of PACs to humans comes primarily from occupational studies by workers following inhalation and dermal exposures.1 No consistent data is
available for the oral ingestion consequences of these contaminants by humans, however, drinking water, food and beverages have been identiied as an exposure route. Although chrysene is considered a relatively weak carcinogen when compared to BaP, studies indicated that individual PACs have been shown to interact metabolically in a variety of ways, resulting in synergic, additive or antagonistic effects and, therefore, nothing can be concluded on the resulting tumorigenic actions of an individual PAC in complex mixtures. PACs have been found in substantial quantities in food and beverages and according to the Scotish legislation, the allowed limit value for chrysene in food and beverages is 2 µg L-1.2 In the case of sugar-cane derivatives (sugar
and beverages), the contamination comes from sugar-cane plantations burning during the harvest season. In fact, a myriad of PCAs have been found in extracts of sugar-cane.3,4 A recent study has indicated
that chrysene, among other PACs, may be used as sugar-cane burning tracers since they were extensively found in atmospheric particulate from several regions in the Brazilian sugar-cane belt.5 Chrysene has
also been used as a pollution tracer in oil contaminated areas since it can be detected in ish bile as some ish species may be used as monitors for identify and evaluate consequences of oil spills.
Several analytical methods have been developed for the selective determination of PACs, among them is chrysene. The prime technique for the selective determination of PACs in food, beverages and in environmental samples is high performance liquid chromatography with luorescence detection (HPLC-DF). This technique was recently used to measure ive of the 13 PACs classiied as carcinogenic and genotoxic in “cachaça”.6 In another work, HPLC-DF was applied to
quantify the sixteen PACs indicated by the EPA as priority pollutants.7
Solid surface room-temperature phosphorimetry (SSRTP) may allow the selective detection of analytes. Since most PACs do not present natural phosphorescence, singlet-triplet excited state popu-lation changing is achieved by the use of the external heavy atom effect. Such effect is very dependent on the analyte/phophorescence inducer pair and therefore, the correct choice of phosphorescence inducer (inorganic salts of high atomic weight elements) may grant selective phosphorescence observation of a speciic PAC in the pre-sence of several other ones.8,9 Selectivity in SSRTP is enhanced by
the use of synchronous luminescence scanning which minimize the phosphorescence signal from concomitant species that present values of ∆λ (difference between the maximum wavelengths of excitation and emission) different from the analyte of interest.10
Metrology is a science of measurements including the ones carried out in analytical chemistry. Chemical measurements are essential in different ields backing up important decisions that often have to be taken in support to legislation, productive processes and so on. Measured results are reliable only if their uncertainty is quantiied. Uncertainty is a metrological term which deines the parameter associated with the result of a measurement and characterizes the dispersion of the values that could be reasonably attributed to the measured parameter. The analytical chemistry community must be aware that the evaluation of uncertainty yields improvement of the quality of a measurement procedure, since the uncertainty sources can be identiied, isolated and minimized. The Guide to the Expression of Uncertainty Measurement (GUM)11 established general rules for
evaluation and expressing uncertainty for various kinds of measure-ments. This approach requires the identiication of all possible sources of uncertainty associated with the applied procedure, the estimation of their magnitude either from experimental or published data and, inally, the combination of all individual sources to give standard and expanded uncertainties involved in the whole measurement procedure.
EXPERIMENTAL
Instrumentation
Phosphorescence measurements were made on a luminescence spectrometer LS-55 (Perkin-Elmer, Norwalk, USA) coupled to a solid surface analysis apparatus modiied to allow a low of purging gas dried on the sample holder. A delay time of 3 ms and a gate time of 3 ms were employed. Silver enhanced phosphorescence from chrysene (λexc/λem = 270/514 nm) was obtained by synchronous scanning (∆λ = 244 nm). Whatman 42 ilter paper (Whatman, Kent, UK) treated with sodium dodecyl sulfate (SDS) was used as solid substrate to induce phosphorescence after it was treated to reduce its natural background. Substrate (ilter paper) background reduction consisted of washing paper strips with boiling water in a Soxhlet apparatus for 2 h, drying and exposition to ultraviolet irradiation for another 2 h. These solid substrates were cut in circles (about 0.74 cm in diameter). Chromatographic analysis was made on a high performance liquid chromatograph (Waters, USA) equipped with a Model 1525 binary pump and a Model 2478 multi λ luorescence detector set at 274/383 nm. Sampling was made manually using a Reodyne injector and a 20 µL sample loop. Degassing of mobile phase solvents was made off-line in a 9 L ultrasonic bath, Model NSC2800 (Unique, São Paulo, Brazil). Separation was made on a 4.6 x 150 mm X-Terra RP C18 (Waters, Massachusetts, USA) with 5 µm particle size. The column was kept inside an oven set at 35 0C. Isocratic elution (1 mL min-1)
was used with acetonitrile/water 80/20% v/v. Retention time for chrysene was 5.0 min.
Reagents
Ultrapure water (resistivity of 18.2 MΩcm) was from a water ultra puriier master system 1000 (Gehaka, São Paulo, Brazil). Nitrogen (99.996%) was from Lynde (Rio de Janeiro, Brazil) and it was further puriied passing it through an ammonium metavanadate solution and dried in a silica gel bed. Chrysene, pyrene, benzo[b]naphto[2,3-d] thiophene, dibenzothiophene, 7,8-benzoquinoline and carbazol were Acros Organics (New Jersey, USA). Benzothiophene, dibenzo(a,j)ac-ridine and 7,9-dimethylbenzo[c]acdibenzo(a,j)ac-ridine, anthracene, benzo[a]pyrene, 1-hydroxypyrene, luoranthene, benzo[ghi]perylene, and 1,2 benz[a] anthracene were from Sigma-Aldrich, USA. HPLC-grade acetonitrile, ethanol, and sodium dodecyl sulfate (SDS) were from Merck, Brazil. AgNO3 was from Vetec (Rio de Janeiro, Brazil). Commercial cachaça samples were acquired in local markets. The ish bile samples were collected from Guanabara Bay, Rio de Janeiro, RJ (in a supposedly contaminated area) and Itaipu Beach, Niteroi, RJ (area free from contamination). Certiicate reference material (CRM 1647d - Prior-ity Pollutant Polycyclic Aromatic Hydrocarbons in acetonitrile) was from the National Institute of Standards (NIST, Maryland, USA).
Procedure
Chrysene stock solution (1x10⁻⁴ mol L-1) were prepared in ethanol/
water 50/50% v/v and used to prepare all diluted standard working solutions. Prior to the deposition of the analyte, sample or blank, the center of the substrate was spotted with 5 µL of SDS solution (0.25 mol L-1) followed by the deposition of 25 µg of AgNO
3 (5 µL of
AgNO3 solution 0.03 mol L-1). The spotted substrates were
vacuum-dried at room temperature for 2 h and then placed in a desiccator until the measurements were carried out. In order to make the analytical measurement, the substrates were placed on the sample holder and inserted in the front surface accessory. Pre-concentration of chrysene, was made by passing 100 mL of sample through a 3 mL volume C18
cartridge (Unitech USA-Brand, USA) with 500 mg of solid phase. Analyte was then eluted using small volume of methanol or ethyl acetate. Bile samples were diluted (0.2 mL of the bile in ethanol/ water 50/50% v/v, forming a 10 mL solution) followed the clean up step by passing it through a silica cartridge (0.45 µm). A pool of bile was prepared by mixing 80 ish bile samples.
RESULTS AND DISCUSSION
Room-temperature phosphorescence for chrysene
Room-temperature phosphorimetry is characterized by its capabi-lity for ultra-trace determination and selectivity.12,13 Phosphorescence
can be readily obtained by using careful experimental conditions, de-oxigenated environment and immobilization of the analyte in order to minimize nonradiative deactivation mechanisms of the excited triplet state caused by dynamic quenching and vibrational relaxation.10
Adsorption on a solid substrate, such as cellulose, guarantees the immobilization of several classes of analytes at room-temperature and the use of surface modiiers such as SDS may improve analyte interaction with the substrate (better immobilization), and with the heavy atom enhancers placed in the substrate to increase phosphores-cence signal (more effective external heavy atom effect).12-14 The use
of the external heavy-atom effect may induce or amplify phospho-rescence of speciic substances in a complex mixture to a few orders of magnitude by signiicantly enhancing both the rate of intersystem crossing (excited singlet state – excited triplet state transition) and the phosphorescence rate constant, therefore, the detection power of room-temperature phosphorimetry is also increased.10
AgNO3 was found to be a very effective heavy atom salt inducer for chrysene in substrates containing SDS (270/514 nm), which enabled a single peak at 270 nm when applying synchronization with ∆λ = 244 nm). Under these conditions, pyrene, carbazol, di-benzothiophene, 7,9-dimethylbenzo[c]acridine, anthracene, benzo[a] pyrene, 1-hydroxypyrene, and 1,2 benz[a]anthracene do not present phosphorescence. Dibenzothiophene and 7,8-benzoquinoline present very small phosphorescence at respectively 290 and 266 nm when applying synchronous scanning, which implied in no interference in the chrysene. Other PCAs (benzo[b]naphto[2,3-d]thiophene, dibenzo(a,j)acridine, luoranthene and benzo[ghi]perylene) have strong phosphorescence induced by Ag(I) in SDS treated cellulose substrates, however, their signal can be readily discriminated from the one from chrysene by using synchronized scanning set at 244 nm (Table 1).
The maximization of the chrysene signal was performed by eva-luating the amount of AgNO3 placed on the substrate since external heavy atom effect is dependent on the amount of the enhancer placed Table 1. Silver-enhanced room-temperature phosphorescence from chryse-ne, benzo[b]naphto[2,3-d]thiophechryse-ne, dibenzo(a,j)acridichryse-ne, luoranthene and benzo[ghi]perylene in SDS modiied cellulose substrate
PCAa λ
exc/λem (nm) ∆λ (nm)
Relative phosphorescenceb
Chrysene 270/514 244 1
Fluoranthene 288/573 285 1.8
Benzo[ghi]perylene 255,308/522 267 or 214 1.1 Dibenzo(a,j)acridine 310/533 223 0.42 benzo[b]naphto
[2,3-d]thiophene 275/568 293 0.73
a5 µL of PCA solution at 1 x 10⁻⁴ mol L-1 spotted on the substrate. bRatio
in the vicinity of the analyte. Amounts between 9 and 51 µg of AgNO3 (5 µL of solutions from 0.01 to 0.06 mol L-1) were tested in presence
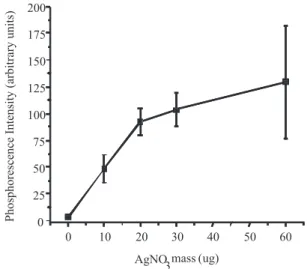
of SDS (360 µg). The SDS amount on the substrate was also tested (between 18 and 360 µg) and the best signal was obtained with 360 µg of the surfactant. It was observed that larger amounts of the silver salt were responsible for the highest signals. However, the larger the amount of AgNO3, the darker was the ilm formed on the surface of the substrate due to the interaction with the excitation UV light, and therefore, the worse was the reproducibility of results (Figure 1).
The amount of 25 µg of the salt was chosen and under such conditions, synchronized spectra of four increasing amounts of chrysene are shown in Figure 2. After optimizing by univariate stu-dies, a 22 factorial design (amount of SDS and amount of AgNO
3)
was applied to verify interactions between factors, in order to allow a ine adjustment of experimental conditions to be performed, and to relect the robustness of each factor. The optimum experimental conditions obtained were the chrysene solution ethanol/water 50:50% v/v on a substrate containing 25 µg of AgNO3 and 360 µg of SDS. No interaction was found between the factors. Under such conditions, RTP measurements were made with synchronous scanning (∆λ = 244 nm) with the signal measurement at the maximum wavelength of the synchronized band at 271 nm.
Analytical igures of merit and uncertainty associated to the phosphorimetric measurement
The analytical igures of merit were estimated from analytical curves constructed using the experimental conditions optimized for the maximum phosphorescence. The absolute limit of detec-tion (ALOD) of 0.7 and 2.0 ng were achieved using the following equations: 3sb m-1 V MM and (C
xb+3sb)V MM,
15 where s b is the
standard deviation from 10 blank determinations, m is the slope of the analytical curve, xb is the average blank signal, in mol L-1, MM
is the molar mass of chrysene and V is the volume of the analyte solution deposited on the substrate (5 µL) and Cxb+3sb is the analyte concentration (mol L-1) that is equivalent to x
b plus 3sb. The
theoreti-cal minimum masses of analyte that can be detected by this SSRTP method were 2.0 and 3.9 ng. These values were calculated using the absolute limit of quantiication (ALOQ) based respectively on the 10sb m-1 V MM and (C
xb+10sb) V MM
15 criteria. However de validity
of these absolute limits has yet to be evaluated by considering the magnitude of the uncertainty of the phosphorescence measurement of chrysene. Linear response extended up to at least 120 ng of analyte in the substrate (R2=0.985). The Table 2 shows the obtained analytical
parameters of merit.
Method’s robustness was evaluated through the 22 factorial design
and further testing the effect of small variations on the mass of AgNO3 on the substrate, which was varied from 20 to 30 µg (average of 25 µg). A robust condition implies in no signiicant signal change when an experimental parameter is varied by a speciic range from the optimum value. Statistical tests indicated no differences in chrysene phosphorescence measured from substrates containing AgNO3 in the studied range of mass values.
As several sources contribute with the uncertainty associated to a measurement,16,17 uncertainties sources associated to SSRTP
must be identiied and quantiied. In order to do that, the approach employed was the use of an incomplete model, in which uncertainty sources are grouped and are evaluated as a whole. Relevant sources for the phosphorescence measurement uncertainty were divided in four different main groups: the repeatability (ur); the reproducibility (uR); the analytical curve (ucurve) and the ones associated with the preparation of solutions (us).
Repeatability is affected by changes in the substrate sur-face (in this work, the formation of the black ilm is due to the silver nitrate interaction with UV light during the ten consecutive signal measurements), variation in purging gas low and random variations characteristic of repetitions. The uncertainty associated to the repe-atability (ur) was estimated through the relative standard deviation (RSD) based on 10 sequential measurements of deposited 10 different substrates condition 11 ng of chrysene. Variation due to repeatability was equivalent to the phosphorescence signal from 2.8 ng of chry-sene. Such 20% signal variation may be considered satisfactory for measurements made from inhomogeneous media such as cellulose.
Reproducibility is affected by the using of different solid subs-trates, variations in the excitation source and other instrumental Figure 1. Amount of AgNO3 in the substrate and the effect in the chrysene
phosphorescence using synchronous scanning
Figure 2. Synchronous scanning SSRTP of different amounts of chrysene (a = 23 ng, b = 21 ng, c = 18 ng and d = 13 ng) in SDS treated cellulose substrates containing 25 μg of AgNO3
Table 2. Analytical igures of merit using synchronous scanning SSRTP Parameter Values obtained (criteria)
LOD (ng) 0.7 (3 sb m
-1 V MM)
2.0 (Cxb+3sb V MM)
LOQ (ng) 2.2 (10 sb m
-1 V MM)
3.9 (Cxb+10sb V MM)
Liner range (ng) 5.9 - 120
variations in long duration or day-to-day experiments, change of analyst and so on. The uncertainty associated to the reproducibility (uR)was estimated through the RSD of phosphorescence measure-ments from chrysene made by two different analysts (10 substrates each one) using the variable analyses (ANOVA). All values for each of the two sets of results were compared by applying a hypothe-sis test. The estimative of such uncertainty was made taking into consideration the standard deviation achieved in the repeatability experiment (sr) which in fact may be represented by the square root of the mean square value obtained within each analyst, √MSwithin, and the standard deviation achieved between analysts (sbetween), where
sbetween = √(MSbetween –MSwithin)/n). The mean square values (MS) are
the summation of the difference between each independent value and the mean value and n is the number of replicates. Reproducibility was in fact the standard deviation expressed as sbetween representing the uR value. Variation due to reproducibility was equivalent to the phosphorescence signal from 0.4 ng of chrysene.
The uncertainty associated to the preparation of solutions (us) takes into consideration only analyte solution since the robust condition has been related to the mass of heavy atom salt it minimizes the inluence in the signal caused by small concentrations variations of the solution used to carry AgNO3 to the substrate. Volumetric apparatuses for volume and solution delivering adjustment and the balance contribute to this source of uncertainty. In this case, the declared expanded uncertainties of the volumetric lasks (Uvf), balance (Ubal) and microliter pipette (Ump) must be taken into consideration to get the inal value of us as indicated in equation 1, where u(x) = U(x)/k with k =2 (95% conidence intervals). The usvalue was calculated by the square root of the quadratic sum-mation of the three uncertainty values (see equation below) multiplied by 0.21 which is the uncertainty of the dilution factor uf36 where 36 is the dilution factor. A variation equivalent to the phosphorescence from 1.6 ng of chrysene was obtained.
(1)
Finally, for the calibration curve, the uncertainty associated to the linear and angular coeficients carries out contributions from va-riance and deviation of the curve and from the sensibility coeficients (used to uniform uncertainties dimensional units, allowing quadratic summation to be performed). The analytical curve was constructed with solutions of four different chrysene concentrations chosen to be within the linear response range. These solutions were spotted in cellulose substrates and measured. From the concentrations and their phosphorescence signals, the standard deviations for both the sensitivity (m) and linear coeficient (b) of these analytical curves were calculated in order to get their respective uncertainties um and ub. From these results, ucurvewas calculated using the Equation 2.
(2) where, cib and cim are sensitivity coeficients, sb and sm are standard deviations for respectively the linear and the angular coeficients and r is a correlation coeficient. The values of sb and sm were obtained from the following Equations 3 and 4.
(3) (4)
where x values indicate each one of the n concentrations or amounts of chrysene used to construct the calibration curve containing n points.
The symbols s2 and D are respectively the variance and the deviation
of the curve and they are given respectively by the Equations 5 and 6. (5) (6)
where ∆ is the difference between the one expected value of x
(xexpected) in the best it of the curve and the experimental value of x
(xexperimental). The uncertainties ub and um were calculated respectively
from Equations 7 and 8
(7) (8) The sensibility coeficients cib (Equation 9) and cim (Equation 10) were used to uniform dimensional units of the uncertainties, allowing the quadratic summation to be performed. The correlation coeficient r was obtained from Equation 11. The ucurve value was equivalent to 1.2 ng of chrysene.
(9)
(10)
(11)
The combined uncertainty, uc, must be calculated by quadratic summation of all considered uncertainties, Equation 12.
(12) The uncertainty associated to the SSRTP method, given by uc, was equivalent to the signal produced by 3.4 ng of chrysene in the substrate (28% of the measured signal produced by 14 ng of chrysene on the substrate). The major source of uncertainty was from the repeatability which is mainly affected by variation in signal measurement from solid substrate. In addition, the value of uc was around 1.5 times the value estimated to be the ALOQ of the method indicating that the chosen criteria to calculate ALOQ was not adequate for signal measurements from substrate that impose high signal variations (high blank signal variation). However considering the Cxb+10sb V MM equation, the uncertainty is compatible with the ALOQ of the method. In order to minimize the relative magnitude of the uncertainty in relation to the quantity that was measured, analyte pre-concentration procedure should be used since the blank signal would became smaller in contrast to the measured analyte signal.
The method uncertainty is the expanded one, U(95%;k=2), which is obtained by multiplying the quadratic combination of sources by a coverage value (k), in this case 2, in order to express uncertainty at a conidence interval at some probability level (95.45% in this case): U = 2uc. The value obtained was 6.8 ng.
Uncertainty estimation of the biological material
bile of the type Mugil liza). Such studies are very important when it comes to biological matrices, in order to obtain the uncertainty of the material that may be employed as a reference material.18
In theory, a material is perfectly homogeneous with respect to a particular property, if there is no signiicant difference between the values of this property in different parts of the material.
However, in practice, a material is considered homogeneous with respect to a particular property when the difference between the values of this property among different portions of the material is negligible compared with the uncertainty components of the material as a whole. If the matrix in question is a solution or an apparently pure material, the study of homogeneity is necessary to prove the homogeneity and to detect possible laws in the process of preparation (in this case, the preparation of the pool of bile). But if the matrix in question is heterogeneous, the homogeneity study is necessary to estimate the degree of such heterogeneity.18
Ten measurements were made from ten different ish bile sam-ples as well as from a ish bile sample pool (mixture of 80 ish bile samples). Each individual samples and the sample pool were fortiied with chrysene (1.6 x 10⁻⁵ mol L-1). A hypothesis test was applied as
a means for comparison and the t0 obtained (0.250)was compared with the tabulated value in the Student t distribution (2.101) using the appropriate degrees of freedom (df), i.e. df = n1 + n2 – 2 (18). The obtained results did not show signiicant difference to a level of t0.975, when compared to the average from the individual values (average value = 1.25 x 10⁻⁵ mol L-1, standard deviation = 9.24 x 10⁻⁶ mol L-1)
and from the ish pool (average value = 1.54 x 10⁻⁵ mol L-1; standard
deviation = 3.95 x 10⁻⁶ mol L-1). However the standard deviation value
regarding the measurement from individual samples was greater. This can be justiied by differences in biological sample matrices caused by differences in the metabolism of individual ish.
The combined uncertainty μc of the biological material is calculated through Equation 13. The biological material uncertainty is then obtained from expanded uncertainty, U(95%;k=2) which is obtained by Equation 14.
(13)
U = 2uc (14)
where u2
charac is the characterization uncertainty; u
2
homog is the
homoge-neity uncertainty. The uncertainties obtained in the characterization and homogeneity studies were: ucharac 3.95 x 10⁻⁶ mol L-1 (pool
stan-dard deviation from ten bile samples) and uhomog. 2.79 x 10⁻⁵ mol L1
(pooled standard deviation between pool and individual bile samples, sp) using Equation 15.
(15)
where n, number of measurement (10); s1, individual standard de-viation; s2, pool standard deviation.
The expanded uncertainty U calculated was 2.82 x 10⁻⁵ mol L-1,
equivalent to 32 ng of chrysene indicating a high uncertainty value from the pool of bile (175% of the reference chrysene value). As the bile matrix (in special the color and its viscosity) changes from ish to ish, this imposes dificulties in the mixing and, therefore, a heterogeneous material is achieved.
Selectivity and sample analysis
The selectivity of the method and its accuracy were evaluated by the analysis of the certiicate reference material CRM 1647d, which contains chrysene together with other 15 PACs. The recovery
achieved for chrysene was 113 ± 17% (n=6; 97.5%) indicating the acceptance of the result (tcalculated = 0.706 < tcritical = 2.571). This result indicated that the choice of heavy atom enhancer and synchronous scanning enabled selectivity of the determination. Figure 3 shows the synchronous scanning spectra of the chrysene in presence of 15 PACs.
Analyte fortiied sugar-cane spirit samples (1 x 10⁻⁵ mol L-1 of
chrysene) were also analyzed by SSRTP (n=6) and compared with the results achieved using HPLC-DF (n=6). The results from the analysis using both techniques were statistically similar (tcalculated = 0.80 < tcritical = 2.228 at 97.5%) with analytical recoveries of 108 ± 18% for SSRTP and 104 ± 13% HPLC-DF. In order to get better sensibility, pre-concentration of chrysene in a C18 cartridge was performed (in order to get at least 100 fold improvement). Chrysene fortiied samples (at 1 x 10⁻⁷ mol L-1 level) were passed through C-18 cartridge, eluted
and then analyzed by synchronous scanning SSRTP with recovery of 102 ± 20% (n=4). This result was statistically similar to the ones obtained with HPLC-DF. Commercial sugar-cane spirit samples were analyzed by synchronous scanning SSRTP (four industrialized cachaças and three artisanal ones made in small distilleries) with chrysene concentrations varying from 7.4 x 10⁻⁷ to 1.1 x 10⁻⁶ mol L-1
(industrialized) and from 1.1 x 10⁻⁶ to 1.7 x 10⁻⁶ mol L-1 (artisanal).
A recovery test, using synchronous scanning SSRTP (n=6), was also made with analyte fortiied ish bile (bile from a single ish) and the result obtained was 94 ± 19%. The ish bile was obtained from the controlled area supposedly free of contamination.
CONCLUSION
In this work, a selective SSRTP method that combines use of AgNO3 and synchronous scanning (∆λ = 244 nm) was reported. The method allowed the determination of chrysene in complex samples containing a myriad of other PACs without the need for previous separation procedures. Selective and accurate determinations of chry-sene in sugar-cane spirits (cachaça) and ish bile were made. In order to achieve a detection power compatible to a reliable quantiication of chrysene at 1 x 10⁻⁷ mol L-1 level in cachaça, a SPE analyte
expected to be made in order to optimize and minimize the value
uhomog found. Probably the time and/or the procedure used to prepare
the pool of samples were not suficient to complete homogenization.
ACKNOWLEDGMENTS
The following scholarships are acknowledged: VRAC-PUC-RIO (da Cunha), FAPERJ (Aucélio and Ziolli) and CNPq (Aucélio). The authors thank scientiic funding from FINEP-MCT, CNPq and FAPERJ.
REFERENCES
1. Vo-Dinh, T.; Chemical Analysis of Polycyclic Aromatic Compounds, Chemical Analysis series, 2nd ed., J. Wiley & Sons: New York, 1989,
vol. 101.
2. Zamperlini, G. C. M.; Silva, M. R. S.; Vilegas, W.; J. Chromatogr., A 2000, 281, 889.
3. Zamperlini, G. C. M.; Silva, M. R. S.; Vilegas, W., Chromatographia 1997, 46, 655.
4. Dennis, M. J.; Massey, R. C.; Mc Weeny, D. J.; Knowles, M. E.; Watson, D.; Food Chem. Toxicol. 1983,21, 569.
5. Magalhães, D.; Bruns, R. E.; Vasconcellos, P. C.; Quim. Nova 2007, 30, 577.
6. Tfouni, S. A. V.; Machado, R. M. D.; Camargo, M. C. R.; Vitorino, S. H. P.; Vicente, E.; Toledo, C.; Food Chem. 2007, 101, 334.
7. Bettin, S. M.; Franco, D. W.; Cienc. Tecnol. Aliment. 2005,25, 234. 8. Vo-Dinh, T.; Hooyman, J. R.; Anal. Chem. 1979,51, 1915. 9. Arruda, A. F.; Aucélio, R. Q.; Anal. Sci. 2002,18, 831.
10. Vo-Dinh T.; Room Temperature Phosphorimetry for Chemical Analysis, Chemical Analysis series, 1st ed., J. Wiley & Sons: New York, 1984, vol.
68.
11. CITAC/EURACHEM; Guide quantifying uncertainty in analytical measurements, 2nd ed., 2000.
12. Aucélio, R. Q.; Campíglia, A. D.; Talanta 1994,41, 2131. 13. Aucélio, R. Q.; Cardoso, C. E.; J. Braz. Chem. Soc. 2006, 17, 1323. 14. De Lima, C. G.; Andino, M. M.; Winefordner, J. D.; Anal. Chem. 1986,
58, 2867.
15. CITAC/EURACHEM; Guide to Quality in Analytical Chemistry, 2002. 16. Gonzalez, A. G.; Herrador, M. A.; Trend. Anal. Chem. 2007,26, 227. 17. Cunha, A. L. M. C.; Marques, F. F. C.; Ziolli, R. L.; Aucélio, R. Q.;
Metrologia 2008, 45, 474.