Quim. Nova, Vol. 34, No. 3, 404-407, 2011
Artigo
*e-mail: [email protected]
DETERMINATION OF ALUMINUM IN FOOD SAMPLES AFTER PRECONCENTRATION AS ALUMINON COMPLEX ON MICROCRYSTALLINE NAPHTHALENE BY SPECTROPHOTOMETRY
Mohammad Reza Fathi, Nahid Pourreza*and Zeinab Ardan
Department of Chemistry, College of Science, Shahid Chamran University, Ahvaz, Iran
Recebido em 17/4/10; aceito em 10/10/10; publicado na web em 26/1/11
A sensitive preconcentration procedure for spectrophotometeric determination of aluminum was developed. Aluminum as aluminon complex is adsorbed on microcrystallinenaphthalene. The naphthalene containing the complex is dissolved in 3 mL of acetone and its absorbance is measured at 544 nm. The effect of various factors on the preconcentration of aluminum was investigated. The calibration graph was linear in the range of 1-60 µg L-1. The limit of detection was 0.52 µg L-1 and relative standard deviation for the determination of 5 µg L-1 was 2.65%. The proposed solid phase extraction procedure was applied to determination of aluminum in food samples. Keywords: aluminum; preconcentration; food samples.
INTRODUCTION
Aluminum is a non essential element and toxic metal which is widespread throughout the environment. Some studies suggest that aluminum may be accumulated in the brain via different routes (drinking waters, food, and medicines) and interfere with the normal activities of nervous system. Aluminum causes problems for human health because this metal ion has been considered as a possible cause of renal osteodystrophy, Parkinson disease and Alzheimer’s disease.1 Therefore determination of trace levels of aluminum in food and environmental samples is of great importance.
Various instrumental techniques have been used for the analysis of aluminum at trace levels. These include lame atomic absorption spec-trometry,2 inductively coupled plasma - mass spectrometry (ICP-MS),3 inductively coupled plasma-atomic emission spectrometry (ICP-AES),4,5 graphite furnace atomic absorption spectrometry6 and spectrophotome-tery.7-10 ICP-MS and ICP-AES are expensive instruments with high costs of operation.11 Spectrophotometric methods are simple and low cost procedures that have been widely used for the determination of metal ions which could form a color complex with chromogenic reagents.12,13 However, sometimes the sensitivity is not good enough for the determi-nation of low concentrations of aluminum and a preconcentration step is often required. Several methods for the separation and preconcentration of aluminum with extraction procedures have been reported, e.g., liquid-liquid extraction,14 cloud point extraction15 liquid–liquid microextraction16 and solid phase extraction.17-19 Solid phase extraction (SPE) has several advantages over other preconcentration procedure including simplicity, low consumption of reagents, rapidity and high preconcentration fac-tor.20 A variety of solid phase extractants such as Tiron modiied resin,17 nanometer-sized titanium dioxide19 and naphthalene21 have been used for preconcentration and determination of trace amounts of aluminum.
In this paper a simple method with solid phase extraction is described for the determination of Al (III). Aluminon is used as a selective ligand for the formation of colored complex. This complex is retained on microcrystalline naphthalene in a mini column. The solid mass containing naphthalene and the retained complex is then dissolved in acetone and its absorbance is measured at 544 nm.
EXPERIMENTAL
Instruments
A GBC Cintra 101, UV-Visible spectrophotometer (Australia) was used for absorbance measurements using 1 cm glass cells.
A digital pH-Meter model 632, Metrohm (Switzerland) with a combined glass electrode was used for pH adjustments. A Teb Azma vacuum pump (Iran) was used for setting the low rate.
Reagents
All reagents were of analytical grade and the solutions were pre-pared with double distilled water. A stock solution of 1000 µg mL-1 of Al(III) was prepared by dissolving 1.38 g of Al(NO3)3.9H2O (Merck) in 5 mL of concentrated HNO3 and diluted to 100 mL. The working solutions were prepared by suitable dilution of the stock solution. An aluminon solution (1 x 10⁻³ mol L-1) was prepared by dissolving 0.5 g of aluminon (Merck) in distilled water and diluting to 1000 mL. A 0.2 mol L-1 of hydrochloric acid solution was prepared by diluting 8.3 mL of concentrated hydrochloric acid (Merck) to 500 mL.
The microcrystalline naphthalene was prepared by dissolving 20 g of naphthalene in 60 mL of acetone on a stirrer .This solution was transferred to a breaker containing 1000 mL of distilled water at room temperature and then allowed to stand for 30 min. The mi-crocrystalline naphthalene slurry was then iltered on a ilter paper, dried and stored in a glass bottle for further use.
Preparation of naphthalene column
A larger naphthalene crystal was placed at the bottom of glass column (7.0 cm long and 0.7 cm in diameter) in order to prevent the leakage of the adsorbent. Then 0.1 g of dried microcrystalline naphthalene as the adsorbent was poured into the glass column and slightly pressed in the column with a lat glass rod.
Sample preparation
Determination of aluminum in food samples after preconcentration 405
Vol. 34, No. 3
and potato samples were irst carbonized each, and then burned in the furnace at 700 °C for 3-4 h. After each residue was cooled to room temperature, it was extracted by heating in 1.0 mL of 6 mol L-1 HCl, iltered into a 100 mL volumetric lask.22 This solution was treated under the general procedure. Five replicate measurements were per-formed for each sample. The recovery tests were also perper-formed by adding known concentrations of aluminum solution to the samples. The percent recovery was calculated from the added and found values.
Preconcentration procedure
An aliquot of Al(III) stock solution (so that its inal concentration would be in the range of 1-60 µg L-1), 5 mL of 1 x 10⁻³ mol L-1 of alu-minon and 5 mL of 0.2 mol L-1 hydrochloric acid were added to 250 mL volumetric lask and diluted to 250 mL with water. The solution containing Al(III) complex was passed through the naphthalene colu-mn at a low rate 6 mL min-1. The naphthalene adsorbent containing the complex was dissolved in 3 mL of acetone and its absorbance was measured at 544 nm. A blank solution was also run under the same experimental conditions without adding any aluminum.
RESULTS AND DISCUSSION
The preliminary experiments showed that Al-aluminon complex was effectively retained on microcrystalline naphthalene while the blank solution containing aluminon was not retained appreciably on this adsorbent. Therefore, the retention of this complex on na-phthalene was used to develop a preconcentration procedure and spectrophotometric method for the determination of aluminum. The absorption spectrum of the solid mass containing naphthalene and Al-aluminon complex dissolved in acetone showed that maximum absorbance occurs at 544 nm. Thus all the absorption measurements were performed at this wavelength.
Effect of type and concentration of acid
The effect of HNO3 and HCl as acids on the formation of Al-aluminon complex was studied. HNO3 was not suitable because it decreased the absorbance of Al complex. Therefore the effect of different concentrations of HCl in the range of 1 x 10⁻³ to 7 x 10⁻³ mol L-1 was investigated. The results given in Figure 1 show that the absorbance of Al-aluminon complex was maximum in the range of 3 x 10⁻³ to 5 x 10⁻³ mol L-1 of HCl. Thus, a concentration of 4 x 10⁻³ mol L-1 of HCl was selected for subsequent studies.
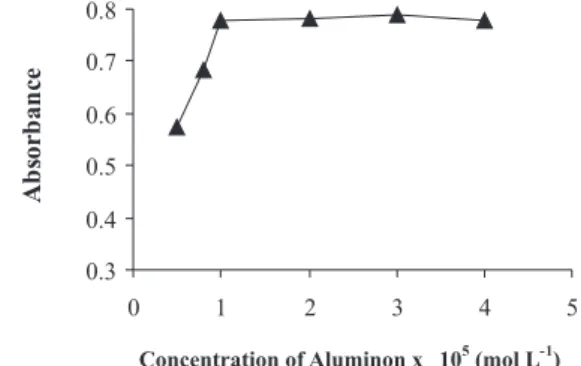
Effect of aluminon concentration
The inluence of aluminon concentration was also investigated in
the range of 0.5 x 10⁻⁵ to 4.0 x 10⁻⁵ mol L-1. Figure 2 shows that the absorbance of Al complex was increased up to 1.0 x 10⁻⁵ mol L-1 and remained constant above that. By increasing the reagent concentra-tion, the complex is formed more completely and the absorbance is increased. When the complex formation is complete the absorbance becomes constant and reaches a plateau. Thus, a concentration of 2.0 x 10⁻⁵ mol L-1 where the complex formation is complete was selected as optimum concentration.
Effect of solvent type and volume
Various solvents such as acetone, chloroform, dichioromethane, dimethylsulfoxide, dimethylformamide, tetrahydrofuran and etha-nol were examined for dissolving the microcrystalline naphthalene containing the complex. Chloroform and dichloromethane did not dissolve the aluminum complex and only dissolved the naphthalene sorbent. Ethanol and acetone dissolved the solid mass containing the complex but the color of the complex was not stable in ethanol. Therefore, acetone was selected as the dissolving solvent.
Different volumes of acetone in the range of 3-6 mL were used and 3 mL of acetone was selected for further work because it dissolved the adsorbent containing the complex completely. At higher volumes, the solution becomes more diluted and the absorbance is decreased. Lower volumes than 3 mL were not used because it does not dissolve the whole adsorbent containing complex.
Effect of the amount of adsorbent
The effect of amounts of microcrystalline naphthalene as the adsorbent was studied in the range of 0.05-0.20 g. The results showed that absorbance was increased when the amount of adsorbent was increased but at higher amounts than 0.1 g, the blank readings are also increased. Thus 0.1 g of adsorbent was selected for further work. The higher amounts than 0.2 g were not tested because the adsorbent did not dissolve in 3 mL of solvent completely. The naphthalene crystals can be collected, recycled and used several times without loss in sensitivity.
Effect of sample low rate
Sample low rate is an important parameter to obtain quantitative retention of analyte ion. Thus the effect of sample solution low rate on the retention of the complex was examined in the range of 2-12 mL min-1 using a pump. The results indicated that the low rate of 4-7 mL min-1 was suitable for retention of the complex on the naphthalene column because the absorbance of the eluted complex was constant.
Figure 1. Effect of hydrochloric acid concentration on the absorbance of
aluminum complex after solid phase extraction on naphthalene. Conditions:
aluminon concentration 2.0 x 10⁻⁵ mol L-1, sample volume 100 mL, low rate
6 mL min-1; solvent 3 mL of acetone
Figure 2. Effect of aluminon concentrationon the absorbance of aluminum
complex Hafter solid phase extraction on naphthalene. Conditions:
hydro-chloric acid concentration 4 x 10⁻³ mol L-1;sample volume 100 mL, low rate
Fathi et al.
406 Quim. Nova
Therefore, a low rate of 6 mL min-1 was selected as optimum low rate. At higher low rates there was a reduction in the absorbance of aluminum complex, because there is not suficient contact time between the sample solution and naphthalene.
Effect of sample volume
In pre-concentration procedure is desired to achieve high bre-akthrough volumes and also high pre-concentration factor so that lower concentrations can be analyzed. Thus in order to determine maximum applicable volume of sample solution, the volume of the aqueous phase was varied from 100 to 500 mL. All solutions contained 10 µg of aluminum and 4 x 10⁻³ mol L-1 of hydrochloric acid. The obtained results showed that the absorbance of aluminum complex was constant up to 500 mL sample volume but because higher volumes increased the analysis time, we used 250 mL of the sample volume for further work. Thus, a preconcentration factor 83.3 can be achieved when using 250 mL of the sample volume and dissolving the solid mass in 3 mL of acetone.
Characteristics of the method
The calibration graph was obtained using the proposed procedure for preconcentration of aluminum with a sample volume of 250 mL. The calibration graph was linear in the range of 1-60 µg L-1 in the initial solution with an equation of A = 0.019C + 0.0043, where A is the absorbance and C is aluminum concentration in µg L-1. The regression coeficient for the line is 0.9993 (n=10). The limit of de-tection calculated from three times the standard deviation of 12 blank solutions was 0.52 µg L-1 which is better or comparable to some of the previously reported methods.2,7-10,13,15 The relative standard deviation (R.S.D) for 10 replicate measurements of 5 and 40 µgL-1 by using general procedure was 2.65 and 1.06% respectively.
Interference studies
In order to examine the effect of different ions on the determi-nation of Al(III), a constant amount of aluminum was taken with different amounts of ions and general procedure was followed. Any deviation of 5% or more from the absorbance value of the standard solution was considered as interference. Results given in Table 1 show that large number of ions tested have no effect on the determination of aluminum. Therefore, the proposed procedure is highly selective.
APPLICATION
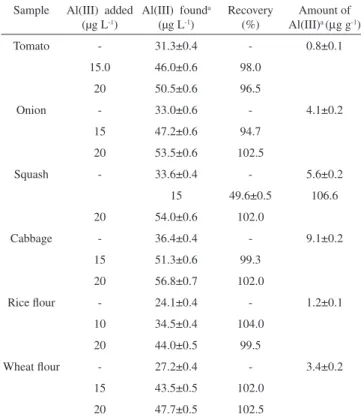
The proposed procedure was applied to the determination of aluminum in food samples. Known amounts of aluminum were also spiked to food samples in order to perform recovery tests. The results are given in Table 2. The results indicate the capability of the procedure in the determination of aluminum and good agreement was obtained between the added and measured analyte amounts. In order to validate the results potato and rice samples were analyzed by both
the purposed procedure and ICP emission method (Table 3). There was no signiicant difference between the results at 95% conidence limit by performing t test.
CONCLUSION
The results presented in this paper demonstrate the usefulness microcrystalline naphthalene for quantitative preconcentration of aluminum in different samples. The proposed procedure allows the determination of aluminum to be carried out at µg L-1 levels. The procedure is a simple and eficient preconcentration procedure which uses a low cost adsorbent and gives low LOD and good selectivity with respect to some of the previously reported procedures. The solid phase extraction procedure was successfully applied to the monitoring of Al in various food samples with good accuracies.
ACKNOWLEDGEMENT
The authors wish to thank Shahid Chamran University Research Council for inancial support of this work (Grant 1389).
REFERENCES
1. Sang, H.; Liang, P.; Du, D.; J. Hazard. Mater. 2008, 154, 1127.
Table 1. Effect of interfering ions on the determination of 40 ng mL-1 of Al(III) Interfering ion Tolerance ratio (w/w) Ca2+, Mg2+, Na+, K+, Hg2+, Pb2+, I-, Cd2+, Tl3+ 1000
CO32-, Co2+, Ni2+, Mn2+, Cr3+, Bi3+, NO3-, 700 SO4
2-, Zn2+, Cu2+, PO 4
3-, HPO 4
2- 500
Fe2+, Fe3+ 200
F- 20
Table 2. Determination of Al(III) in food samples under optimum conditions Sample Al(III) added
(µg L-1)
Al(III) founda (µg L-1)
Recovery (%)
Amount of Al(III)a (µg g-1)
Tomato - 31.3±0.4 - 0.8±0.1
15.0 46.0±0.6 98.0 20 50.5±0.6 96.5
Onion - 33.0±0.6 - 4.1±0.2
15 47.2±0.6 94.7 20 53.5±0.6 102.5
Squash - 33.6±0.4 - 5.6±0.2
15 49.6±0.5 106.6 20 54.0±0.6 102.0
Cabbage - 36.4±0.4 - 9.1±0.2
15 51.3±0.6 99.3 20 56.8±0.7 102.0
Rice lour - 24.1±0.4 - 1.2±0.1
10 34.5±0.4 104.0 20 44.0±0.5 99.5
Wheat lour - 27.2±0.4 - 3.4±0.2
15 43.5±0.5 102.0 20 47.7±0.5 102.5 a. x_± ts /√n at 95% conidence (n=5)
Table 3. Determination of Al(III) in potato and rice sample and comparison with ICP method
Sample Amount of Al(III) (µg g-1)
Found by this procedure a Found by ICPa
Potato 3.18±0.15 3.32±0.15
Determination of aluminum in food samples after preconcentration 407
Vol. 34, No. 3
2. Safavi, A.; Momeni, S.; Saghar, N.; J. Hazard. Mater. 2009, 162, 333. 3. D’Ilio, S.; Violante, N.; Caimi, S.; Di Gregorio, M.; Petrucci, F.;
Seno-fonte, O.; Anal. Chim. Acta2006, 573–574, 432.
4. Luo, M. B.; Wu, H.; Zhang, J.; Lin, H.; Han, W. Y.; Bi, S. P.; Atom. Spectrosc.2007, 28, 95.
5. Masson, P.; Talanta2007, 71, 1399.
6. Narin, I.; Tuzen, M.; Soylak, M.; Talanta2004, 63, 411.
7. Abbasi, A.; Farmany, A.; Gholivand, M. B.; Naghipour, A. F.; Abbasi, F.; Khani, H.; Food Chem. 2009, 116, 1019.
8. Matsumiya, H.; Iki, N.; Miyano, S.; Talanta 2004, 62, 337.
9. Nascimento, P. C.; Jost, C. L.; Guterres, M. V.; Del Fabro, L. D.; de Carvalho, L. M.; Bohrer, D.; Talanta 2006, 70, 540.
10. Li, Z.; Lu, N.; Zhou, X.; Song, Q.; J. Pharm. Biomed. Anal. 2007, 43, 1609.
11. Komarek, J.; Cervenka, R.; Ruzicka, T.; Kuban, V.; J.Pharm. Biomed. Anal. 2007, 45, 504.
12. Ni, Y.; Huang, C.; Kokot, S.; Anal. Chim. Acta 2007, 599, 209.
13. Huseyinli, A. A.; Alieva, R.; Haciyeva, S.; Güray, T.; J. Hazard.Mater. 2009, 163, 1001.
14. Zhang, J.; Xu, H.; Ren, J. L.; Anal. Chim. Acta2000, 405, 31. 15. Bavili Tabrizi, A.; Food Chem.2007, 100, 1698.
16. Rezaee, M.; Yamini, Y.; Khanchi, A.; Faraji, M.; Saleh, A.; J. Hazard. Mater. 2010, 178, 766.
17. Luo, M.; Bi, S.; J.Inorg. Biochem. 2003, 97, 173.
18. Luo, M. B.; Wu, H.; Zhang, J.; Chen, D.; Bi, S. P.; Sep. Sci. Technol. 2008, 43, 2225.
19. Matus, P.; Hagarova, I.; Bujdos, M.; Divis, P.; Kubova, J.; J. Inorg.
Biochem.2009, 103, 1473.
20. Ghaedi, M.; Ahmadi, F.; Tavakoli, Z.; Montazerozohori, M.; Khanmo-20. Ghaedi, M.; Ahmadi, F.; Tavakoli, Z.; Montazerozohori, M.; Khanmo-Ghaedi, M.; Ahmadi, F.; Tavakoli, Z.; Montazerozohori, M.; Khanmo-hammadi, A.; Soylak, M.; J. Hazard. Mater.2008, 152, 248. 21. Pourreza, N.; Behpour, M.; Microchem. J.1999, 6, 250.
22. Ma, Q.; Cao, Q.-E.; Zhao, Y.; Wua, Sh.; Hua, Zh.; Xu, Q.; Food Chem.