Quim. Nova, Vol. 34, No. 3, 373-376, 2011
Artigo
*e-mail: [email protected]
SPECTROPHOTOMETRIC DETERMINATION OF CATECHOLAMINE USING VANADIUM AND ERIOCHROME CYANINE R
Padmarajaiah Nagaraja*, Ashwinee Kumar Shrestha, Anantharaman Shivakumar, Naef Ghallab Saeed Al-Tayar and Avinask K. Gowda
Department of Studies in Chemistry, University of Mysore, Manasagangotri, Mysore 570 006, India
Recebido em 31/1/10; aceito em 29/9/10; publicado na web em 26/1/11
A highly sensitive spectrophotometric method for the analysis of catecholamine drugs; L-dopa and methyldopa, is described. The analysis is based on the reaction of drug molecules with vanadium (V) which is reduced to vanadium (IV) and form complex with eriochrome cyanine R to give products having maximum absorbance (λmax) at 565 nm. Beer’s law is obeyed in the range 0.028-0.84 and 0.099-0.996 μg mL-1 for L-dopa and methyldopa, respectively. The statistical analysis as well as comparison with reported methods demonstrated
high precision and accuracy of the proposed method. The method was successfully applied in the analysis of pharmaceutical preparations. Keywords: L-dopa; methyldopa; vanadium.
INTRODUCTION
Catecholamine drugs are aromatic vic-diols in which either the 3- or 4- position is unsubstituted and these positions are not sterically blocked. These drugs are now widely used to treat several disorders. L-Dopa, also known as levodopa is used as a irst-line treatment for Parkinson’s disease, usually along with carbidopa or benserazide.1 The drug readily crosses
the blood brain barrier and is decarboxylated to dopamine in the brain. It has also found to ameliorate the conditions in acromegaly.2 Methyldopa
is an effective antihypertensive agent when given in conjunction with a diuretic. It is a prodrug, which is metabolised to an active metabolite, α-methylnorepinephrine, which acts as a α
2-adrenergic receptor agonist
in the brainstemto attenuate the output of vasoconstrictor adrenergic signals to the peripheral sympathetic nervous system.3
A vast number of methods have been developed for the analysis of these compounds. L-Dopa is estimated by LC-MS-MS,4
chemilu-minescence,5 HPLC-DAD,6 voltametry7 and HPTLC.8 Similarly,
me-thyldopa has been reported to be estimated by NMR9 and HPLC-MS10
methods. Also, several spectrophotometric methods are reported for the determination of these drugs. L-Dopa is estimated by tris(1,10-phenanthroline),11 p-nitro aniline,12 sulphanilamide,13 sulfanilic acid,14
4-aminobenzoic acid,15 isoniazid,16 sodium metaperiodate,17
Cu(II)-neocuproine,18 chloranil,19 potassium ferricyanide,20 and
4-aminoan-tipyrine.21 Methyldopa is estimated by tris(1,10-phenanthroline),11
p-nitro aniline,12 sulphanilamide,13 sulfanilic acid,14 4-aminobenzoic
acid,15 isoniazid,16 polyphenol oxidase22 and barbituric acid.23
Herein, we have developed a highly sensitive method for the de-termination of catecholamine drugs based on the complex formation between reduced vanadium and eriochrome cyanine R. The method is simple, accurate and free from interference by excipients. EXPERIMENTAL
Apparatus
A Jasco (Model UVIDEC-610 UV-VIS spectrophotometry with
1-cm matched quartz cuvettes was used for all absorbance measu-rements.
Materials
Analytical reagent grade chemicals and bidistilled water were used throughout the experiment. L-Dopa (LD) and methyldopa (MD) were all purchased from Sigma (USA) and used as working solution without further treatment. Sodium metavandate was purchased from E. Merk (Germany) anderiochrome cyanine R (ECR) was obtained from E. Merk (Germany). Stock solutions of each drug containing 100 μg mL-1 were prepared by dissolving 10 mg of the respective
drugs in 100 mL of water. The resulting solutions were standardised by the reported method.24 The solutions were further diluted
quanti-tatively according to their linearity range. A 50 μg mL-1 solution of
vanadium was prepared by dissolving 12 mg of sodium metavandate in few drops of dilute HCl and diluting the solution to 100 mL with water. A 500 μg mL-1 solution of eriochrome cyanine R was
prepa-red by dissolving 50 mg in 100 mL of water. An acetic acid/sodium acetate buffer (0.02M) of pH 5.0 was prepared by dissolving suitable quantity in water.
Preparation of tablet/capsule sample solution
Twenty tablets of each drug was weighed, powdered and mixed thoroughly. A quantity equivalent to 10 mg of each drug was trans-ferred to 100 mL volumetric lask. The drugs were dissolved in water, shaken well, and made up to the volume with water. The resultant solutions were iltered, further diluted according to their linearity range and analysed as described under the analytical procedure. Recommended analytical procedure
Accurately measured suitable volume of LD and MD were transferred from stock solution to 10 mL volumetric lasks, which could be diluted quantitatively to obtain 0.028-0.84 and 0.099-0.993 μg mL-1, respectively. To each lask containing drugs in the order
Nagaraja et al.
374 Quim. Nova
solutions were swirled and allowed to stand for 45 min. The absor-bances were measured at 565 nm against the blank containing all the reagents mentioned above except drugs.
RESULTS AND DISCUSSION
Spectral characteristic
The absorption spectra of the reaction product were measured at 565 nm against the blank solutions. The method is based on reduction vanadium (V) by the drugs to vanadium (IV), which formed complex with ECR. An attempt to form a ternary complex by adding cationic surfactant such as CTAB was not successful because the violet color so formed was not stable. The reaction was carried out at room temperature. The absorption spectra of the colored products are shown in Figure 1.
Optimum reaction condition
By varying one and keeping other experimental parameters and the amount of drug constant, the effect of vanadium (V), ECR and buffer were studied. Maximum colour intensity was obtained when 1.5 mL of vanadium, 3.0 mL of ECR were added. The effect of buffer was studied using acetic acid/sodium acetate buffer of different pH and maximum absorbance was observed at pH 5.0. The effect of pH for LD in the reaction is shown in Figure 2. The sensitivity was found to be enhanced when the reaction was allowed to be complete in 45 min at room temperature. Attempt to use other metal ions such as Al+3, Ce+4, Cu+2, Fe+3 and Zn+2 was
not successful as the blank itself produced colored product.
Validation of the proposed method
Linearity, detection and quantiication limit
Calibration graphs were constructed using standard solutions under optimum experimental condition. A linear relationship was observed between the absorbance and concentration of drugs from 0.028-0.84 and 0.099-0.993 μg mL-1, respectively LD and MD,
res-pectively. The molar absorptivity and sandell’s sensitivity for each drug were calculated from beer’s law. The ringbom plots demonstrated the optimum range of concentration of 0.03-0.84 and 0.11-0.97 μg mL-1 for LD and MD, respectively by the proposed method. The
graph showed a negligible intercept, which was calculated by the least-square method’s regression equation:
Y = a + bc
where, Y is the absorbance of solution in a 1 cm cell, a is the in-tercept, b is the slope, and c is the concentration of the measured solution in μg mL-1. The conidence limits for the slope of line of
regression and the intercept were computed using the relation, b ± tSb and a ± tSa at 95% conidence level. The limit of detection (LOD) and the limit of quantiication (LOQ) value were determined using the formula
LOD or LOQ = Κ SD/b
where Κ = 3 for LOD and 10 for LOQ, SD and b stand for standard deviation of the intercept and slope, respectively. The LOD was 6.6 x 10⁻³ and 26 x 10-3 μg mL-1. Similarly, LOQ was found to be 0.022
and 0.087 μg mL-1. The high correlation coeficients indicate the
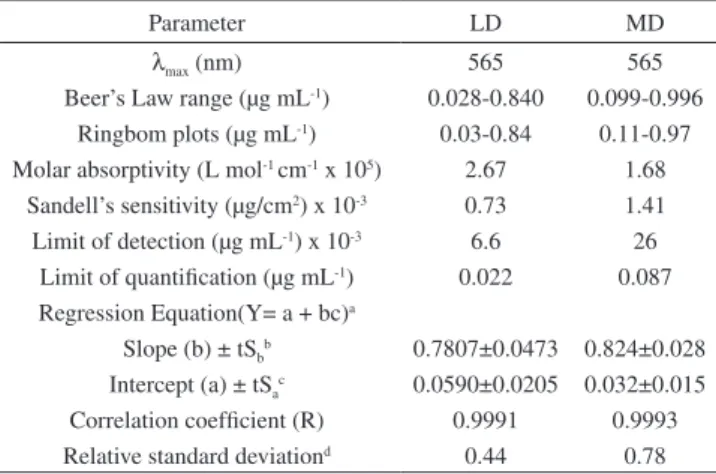
excellent linearity. Repeatability and level of precision was tested by analyzing 6 replicate samples and was found to be adequate for quantiication of drugs as shown by their relative standard deviation. The optical characteristic is given in Table 1.
The error (Sc) in the determination of a given concentration of drugs was deined by the expression where,
Figure 1. Absorbance spectra of LD (0.45 μg mL-1) and MD (0.35 μg mL-1)
Figure 2. Effect of pH in the absorbance of LD at 0.56 μg mL-1
Table 1. Optical characteristics and statistical data of the regression analysis
Parameter LD MD
λ
max (nm) 565 565
Beer’s Law range (μg mL-1) 0.028-0.840 0.099-0.996
Ringbom plots (μg mL-1) 0.03-0.84 0.11-0.97
Molar absorptivity (L mol-1 cm-1 x 10⁵) 2.67 1.68
Sandell’s sensitivity (μg/cm2) x 10-3 0.73 1.41
Limit of detection (μg mL-1) x 10-3 6.6 26
Limit of quantiication (μg mL-1) 0.022 0.087
Regression Equation(Y= a + bc)a
Slope (b) ± tSb
b 0.7807±0.0473 0.824±0.028
Intercept (a) ± tSa
c 0.0590±0.0205 0.032±0.015
Correlation coeficient (R) 0.9991 0.9993 Relative standard deviationd 0.44 0.78 aY = a + bc, where c is the concentration of the measured solution in μg mL-1
and Y is the absorbance unit. bConidence interval for slope at 95% conidence
limit for 6 degree of freedom. cConidence interval for intercept at 95%
coni-dence limit 6 degree of freedom. dAverage of 6 determinations (concentrations
Spectrophotometric determination of catecholamine 375
Vol. 34, No. 3
—
y and —x are the average values of the absorbance and concentration, respectively, for n standard samples. The graph shows that the error is reached minimum when absorbance corresponding to about 0.4 and 0.52 μg mL-1 of LD and MD, respectively, when the actual
ab-sorbance is equal to the average abab-sorbance. The plots of error, Sc vs. concentration of drugs are shown in Figure 3.
Interference studies
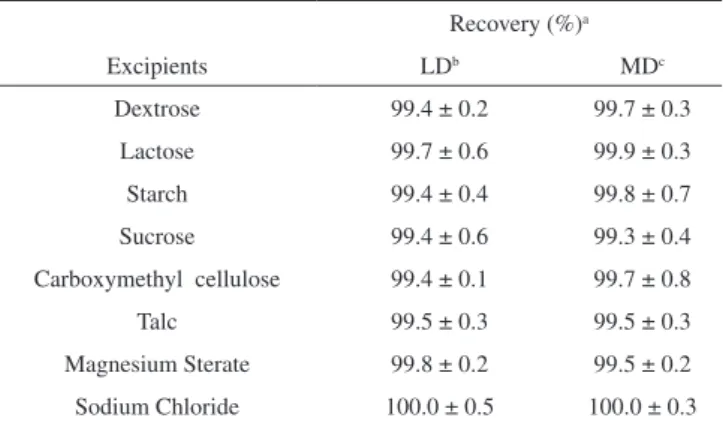
The effect of common excipients used in the pharmaceutical preparation were studied by analyzing synthetic sample solutions containing the quantity of drugs as mentioned in Table 2 in presence of 100 fold more concentration of each excipients. The tolerance limit was deined as the concentration which gave an error of ± 3.0% in the determination of drugs. The common excipients such as sodium chloride, starch, dextrose, lactose, talc, carboxymethyl cellulose, magnesium stearate, sucrose, had no effect in the analysis.
Precision studies
The short term precision (intraday precision) of the drugs were evaluated by measuring 5 independent samples at 3 different con-centration levels (0.14, 0.28, 0.56 μg mL-1 for LD and 0.50, 0.62
and 0.74 μg mL-1 for MD. Similarly, the assay for daily precision
(interday precision) at the same concentration level was repeated for 5 consecutive days (Table 3). The relative standard deviation ranged between 0.3-0.6 and 0.5-0.9 for LD and MD, respectively. The values of relative standard deviation can be considered to be satisfactory for the routine determination of the drugs.
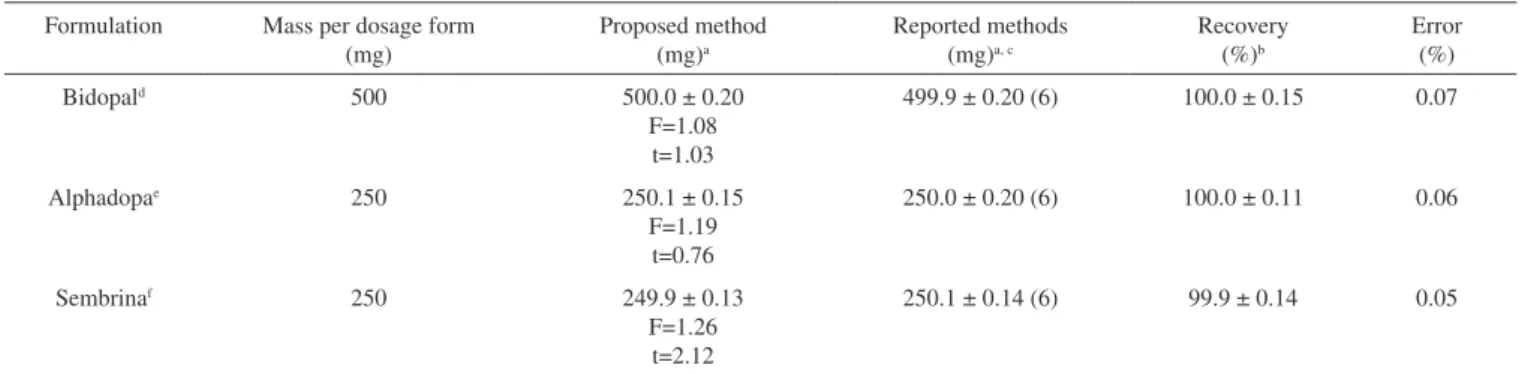
The available pharmaceutical dosage forms of the investigated drugs wereanalysed by the proposed method. The precision of the method was checked by taking 6 replicate measurements.The results obtained by the proposed and the reference methods for the dosage forms were compared statistically.
Student’s t- value ≤ 2.44 for pharmaceutical samples at the 95% conidence limit indicate insigniicant difference between the found and true contents of the test. Analytical results measured for the same pharmaceuticals by the proposed method and reference method were compared using F-test. The F-values ≤ 5.05 thus obtained indicate insigniicant difference in precision between both methods at 95% conidence limit. The standard deviation ranged between 0.15-0.20. The reliability and accuracy of the proposed method were further ascertained through recovery studies using the standard addition method by adding different amount of standard drugs to the pre-analyzed dosage forms such that the cumulative amount after adding the drugs did not exceed their linearity range. The mean percentage recoveries, relative to the labeled amounts ranged from 99.9±0.14 to 100.0±0.11 (Table 4).
CONCLUSION
We have proposed a new spectrophotometric method for the determination of catecholamine drugs, which is fairly sensitive, simple, and economical with reasonable precision and accuracy. The optical parameters and statistical comparison justify this method for application in routine drug estimation in pure and dosage forms. Also, the procedures do not involve any critical reaction conditions or tedious sample preparation steps. So, the recommended method is well suited for the assay and evaluation of drugs in pharmaceutical preparation and can also be considered as a general method for the quantiication of listed catecholamine drugs.
ACKNOWLEDGMENTS
One of the authors A. K. Shrestha thanks the Jawaharlal Nehru Memorial Fund, India (Ref: SU/2/552/2008-09/760) for providing scholarship and University of Mysore for providing facilities for the investigation.
Table 2. Recovery of drugs from solution with a 100-fold excess of various additives* used as excipients
Recovery (%)a
Excipients LDb MDc
Dextrose 99.4 ± 0.2 99.7 ± 0.3 Lactose 99.7 ± 0.6 99.9 ± 0.3 Starch 99.4 ± 0.4 99.8 ± 0.7 Sucrose 99.4 ± 0.6 99.3 ± 0.4 Carboxymethyl cellulose 99.4 ± 0.1 99.7 ± 0.8 Talc 99.5 ± 0.3 99.5 ± 0.3 Magnesium Sterate 99.8 ± 0.2 99.5 ± 0.2 Sodium Chloride 100.0 ± 0.5 100.0 ± 0.3
a Mean ± R.S.D n = 3. b Concentration of LD used- 0.28 μg mL-1. c
Concentra-tion of MD used- 0.5 μg mL-1
Table 3. Intra-day and Inter-day precision data Concentration taken
(μg mL-1)
Intra-day Recoverya
Inter-day Recoveryb
0.14 0.14 ± 0.6 0.14 ± 0.9 LD 0.28 0.28 ± 0.3 0.28 ± 0.5 0.56 0.56 ± 0.4 0.56 ± 0.7 0.50 0.5 ± 0.7 0.5 ± 0.8 MD 0.62 0.62 ± 0.5 0.62 ± 0.6 0.74 0.74 ± 0.5 0.74 ± 0.8
a Mean ± R.S.D n= 5. b Mean ± R. S.D n= 5, performed over a period of 5 days
Nagaraja et al.
376 Quim. Nova
Table 4. Analysis of drugs in pharmaceutical formulations Formulation Mass per dosage form
(mg)
Proposed method (mg)a
Reported methods (mg)a, c
Recovery (%)b
Error (%)
Bidopald 500 500.0 ± 0.20
F=1.08 t=1.03
499.9 ± 0.20 (6) 100.0 ± 0.15 0.07
Alphadopae 250 250.1 ± 0.15
F=1.19 t=0.76
250.0 ± 0.20 (6) 100.0 ± 0.11 0.06
Sembrinaf 250 249.9 ± 0.13
F=1.26 t=2.12
250.1 ± 0.14 (6) 99.9 ± 0.14 0.05
a Mean ± S.D n = 6; the t- and F- values obtained after comparison to the reference methods have following theoretical values at 95% conidence limit; t = 2.44
F= 5.05. b Mean ± R.S.D n = 6 after adding 4 different amounts of pure drugs to a ixed concentration of pre-analysed pharmaceutical formulations. c Numbers
inside the bracket indicates reference number of the reported methods. d LD equivalent to 500 mg/tablet (GSK, India). e MD equivalent to 250 mg/ tablet (Merind
Ltd, India). f MD equivalent to 10 mg/tablet (Aventis, India)
REFERENCES
1. Rang, H. P.; Dale, M. M.; Ritter, J. M.; Pharmacology, 3rd ed., Churchill
Livingstone: Edinburg, 1995, chap. 25. 2. In ref. 1, chap. 21.
3. Gilman, A. G. In The pharmacological Basis of Therapeutics; Hardman, J. G.; Limbird, L. L., eds.; McGraw-Hill: New York, 10th ed., 2001,
chap. 33.
4. Lv, L.; Jiang, W.; Zhou, S.; Huang, X.; Shi, X.; Lv, C.; Wu, L.; Xu, C.;
Chromatographia2010, 72, 239.
5. Alam, S. M.; Karim, M. M.; Lee, S. H.; Wabaidur, S. M.; Chung, H. Y.; Choi, J. H.; Kang, M.; Luminescence2008, 23, 327.
6. Li, S. F.; Wu, H. L.; Yu, Y. J.; Li, Y. N.; Nie, J. F.; Fu, H. Y.; Yu, R. Q.;
Talanta2010, 81, 805.
7. Teixeira, M. F. S.; Bergamini, M. F.; Marques, C. M. P.; Bocchi, N.;
Talanta 2004, 63, 1083.
8. Modi, K. P.; Patel, N. M.; Goyal, R. K.; Chem. Pharm. Bull.2008, 56, 357.
9. Talebpour, Z.; Haghgoo, S.; Shamsipur, M.; Anal. Chim. Acta2004, 506, 97.
10. Oliveira, C. H.; Barrientos-Astigarraga, R. E.; Sucupira, M.; Graudenz, G. S.; Muscará, M. N.; Nucci, G. D.; J. Chromatogr., B: Anal. Technol.
Biomed. Life Sci. 2002,768, 341.
11. Vieira, I. C.; Fatibello-Filho, O.; Talanta1998, 46, 559.
12. Aman, T.; Khan, I. U.; Aslam, N.; Ahmad, I.; Anal. Lett.1998, 31, 1007. 13. Chamsaz, M.; Safavi, A.; Fadaee, J.; Anal. Chim. Acta2007, 603, 140. 14. Nagaraja, P.; Vasantha, R. A.; Sunitha, K. R. J.; Pharm.Biomed. Anal.
2001, 25, 417.
15. Nagaraja, P.; Vasantha, R. A.; Sunitha, K. R.; Talanta2001, 55, 1039. 16. Gowda, B. G.; Melwanki, M. B.; Seetharamappa, J.; Anal. Sci.2001, 17,
533.
17. Madrakian, T.; Afkhami, A.; Khalai, L.; Mohammadnejad, M.; J. Braz.
Chem. Soc.2006, 17, 1259.
18. Nagaraja, P.; Murthy, K.C.S.; Rangappa, K. S.; Gowda, N.M. M.;
Talanta1998, 46, 39.
19. El-Kommos, M. E.; Mohamed, F. A; Khedr, A. S.; J. Assoc. Off. Anal. Chem. 1990, 73, 5167.
20. Safavi, A.; Tohidi, M.; J. Pharm. Biomed. Anal.2007, 44, 313. 21. Li, S. Y.; Ren, Y. Z.; Zhao, F. L.; Chin. Chem. Lett.2006, 17, 1065. 22. Guo, L.; Zhang, Y.; Lia, Q. M.; J. Chin. Chem. Soc. 2009, 56, 568. 23. El-Dien, F. A. N.; Zayed, M. A.; Mohamed, G. G.; El-Nahas, R. G.; J.
Biomed. Biotechnol.2005, 1, 1.
24. United State Pharmacopoeia; 23/NF, 18, United State pharmacopoeial