www.biogeosciences.net/9/4589/2012/ doi:10.5194/bg-9-4589-2012
© Author(s) 2012. CC Attribution 3.0 License.
Biogeosciences
Light and temperature effects on
δ
11
B and B / Ca ratios of the
zooxanthellate coral
Acropora
sp.: results from culturing
experiments
D. Dissard1,2, E. Douville1, S. Reynaud3, A. Juillet-Leclerc1, P. Montagna4, P. Louvat5, and M. McCulloch2
1Laboratoire des Sciences du Climat et de l’Environnement, UMR8212, UVSQ-CNRS-CEA, LSCE/IPSL, Av. de la Terrasse,
91198 Gif sur Yvette, France
2School of Earth and Environment, The University of Western Australia, 35 Stirling Highway Crawley WA 6009,
Perth, Australia
3Centre Scientifique de Monaco, Avenue Saint-Martin, MC 98000, Monaco
4Institute of Marine Sciences – National Research Council, ISMAR-CNR, Via Gobetti 101 40129 Bologna, Italy 5Institut de Physique du Globe de Paris, Sorbonne Paris Cit´e, Universit´e Paris-Diderot, UMR7154, CNRS, 1 rue Jussieu,
75238 Paris, France
Correspondence to:D. Dissard ([email protected])
Received: 26 April 2012 – Published in Biogeosciences Discuss.: 25 May 2012
Revised: 16 October 2012 – Accepted: 18 October 2012 – Published: 20 November 2012
Abstract.The boron isotopic composition (δ11B) of marine carbonates (e.g. corals) is increasingly utilised as a proxy for paleo-pH, with the strong correlation between δ11B of marine calcifiers and seawater pH now well documented. However, the potential roles of other environmental param-eters that may also influence both the boron isotopic com-position and boron concentration into coral aragonite are poorly known. To overcome this, the tropical scleractinian coralAcroporasp. was cultured under 3 different tempera-tures (22, 25 and 28◦C) and two light conditions (200 and 400 µmol photon m−2s−1). Theδ11B indicates an increase in internal pH that is dependent on the light conditions. Changes in light intensities from 200 to 400 µmol photon m−2s−1
seem to indicate an apparent decrease in pH at the site of calcification, contrary to what is expected in most models of light-enhanced calcification. Thus, variations in light condi-tions chosen to mimic average annual variacondi-tions of the natu-ral environments whereAcroporasp. colonies can be found could bias pH reconstructions by about 0.05 units. For both light conditions, a significant impact of temperature onδ11B can be observed between 22 and 25◦C, corresponding to an increase of about 0.02 pH-units, while no furtherδ11B in-crease can be observed from 25 to 28◦C. This non-linear temperature effect complicates the determination of a
cor-rection factor. B / Ca ratios decrease with increasing light, consistent with the decrease in pH at the site of calcifica-tion under enhanced light intensities. When all the other pa-rameters are constant, boron concentrations inAcroporasp. increase with increasing temperatures and increasing carbon-ate ion concentrations. These observations contradict previ-ous studies where B / Ca in corals was found to vary inversely with temperature, suggesting that the controlling factors driv-ing boron concentrations have not yet been adequately iden-tified and might be influenced by other environmental vari-ables and/or species-specific responses.
1 Introduction
Increased atmospheric CO2 concentrations from 280
(pre-industrial values) to 390 ppmv (2010) have decreased sur-face ocean pH by approximately 0.1 unit (Orr et al., 2005). Estimates of future atmospheric pCO2, as summarised in
([CO23−]) and pH provides crucial insights into the ocean’s role in regulating the global carbon cycle. However, unlike other key climatic indices such as temperature and salinity, seawater pH has, until recently, seldom been recorded in ma-rine observations, and hence the need for a reliable proxy record to increase the accuracy of reconstructing long-term changes in seawater pH. The boron isotopic composition (δ11B) of marine carbonates has been established as a proxy for paleo-pH (e.g. Spivack et al., 1993; Palmer and Pear-son, 2003; Pelejero et al., 2005; H¨onisch et al., 2007, 2008, 2009; Wei et al., 2009; Douville et al., 2010), with its relia-bility recently validated by species-specific calibrations (e.g. Trotter et al., 2011).
Boron dissolved in seawater is mainly present in the form of boric acid (B(OH)3)and borate ion (B(OH)−4)and their
relative abundance is strongly pH dependent (Hershey et al., 1986). Because of the isotopic equilibrium fractionation between the two aqueous boron species, the isotopic compo-sitions of boric acid and borate ion are also pH dependent. Based on the observation that modern marine carbonates re-flect the isotopic composition of borate, Hemming and Han-son (1992) proposed the following mechanism for boron sub-stitution in the CO23−site in carbonate:
CaCO3+B(OH)−4 = Ca(HBO3)+HCO−3 +H2O. (R1)
The pKBvalue (stoichiometric equilibrium constant between
B(OH)3 and B(OH)−4 in seawater) determined by
Dick-son (1990) has been confirmed by Roy et al. (1993). The frac-tionation factor (α)between the two aqueous boron species has been a subject of much debate (Zeebe et al., 2005). Recently, using a spectrophotometric approach, Klochko et al. (2006) determined that α in seawater has a value of 1.0272±0.0006 (Salinity = 35, BoronTotal= 0.01 mol kg−1). One caveat in the use of boron isotope-pH proxy might be the potential incorporation of significant concentrations of seawater boric acid into biogenic calcium carbonate instead of only borate. This assumption was recently raised by two NMR studies, which measured proportions of trigonally co-ordinated boron in coral aragonite varying from 12 to 48 % (Klochko et al., 2009; Rollion-Bard et al., 2011). However, NMR technique cannot distinguish between boric acid di-rectly incorporated from solution or derived from borate ion during adsorption and incorporation into boron-carbonate. Recently, Tossell et al. (2005) and Klochko et al. (2009) have pointed out the possibility of a “chemosorption stage” where B(OH)CO−3 isomers may form on the surface before break-ing down into either BO3or BO4in natural carbonates. In
turn, this may result in internal boron isotope redistribution, which would allow both BO3 and BO4 to be incorporated
while preserving the internal (site of calcification)δ11B iso-topic composition. In addition, because the incorporation of seawater boric acid would shift the boron isotopic composi-tion of coral skeletons to considerably higher values (Mc-Culloch et al., 2012), it appears unlikely that the trigonal
B(OH)−3 species detected in calcite and aragonite is directly derived from seawater.
The biologically-mediated pH regulation at the site of calcification, via seawater isolation and active modification, likely superimposes a biological regulation and accounts for the observed species-specific isotopic signatures (Trotter et al., 2011).
So far, no light effect has been reported to impact boron isotopic composition on aragonitic corals (H¨onisch et al., 2004). However, variations in light are known to impact symbiont algae photosynthesis and calcification rate (Dubin-ski et al., 1983; Gattuso et al., 1999, Reynaud et al., 2004; Juillet-Leclerc et al., 2012), which in turn might significantly impact the calcification micro-environment and therewith the B isotopic composition. This highlights the need for species-specific calibrations in order to better understand the control-ling factors ofδ11B in biogenic carbonates.
Alternatively, the recognition of the importance to perform accurate pH reconstruction has warranted the use of a multi-proxy approach to resolve past deep-water [CO23−]. Recently, Yu and Elderfield (2007) and Yu et al., (2007) proposed that the B / Ca ratio in foraminiferal calcite can be use as a proxy for seawater [CO23−]. The basic assumption behind this proxy is that the B / Ca ratio in foraminifera is a function of the ratio of [B(OH)−4 / HCO−3] in seawater, with the later being pH dependent. Although recent studies tend to confirm that seawater carbonate chemistry is the dominant environmen-tal parameter controlling B / Ca ratios into foraminiferal cal-cite (while temperature appears to be only a secondary fac-tor, Foster, 2008; Yu et al., 2010), no similar assumptions can be made at present for aragonitic corals. On the contrary, several studies have reported that the B / Ca ratio in tropi-cal and temperate corals can be robust at documenting SST variations in certain locations (e.g. Hart and Cohen, 1996; Sinclair et al., 1998; Fallon et al., 1999; 2003; Montagna et al., 2007). Nevertheless, after measuring B concentrations in tropical Poritessp. coral cores from the Great Barrier Reef, Fallon et al. (2003) concluded that coral B / Ca ratio had to be influenced by factors other than temperature. Further inves-tigations are therefore needed in order to better understand the parameters regulating the boron concentration into coral aragonite.
In this study, we present the boron isotopic composition (δ11B) and the elemental ratio (B / Ca) measured on the zoox-anthellate coralAcroporasp., cultured under three different temperature conditions (22, 25 and 28◦C) and two light in-tensities (200 and 400 µmol photon m−2s−1), corresponding
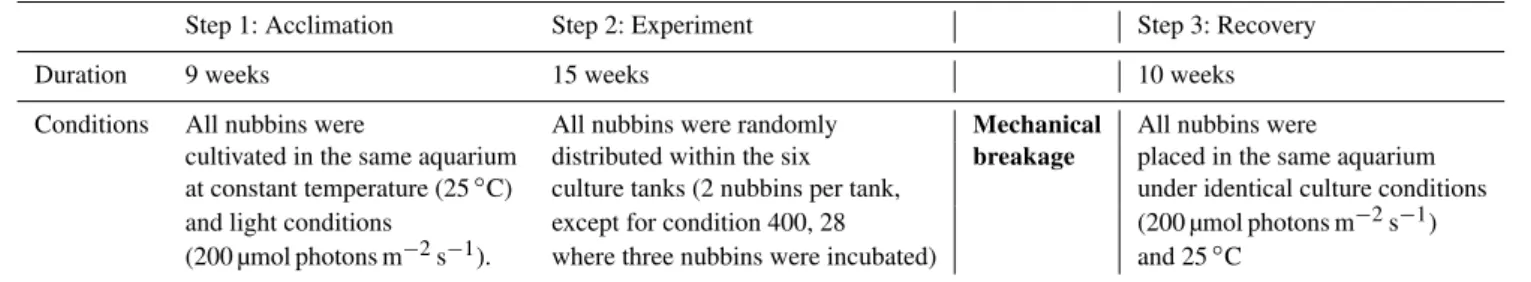
Table 1.Description of the three steps of the culture protocol.
Step 1: Acclimation Step 2: Experiment Step 3: Recovery
Duration 9 weeks 15 weeks 10 weeks
Conditions All nubbins were All nubbins were randomly Mechanical All nubbins were
cultivated in the same aquarium distributed within the six breakage placed in the same aquarium at constant temperature (25◦C) culture tanks (2 nubbins per tank, under identical culture conditions and light conditions except for condition 400, 28 (200 µmol photons m−2s−1) (200 µmol photons m−2s−1). where three nubbins were incubated) and 25◦C
2 Material and method
2.1 Experimental protocol
The culturing experiment was performed at the Scientific Centre of Monaco (CSM). The tropical branching zooxan-thellate coralAcroporasp. was chosen for its strong aptitude to grow under culture condition and its large representation throughout the world coral communities.
The culture experiment was conducted following a three step protocol (see Table 1). Step 1: all the nubbins were cultivated in the same aquarium at constant temperature (25◦C) and light conditions (200 µmol photons m−2s−1). This step lasted for 9 weeks and is considered as the accli-mation period. Step 2: the nubbins were subsequently ran-domly distributed within six tanks under six different con-ditions (200, 22; 200, 25; 200, 28; 400, 22; 400, 25 and 400, 28), where the first number indicates the light inten-sity (µmol photons m−2s−1)and the second one the
tem-perature (◦C) (two nubbins per tank, except for condition 400, 28, where three nubbins were maintained in culture). This second step, which is considered as the experiment itself, lasted for 15 weeks. At the end of step 2, all the newly precipitated aragonite forming a ring on the slide (lateral growth) was carefully collected with a scalpel, and all nubbins were placed under identical culture conditions (200 µmol photons m−2s−1, 25◦C) for step 3. This ensured the secretion of new skeleton through identical biological regulation (same organism) but allowed differentiation of aragonite precipitated during step 2 from step 3. Step 3 is re-ferred to as “recovery period” in the following sections and lasted for ten additional weeks.
2.2 Experimental setup
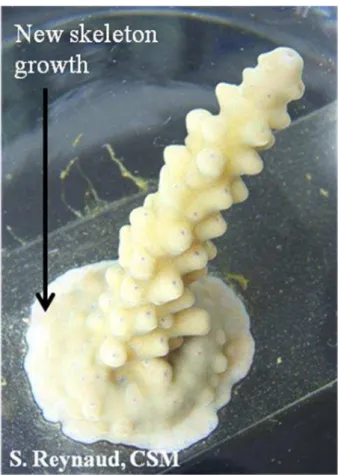
Culture experiments were conducted using the culturing setup and protocol described by Reynaud et al. (1999), in which tips, sampled from a single parent colony, were ad-hered onto slides (2.6×6×0.2 cm, see Fig. 1) using under-water epoxy (Devcon), and randomly distributed in incuba-tion tanks (30 l). At the end of step 1, the skeleton was only present until the limit of the glue, but never on the surface of the slide. Nubbins were then subsequently randomly dis-tributed within the six culture tanks. At the completion of
step 2, only the ring skeleton deposited on the slide was removed with a scalpel, dried overnight at room tempera-ture, and stored in containers pending geochemical analy-ses. By sampling only the material covering the slide, this method allows easy collection of newly formed aragonite, ensuring it was precipitated under the targeted culture con-ditions. The experimental tanks were continuously supplied with Mediterranean seawater (salinity≈38) pumped from 55 m depth (Rena pump, 6 l min−1)and maintained under
ambientpCO2(pCO2≈390 ppm) prior to flowing into the
Fig. 1.Normal light picture ofAcroporasp. tip adhered onto slides using underwater epoxy. (Slide width = 2.6 cm).
2.3 Metabolic measurements
Nubbins glued onto slides could not fit in the incubating chamber; therefore, all metabolic measurements such as res-piration, photosynthesis, and calcification rate were con-ducted simultaneously on small fragments, from the same parent colony, hung on nylon wire (Al-Moghrabi et al., 1993) and cultured in the same culture tank as their associated nub-bin (Table 3).
Photosynthesis and respiration were measured once a month using the respirometry technique, which consists of monitoring the changes in oxygen concentration during in-cubation time (Griffith et al., 1987). Each fragment of coral hung on nylon wire was placed in a respirometric cham-ber (50 ml) filled with seawater for 20 min and exposed to light intensity corresponding to the culture conditions. The nubbins were subsequently placed in the dark for 20 min to measure the respiration rate and then returned to the cul-ture aquarium. The medium was continuously agitated dur-ing measurements usdur-ing a magnetic stirrer, and replaced af-ter each incubation. The respirometric chamber was ther-mostated to be kept at constant temperature. All incubations took place between 08:00 and 14:00 LT. Oxygen
concentra-Table 2.Mean temperature (◦C), ALK (µeq kg−1), pH (total scale) and salinity of the culture media, measured during step 2 of the experiment. Measurements performed in culture tank submitted to HL (high light) and LL (low light) conditions were averaged and are presented under a single value per temperature conditions.
Temperature ALK pH Salinity
(◦C) (µeq kg−1) (total scale)
Mean value 22 2537.67 8.03 38
SD ±0.1 ±3.06 ±0.02 ±0.1
Mean value 25 2536.5 8.02 38
SD ±0.1 ±5.92 ±0.01 ±0.1
Mean value 28 2536 8 38
SD ±0.1 ±6.12 ±0.01 ±0.1
tion was monitored in the chamber using an oxygen electrode (Strathkelvin 928) calibrated daily against air-saturated sea-water (100 %) and a nitrogen bubbler (zero oxygen). Rates of net photosynthesis and respiration were estimated using a linear regression of O2against time. Photosynthesis and
res-piration values were then normalized to the skeletal surface area estimated using the wax technique (Simson and Ken-zie, 1991). In order to determine calcification rates, corals were weighed once a week using the buoyant weight tech-nique (Jokiel et al., 1978; Davies, 1989). Calcification rates were calculated using the following formula (Reynaud et al., 2002):
G = n
s
Pn
P0
−1, (1)
whereGis the calcification rate,nis the number of the cul-ture days,Pn is the dry weight after 15 days of culture and
P0is the initial dry weight.
2.4 Geochemical measurements
For each experimental condition, elemental and isotopic measurements were performed on two replicates of separate coral nubbins incubated in the same culture conditions, ex-cept for condition 400, 28, where values presented are the average of three replicates.
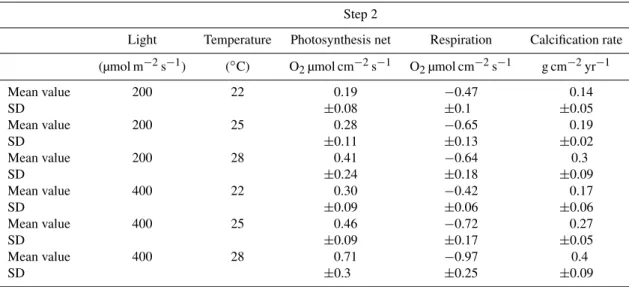
Table 3.Mean value and standard deviation of photosynthesis (Pnet, O2µmol cm−2s−1), respiration (R, O2µmol cm−2s−1), and calcifica-tion rate (g cm−2yr−1)at the end of step 2. Net photosynthesis and respiration are normalized relative to the colony’s surface.
Step 2
Light Temperature Photosynthesis net Respiration Calcification rate
(µmol m−2s−1) (◦C) O2µmol cm−2s−1 O2µmol cm−2s−1 g cm−2yr−1
Mean value 200 22 0.19 −0.47 0.14
SD ±0.08 ±0.1 ±0.05
Mean value 200 25 0.28 −0.65 0.19
SD ±0.11 ±0.13 ±0.02
Mean value 200 28 0.41 −0.64 0.3
SD ±0.24 ±0.18 ±0.09
Mean value 400 22 0.30 −0.42 0.17
SD ±0.09 ±0.06 ±0.06
Mean value 400 25 0.46 −0.72 0.27
SD ±0.09 ±0.17 ±0.05
Mean value 400 28 0.71 −0.97 0.4
SD ±0.3 ±0.25 ±0.09
2.4.1 Boron isotope measurements
The boron isotopic composition was measured using a dou-ble focusing sector-field multi-collector-inductively coupled plasma mass spectrometer (ThermoScientific Neptune) at the Institut de Physique du Globe de Paris (IPGP, France), fol-lowing the protocol described by Douville et al. (2010) that includes chemical separation of boron before its measure-ment (Table 4). The total quantity of material considered was 55 mg of powdered aragonite per samples. Direct injection high efficiency nebuliser (d-DIHEN) was used for sample in-troduction (Louvat et al., 2011). The direct injection tech-nique allowed a strong reduction of the analytical blank con-tribution on isotope composition (lower than 0.5 ‰ of the sample signal for each isotope). Instrumental mass fractiona-tion and drift of the11B /10B ratio with time was corrected by standard-sample-standard bracketing. Each sample was mea-sured three times successively, with resulting relative stan-dard deviation being systematically in agreement with the ex-ternal reproducibility of 0.25 ‰ (2σ )deduced from repeated analyses of boric acid standard NBS-951 and North Atlantic Seawater Standard NASS-V (Louvat et al., 2011; Douville et al., 2010). Meanδ11B values measured on standards chemi-cally prepared by following identical procedures to those ap-plied to samples were 39.53±0.11 ‰, 24.42±0.10 ‰ and 0.14±0.20 ‰ at 2σ for NASS-V, JCp-1 and NBS 981, re-spectively. These isotopic compositions are well comparable with the recently published values of Foster et al. (2010) and Wang et al. (2010).
2.4.2 Boron concentrations
B / Ca concentrations were determined using quadrupole ICP-MS XseriesII(Thermo Fisher Scientific) at the
Labora-toire des Sciences du Climat et de l’Environnement (LSCE, France; Table 4). Analyses were calibrated against carbon-ate standards JCp-1 (coral), JCt-1 (clam) and Aragonite AK. Sample and standard solutions were systematically adjusted to 100 ppm Ca through dilution in order to (1) avoid domi-nant Ca signal increasing salt deposition on cones and affect-ing therewith ICP-MS stability, and (2) adjust the Ca concen-trations being introduced in the ICP-QMS, allowing control of Ca matrix effects on trace elements analysis (Harding et al., 2006; Bourdin et al., 2011). To monitor and correct for instrumental drift, standards JCp-1 and JCt-1, and Aragonite AK were analysed every five and ten samples, respectively. Instrumental calibration was achieved using standard solu-tion for each element and by routinely measuring carbon-ate standards (JCp-1, JCt-1 and Aragonite. AK.). When con-sidering repetitive B / Ca measurements of the JCp-1 stan-dard, analytical uncertainties were calculated to be 3 % at 2σ
(Douville et al., 2010), with a mean value of 459 µmol mol−1.
These results are in good agreement with the previously pub-lished value of Okai et al. (2004).
3 Results
3.1 Metabolic measurements
Table 4.δ11B (‰) and B / Ca (µmol mol−1) measured at the end of steps 2 and 3. For step 2 values represent mean calculation of mea-surements performed on 2 replicates per experimental condition, with the exception of condition 400 µmol m−2s−1and 28◦C where 3 replicates were considered. SD represents the combined standard deviation calculated based on the analytical uncertainty and the difference between the separate replicates. Due to sample size limitation, values presented for step 3 are based on a single sample per experimental condition; here SD represents only the analytical uncertainty. Reconstructed pH at the site of calcification using the boron isotope values and the fractionation factor determined by Klochko et al. (2006):α= 1.0272±0.0006 (δ11Bseawater= 39.61 ‰, BT = 416.0 µM andT=22◦C, 25◦C and 28◦C).
Step 2
Light Temperature δ11B Averageδ11B B / Ca Average B / Ca δ11B derived pH (µmol m−2s−1) (◦C) (‰) per exp. conditions (µmol mol−1) per exp. conditions site of calcification
(‰) (µmol mol) (total scale)
Mean value 200 22 21.87 22.16 458 460 8.39
22.46 ±0.40 461 ±9
Mean value 200 25 23.25 23.1 480 485 8.42
22.95 ±0.26 491 ±11
Mean value 200 28 23.62 23.19 515 512 8.39
22.76 ±0.56 510 ±10
Mean value 400 22 21.90 21.76 458 455 8.36
21.62 ±0.25 452 ±10
Mean value 400 25 22.21 22.5 473 478 8.38
22.78 ±0.39 483 ±11
Mean value 400 28 22.50 22.67 498 487 8.35
22.89 ±0.26 480 ±13
22.61 484
Step 3
Mean value 200 22 20.93 436 8.27
±0.25 ±13
Mean value 200 25 20.07 442 8.2
±0.25 ±13
Mean value 200 28 n.a. n.a.
Mean value 400 22 21.55; 21.73 443; 449 8.33; 8.31
±0.25 ±13
Mean value 400 25 20.46 416 8.23
±0.25 ±13
Mean value 400 28 n.a. n.a.
The increase in both temperature and light induces an en-hancement of the calcification rate. A linear increase of the calcification rate with temperature is observed under both LL and HL conditions.
Net photosynthesis was significantly influenced by light and temperature (ANOVA, P =0.004 and P =0.001, re-spectively), with no interaction between the two factors (ANOVA,P =0.4). For the three temperatures considered in this study (22, 25 and 28◦C), photosynthesis rates are always significantly higher under HL compared to LL conditions.
Although results appear less straightforward, respiration rates were also affected by light and temperature (ANOVA,
P =0.0050 and P <0.00001, respectively), with an inter-action between the two parameters (P =0.0012). Under HL conditions, a linear increase of the respiration rate is ob-served with increasing temperatures. Under LL conditions, an increase is observed between 22 and 25◦C. No further enhancement is observed between 25 and 28◦C. While no
significant change is observed at 22◦C between the different light conditions, increase in light induces an enhancement of the respiration rate at 25 and 28◦C. As previously observed for the calcification rate, the impact of light on both photo-synthesis and respiration rates increases with increasing tem-peratures.
3.2 Boron isotopes measurements
The boron isotope compositions measured on the two repli-cates per experimental conditions (except for condition 400, 28, where three replicates were considered) were averaged for each experimental condition and plotted against temper-ature (Fig. 3). The meanδ11B vary from 21.76 to 23.19 ‰ (T= 22–28◦C, pHT= 8.02±0.02,S= 38±0.1 and light con-ditions: 200–400 µmol photons m−2s−1, Table 4).
μmol cm μmol cm
Fig. 2. Mean respiration (O2µmol cm−2s−1), photosynthesis (O2µmol cm−2s−1)and calcification (% day−1)rates measured per experimental conditions and plotted vs. temperature (error bars represent SD).
light (2-way ANOVA F1,9=8.46, p=0.0173, see
Ta-ble 5). With increasing light intensities from 200 to 400 µmol photons m−2s−1, boron isotope compositions
mea-sured in our study show a decrease of 0.4, 0.6 and 0.5 ‰ for 22, 25 and 28◦C, respectively (Table 4). These decreases can be considered statistically similar for each temperature con-dition (Table 5).
Boron isotope compositions show a significant in-crease with increasing temperatures between 22 and 25◦C for both light conditions (SCHEFFE test 22–25◦C, p= −0.0671, Table 5). Measuredδ11B varied between 22.16± 0.40 ‰ (22◦C) and 23.10±0.26 ‰ (25◦C) under LL, and between 21.76±0.25 ‰ (22◦C) and 22.50±0.39 ‰ (25◦C) under HL conditions (pHT ≈8.02). For tempera-tures between 25 and 28◦C no significant variation of the
δ11B could be observed for any of the light conditions Mean δ B (‰)
μmol temperature (˚C).
Fig. 3. Mean δ11B (‰) measured at the end of step 2 on corals grown under 200 (blue dots) and 400 (green squares) µmol photon m−2s−1, plotted vs. temperature (◦C). Orange crosses represent measurements performed at the end of step 3 (recovery experiment).
(SCHEFFE test 25–28◦C, p=0.650, Table 5). δ11B was
measured to vary from 23.10±0.26 ‰ at 25◦C to 23.19± 0.56 ‰ at 28◦C (at 200 µmol photons m−2s−1) and from
22.50±0.39 ‰ at 25◦C to 22.67±0.26 ‰ at 28◦C (at 400 µmol photons m−2s−1), with pH
T ≈8.02 for both con-ditions.
For clarity, measured boron isotope compositions are plot-ted versus medium pH in Fig. 4. pH at the site of calcification reconstructed fromδ11B values (withα=1.0272±0.0006,
δ11Bseawater= 39.61 ‰ and BT = 416 µM from DOE, 1994) are plotted on the same graph. The difference between medium and reconstructed pH is illustrated by the arrow and referred to as1pH biological control.
Two other studies report on δ11B measured on Acro-pora sp. cultured under similar conditions. H¨onisch et al. (2004) measuredδ11B values ofAcropora nobilisof about 22.9 ‰ (T =27◦C, pH
T= 7.97, and light condition of 300± 15 µmol photons m−2s−1), while Reynaud et al. (2004)
re-portδ11B ofAcroporasp. varying between 24.0 and 23.9 ‰ (T= 25–28◦C, pH
T =8.03−8.05,S=38 and light = 380± 20 µmol photons m−2s−1). For comparison, theδ11B data of Reynaud et al. (2004) and H¨onisch et al. (2004) are plotted vs. pH in Fig. 4. For similar ambientpCO2conditions, boron
Fig. 4. Mean δ11B (‰) measured at the end of step 2 on corals grown under 200 (blue dots) and 400 (green squares) pho-ton m−2s−1, plotted vs. growth medium pH and reconstructed pH at the site of calcification using the fractionation factor deter-mined by Klochko et al. (2006) (α=1.0272±0.0006; borate curve lines forδ11Bseawater=39.61 ‰, BT= 416 µM (DOE, 1994) and T =22◦C (small dashed line),T =25◦C (solid line),T =28◦C (large dashed line)). Black diamond and purple triangles represent values measured by H¨onisch et al. (2004) and Reynaud et al. (2004), respectively. Orange crosses represent meanδ11B (‰) measured at the end of step 3 (recovery experiment) plotted vs. reconstructed site of calcification pH using the fractionation factor determined by Klochko et al. (2006)α=1.0272±0.0006.
(Negative Thermo-Ionization Mass Spectrometry) approach. Therefore, in light of our results it appears that results ob-tained by MC-ICPMS and N-TIMS analytical techniques are comparable and allow accurate and reproducibleδ11B mea-surements of aragonitic corals.
Boron isotope composition measured on nubbins after the end of step 3 (200 µmol photons m−2s−1, 25◦C) displayed strong scattering with lower values varying from 20.07 to 21.73 ‰ (Table 4, Figs. 3 and 4). No straightforward pat-tern of these values with the experimental conditions of step 2 could be observed.
3.3 Elemental concentrations
The mean coral B / Ca ratios obtained for each experimental condition (step 2) are plotted in Fig. 5a. Values vary between 460 and 512 µmol mol−1(Table 4, Fig. 5a).
B / Ca ratios show a significant decrease with increas-ing light (2-way ANOVAF1,9=8.31,p=0.0181, see
Ta-ble 5), with values varying from 460±9, 485±11, 512±
10 µmol mol−1under LL and 455±10, 478±11 and 487±
13 µmol mol−1under HL for 22, 25 and 28◦C, respectively. Increasing temperature induces an increase in B concen-trations between 22 and 25◦C for both light conditions (SCHEFFE test 22–25◦C,p= −7.309, Table 5). A further enhancement can be observed between 25 and 28◦C under LL (one-way ANOVA,F2.2=107.53,p=0.0178) whereas
no significant boron concentration increase can be consid-ered between 25 and 28◦C under HL (one-way ANOVA,
F2,2.5=12.22,p=0.052).
H¨onisch et al. (2004) measured B / Ca ratios of Acro-pora nobilis from coral culturing experiments of 54.3, 57.9 and 63.0 ppm of boron at pHT =8.17, 7.97 and 7.72, respectively (T =27◦C, and light condition of 300± 15 µmol photons m−2s−1). These results, which correspond
to B / Ca of 503.3, 531.9 and 593.2 µmol mol−1, respectively
(using Ca = 40 %), are well comparable with our study for similarpCO2 conditions (532 vs. 478 to 512 µmol mol−1,
respectively). Similarly, B / Ca ratios measured on Acrop-ora nobilisfrom natural environments have been measured to fluctuate between 474 and 612 µmol mol−1 (Shirai et al., 2008) using similar ICP-MS facilities.
B / Ca ratios measured after the end of step 3 (recovery), vary between 416 and 446 µmol mol−1 (Table 4, Fig. 5a). These values are lower than those measured at the end of step 2, independently of the light and temperature conditions considered.
For comparison, B / Ca ratios were plotted vs. Sr / Ca ra-tios measured simultaneously (Fig. 5b). Sr / Ca rara-tios vary between ca. 8.99 and 9.20 mmol mol−1. These results are
in good agreement with ICP-MS values measured on Acro-pora nobilis from natural environments (from ≈8.5 to 9.5 mmol mol−1, Shirai et al., 2008).
4 Discussion
4.1 Metabolic measurements
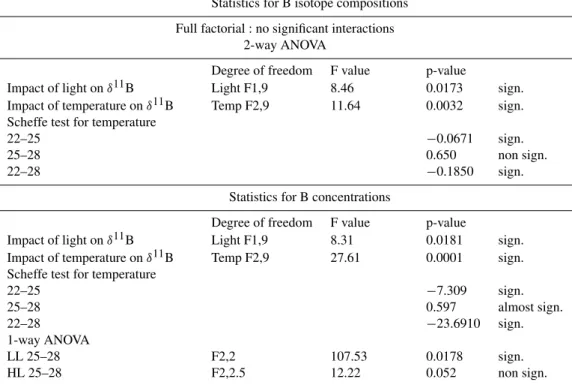
Table 5.Statistical analyses were performed with SAS version 72. A full factorial analyse was first conducted, showing no significant interactions between light and temperature variations on boron isotope compositions. Subsequently, two-way ANOVA tests were applied, showing both significant impact of light and temperature onδ11B. The light impact can be considered similar between the three temperature conditions. An additional SCHEFFE test was applied to test for inter comparison of temperature conditions. Significant differences of temperature on coral boron isotope composition can be observed between 22 and 25◦C and 22 and 28◦C, while isotopic signatures can be considered similar between 25 and 28◦C. Identical statistical tests were applied to boron concentrations, showing both significant impact of light and temperature on coral boron concentrations. Significant differences of temperature can be observed between 22 and 25◦C. Two additional 1-way ANOVA tests were performed to measure the impact of temperature increase from 25 to 28◦C, per light condition independently. This temperature increase induces a significant increase in boron concentrations under LL, while no significant increase can be observed under HL conditions.
Statistics for B isotope compositions
Full factorial : no significant interactions 2-way ANOVA
Degree of freedom F value p-value
Impact of light onδ11B Light F1,9 8.46 0.0173 sign.
Impact of temperature onδ11B Temp F2,9 11.64 0.0032 sign. Scheffe test for temperature
22–25 −0.0671 sign.
25–28 0.650 non sign.
22–28 −0.1850 sign.
Statistics for B concentrations
Degree of freedom F value p-value
Impact of light onδ11B Light F1,9 8.31 0.0181 sign.
Impact of temperature onδ11B Temp F2,9 27.61 0.0001 sign. Scheffe test for temperature
22–25 −7.309 sign.
25–28 0.597 almost sign.
22–28 −23.6910 sign.
1-way ANOVA
LL 25–28 F2,2 107.53 0.0178 sign.
HL 25–28 F2,2.5 12.22 0.052 non sign.
was 6 times higher under irradiance of 350 µmol m−2s−1
than the dark respiration measured under otherwise identi-cal conditions. Finally, coral identi-calcification is well-known to increase with increasing light (Light Enhanced Calcification, LEC, Goreau, 1959; Chalker and Taylor, 1975; Chalker and Barnes, 1990; Moya et al., 2006), and has been observed to increase with temperature for several species of corals (within the the limits of biological sustainability, Coles and Jokiel, 1977, 1978; Reynaud et al., 2007).
It can therefore be considered that nubbins used in this study were well acclimatized to culture conditions and should present geochemical signatures representative of the environmental parameters maintained in the culture condi-tions.
4.2 Boron isotopes
Due to the high seawater renewal rate into our culture aquaria (5 times per day), seawater carbonate chemistry remained constant through the experiment for all conditions (Table 2). Therefore, it is assumed that in our study the variation of the
skeletalδ11B reflects pH-variations at the site of calcification (Trotter et al., 2011).
4.2.1 Boron isotope compositions
Measured Acropora sp. δ11B vs. measured ambient sea-water pH are plotted relative to the borate ion curves de-termined for each experimental temperature at 22, 25 and 28◦C using the fractionation factor determined by Klochko et al. (2006)α=1.0272±0.0006 (salinity = 35, BT = 416 µM andδ11Bseawater=39.61 ‰, Fig. 4). The δ11B values
mea-sured in this study plot significantly above the curves and correspond to an increase in pH at the site of calcification of about 0.36, 0.40 and 0.39 pH units under LL, and 0.33, 0.36 and 0.35 pH units under HL, for 22, 25 and 28◦C, respectively (δ11Bsw= 39.61 ‰, BT= 416 µM and pKB
epithelium ofStylophora pistillatamaintained at 25◦C. Us-ing microsensors, Al-Moghrabi et al. (2001) and Al-Horani et al. (2003) measured a pH varying from 8.1 to 9.3 at the site of calcification of Galaxea fascicularis. Although this pH enhancement appears somewhat higher, those measure-ments remain compatible with the internal pH values calcu-lated in our study representing average values for calcifica-tion over∼15 weeks (see methods). Hence, in contrast to the microsensor or live tissue imaging approaches, which give instantaneous values, boron isotopes provide an average of several daily cycles (weeks). Furthermore, species-specific pH up-regulation mechanisms may account for the observed differences (H¨onisch et al., 2004; Krief et al., 2010; Trotter et al., 2011).
4.2.2 Light effect
To obtain a more reliable boron isotope pH proxy, it is critical to better quantify the “vital effect” superimposed on ambi-ent seawater pH during calcification. It has been long known that light influences the rate of coral calcification. This ef-fect is commonly referred as Light Enhanced Calcification (LEC) (e.g. Goreau, 1959; Chalker and Taylor, 1975; Chalker and Barnes, 1990). However, despite numerous studies per-formed on the coral-zooxanthellae symbiotic relationship, the mechanisms linking photosynthesis of the symbionts to coral calcification remain largely unknown (e.g. Gattuso et al., 1999; Allemand et al., 2004; Moya et al., 2006; Tam-butt´e et al., 2011). Among others, several hypotheses involv-ing modifications of carbonate chemistry inside the coelen-terons have been suggested to be responsible for (part of) the LEC processes. Hence, symbionts have been suggested to af-fect the DIC equilibrium within coral tissues by (1) taking up CO2for photosynthesis (Goreau, 1959; McConnaughey
and Whelan, 1997); or by (2) secreting OH−as a by-product of the carbon concentrating mechanism (CCM) (Furla et al., 1998). Interestingly, both of these processes should lead to an increase in pH of the extracellular site of calcification with light enhancement. This is in contradiction with our re-sult where a light enhancement of 200 µmol photons m−2s−1 induces a decrease in boron isotopic signature, representing a decrease in pH at the site of calcification of about 0.03, 0.04 and 0.03 pH-units at 22, 25 and 28◦C, respectively (Ta-ble 4). So far, only few studies have reported on internal pH measurements of the coral site of calcification. Al-Moghrabi et al. (2001), Al-Horani et al. (2003) and Venn et al. (2011) all reported an increase in pH at the site of calcification un-der light vs. dark conditions, independently of the analytical methods considered (e.g. microelectrodes, live tissue imag-ing). Kuhl et al. (1995) measured a decrease in pH in the outer 0.1 mm of coral tissue (Faviasp.) with decreasing light intensities. However, to our knowledge, no study reports on variation in pH of coral site of calcification under various light intensities.
Recently, Krief et al. (2010) observed a decrease in calci-fication rate together with an increase in tissue biomass for tropical corals maintained under increasedpCO2conditions.
They argued that calcification stimulates zooxanthellae pho-tosynthesis by enhancing CO2concentration within the
coe-lenteron. Under highpCO2 conditions, more CO2 is
avail-able at the site of calcification, rendering less energy consum-ing the process concentratconsum-ing Ca2+, which allows the coral polyp to allocate more energy on tissue biomass. Similarly, Al Horani (2005) suggested that higher respiration rates stim-ulated by algal photosynthesis under enhanced light condi-tions increase ATP availability and therewith coral Ca2+ AT-Pase activity and calcification rates. Increases in light intensi-ties and consequently calcification rates should release more CO2at the site of calcification, and decrease internal pH with
increasing light. However, although both these processes ap-pear in line with our result where a decrease in pH at the site of calcification is related to increased calcification and photosynthesis rates, they rather seem to be consequences of the LEC processes rather than causes. At this stage, our re-sults underline the urgent need of additional studies to better understand the LEC mechanisms in corals.
To date, H¨onisch et al. (2004), is the only other study to report on the impact of light on coral boron iso-tope composition (Porites compressa). Although variation in light intensities considered in their study (from 540 to 1210 µmol photons m−2s−1)is 3 times greater than in our
experiment,δ11B remained overall not affected. It might be argued that different species react differently to changes in light intensities, as for example the slow calcifying massive Poritessp. might present differences in metabolic fractiona-tion when compared with the fast-growing branched Acrop-orasp. Nevertheless, it should be noted that the total duration of H¨onisch et al. (2004) culturing experiments was 57 days, before which five days were allocated to corals acclimation. In our study, corals were allowed for acclimation during 9 weeks (63 days), while the experiment itself (step 2) lasted for 15 weeks (105 days). The length of the acclimation period and of the experiment can play a significant role, as stressed corals may present disruption in metabolic control and there-with differing isotopic signatures (see Sect. 4.2.4).
Our results indicate that pH at the site of calci-fication seems to be related to photosynthetic rates. However, changes in light intensities from 200 to 400 µmol photon m−2s−1, representing average annual light
B/Ca ratios (μmol/mol)
Fig. 5. (a)Mean B / Ca ratios (µmol mol−1) measured at the end of step 2 on corals grown under 200 (blue dots) and 400 (green squares) photon m−2s−1, plotted vs. temperature. Measurements performed after step 3 (recovery experiment) are plotted on the same graph (orange crosses).(b). Mean B / Ca ratios plotted vs. mean Sr / Ca ratios measured simultaneously (200 and 400 photon m−2s−1light conditions are represented by blue dots and green squares, respectively). Solid lines represent linear regression calculated using all values (R2=0.92). Interpretation of the Sr/Ca values will be presented elsewhere (Juillet-Leclerc et al., 2012).
can be considered as negligible. Our results thus confirm the general applicability of theδ11B-pH proxy as well as provide new insights on the mechanism of internal pH regulation in corals.
4.2.3 Temperature effect
In our study,δ11B increases with increasing temperature be-tween 22 and 25◦C. When considering analytical uncertain-ties/reproducibility (from 0.20 to 0.42 ‰), these δ11B in-creases of 0.94 (LL) and 0.74 ‰ (HL), remain small but statistically significant (Table 5) and correspond to enhance-ments of 0.027 and 0.016 pH units at the site of calcification, respectively. However, no significant variations can be ob-served between 25 and 28◦C withδ11B varying from 0.09 (LL) and 0.17 ‰ (HL) (Fig. 3, Tables 4 and 5).
These results differ from our metabolic data, which show a linear increase in calcification rate with increasing temper-ature for both light conditions (R2=0.95 and 0.99 for LL and HL, respectively).
As mentioned above, corals can enhance pH under the cal-icoblastic epithelium (e.g. Venn et al., 2011). A mechanism involving the removal of protons generated during calcifica-tion via Ca2+ ATPase activity was proposed to be respon-sible for the observed pH increase (and therewith increase in [CO23−]) and Ca2+ concentration of coral site of calci-fication (Cohen and McConnaughey, 2003; McConnaughey and Whelan, 1997, Al-Horani et al., 2003). More recently, Herfort et al. (2008) reported that additions of NaHCO3 to
synthetic seawater proportionally increased the calcification
rate ofAcropora sp. This indicates that the concentrations of carbonate species ([HCO−3] and/or [CO23−]) rather than calcium, are the limiting factor of coral calcium carbonate precipitation. Carbonate system equilibria are such that CO2
is more soluble in cold water. Hence, an increase in tem-perature leads to a decrease in [CO2(aq)] and a subsequent
decrease in [HCO−3] and increase in [CO23−]. In turn, this could explain why, within a certain species-specific temper-ature range, coral calcification rates have been observed to increase with increasing temperature (e.g. Coles and Jok-iel, 1977, 1978; Reynaud et al., 2007).
This non-linear temperature effect complicates the determi-nation of a potential correcting factor.
It should be noted here that, despite seeing in our study an increase in calcification rate under both increased tempera-ture and increased light intensity, these conditions have the opposite effect on boron isotopic signatures. However, one should keep in mind that these two environmental param-eters might influence calcification on many different levels. Temperature, for example, is known to impact metabolic pro-cesses (e.g. enzyme activity), which in turn might account for the observed differences in pH regulation. At this stage, cal-cification mechanisms need to be better understood to fully quantify light and temperature effect onδ11B-pH proxy.
4.2.4 Boron isotope composition after recovery experiment
Boron isotopic composition determined at the end of step 3 (recovery period) does not show any correlation with re-covery period culture conditions (200 µmol photons m−2s−1,
25◦C). Moreover, no straightforward correlation between boron isotopic compositions measured at the end of step 3 can be made with any of the previous step 2 culture con-ditions. When translated into pH values using Klochko et al. (2006) fractionation factor, almost all boron isotopic com-positions measured at the end of step 3 present lower pH re-sults (from 8.20 to 8.36) compared to pH values obtained at the end of step 2 (from 8.35 to 8.42), independent of the light and temperature conditions considered (Table 4, Figs. 3 and 4). These results indicate that the mechanical breakage applied at the end of step 2 induced significant stress to the organisms, which led to a disruption of pH enhancement at the site of calcification. In terms of proxy reconstruction, this finding highlights the fact that corals submitted to strong stress factors (e.g. storms, bleaching, etc.) should not be con-sidered for paleo-environmental reconstructions.
4.3 Boron concentrations
4.3.1 Light effect
B / Ca ratios andδ11B show comparable trends, although they were measured following different sample preparation and analytical techniques (ICP-QMS and MC-ICPMS, respec-tively). An increase in pH of the calcification site increases B(OH)4concentrations (Hershey et al., 1986; Hemming and
Hanson, 1992). The boron concentration in the coral being proportional to the boron activity in the precipitating solu-tion (Kitano et al., 1978; Vengosh et al., 1991; Hemming and Hanson, 1992), a decrease in pH at the site of calci-fication under increased light intensity should induce a de-crease in [B(OH)−4] and therewith lower B concentrations to be recorded in the coral aragonite. Our results are consistent with a decrease in pH at the site of calcification observed under enhanced light intensity.
4.3.2 Temperature effect
In our study, when all other parameters are maintained con-stant, boron concentrations inAcroporasp. increase with in-creasing temperature and [CO23−]. So far, B / Ca in corals was found to vary inversely with temperature (Hart and Co-hen, 1996; Sinclair et al., 1998; Fallon et al., 2003; Montagna et al., 2007; Allison and Finch, 2010; Trotter et al., 2011). To our knowledge, Trotter et al. (2011) is the only other study to report on the impact of temperature on B / Ca ratios of cul-tured shallow water corals. They culcul-tured the Mediterranean coralCladocora caespitosaunder different temperature con-ditions and observed, in contradiction to our study, a negative correlation with seawater temperature. Nevertheless, in the experimental setup used by Trotter et al. (2011), corals were not maintained under constant temperature conditions, but supplied with natural unfiltered seawater following seasonal temperature fluctuations (for complete experimental proto-col see Rodolfo-Metalpa et al., 2010). With the exception of
pCO2, which was held constant, irradiance as well as the
photoperiod were changed according to their seasonal val-ues measured at ca. 20 m depth in the Bay of Villefranche where corals had been originally collected. Changes in food availability following seasonal fluctuations as corals fed from the unfiltered seawater might also impact coral biology and therewith boron incorporation. Therefore, B / Ca ratios mea-sured by Trotter et al. (2011) might well follow changes in calcification, respiration and/or photosynthesis rates of the coral-symbiont assemblage, triggered by seasonal changes in temperature, light, and feeding regime, rendering the impact of temperature difficult to unravel from that of other param-eters that vary concomitantly.
Interestingly, Trotter et al. (2011) pointed out that the ob-served correlation of B / Ca with temperature seemed to be the result of the strong temperature dependence of seawa-ter [B(OH−4)] / [CO23−]. In their study, increase in tempera-ture correlates with increasing calcification rates (Rodolfo-Metalpa et al., 2010), increasing seawater [CO23−] (decreas-ing [B(OH−4)] / [CO23−]) and decreasing B / Ca ratios in the coral skeleton, while [B(OH−4)] / [HCO−3] remains insignifi-cantly correlated to either B / Ca ratios or temperature. Due to the relative proportion of [B(OH−4)] vs. [CO23−] and/or [HCO−3] in seawater, carbonate forms are expected to be the main driver of variations in [B(OH−4)] / [CO23−] and [B(OH−4)] / [HCO−3] ratios. In our study, increases in temper-ature from 22 to 28◦C induce an increase in carbonate ion concentration from 236 to 268 µmol kg−1, while
bicarbon-ate concentration decreased from 1966 to 1892 µmol kg−1.
Therefore, increases in temperature are correlated to in-crease in calcification rate, inin-crease in [CO23−] (decrease in [B(OH−4)] / [CO23−]), but contrarily to Trotter et al. (2011), increase in B / Ca ratios in the coral skeleton.
planktonic foraminifera for example, while certain studies report a positive relationship between the partition coeffi-cient (KD= [(B / Ca)CaCO3] / [B(OH)−4 / HCO−3]sw)and
tem-perature (Globorotalia inflata, Globigerina bulloides from coretop samples, and Globigerinoides ruber from down-core, Tripati et al., 2009; Yu et al., 2007), others ob-served a negative KD−T◦C relationship (Globigerinoides
sacculifer,G. ruber, andNeogloboquadrina dutertreifrom coretop; Foster, 2008). Similarly, when B / Ca ratios is ob-served to increase with temperature in Globorotalia in-flata (Yu et al., 2007), no temperature influence can be seen onNeogloboquadrina pachyderma(sinistral) (Hendry et al., 2009). Recently, culture experiments made by Allen et al., (2011) on the planktonic foraminiferaOrbulina uni-versa, did not indicate any temperature effect on B / Ca ratios (B / Ca values measured on shells grown between 17.7 and 26.5◦C agree within error with a slope statistically indis-tinguishable from zero). Considering the varying responses of foraminifera shell B / Ca ratios to temperature, Allen et al. (2011) recommend applying empirical, species-specific temperature calibrations for paleo-reconstructions.
These observations suggest that the controlling factors and processes driving boron transport to the calcification site and its incorporation into marine calcium carbonates have not been adequately identified yet. Additional species-specific experiments combining both cultured and naturally-grown samples are necessary to improve our understanding and therewith the use of B / Ca as an environmental proxy.
4.3.3 B / Ca vs. Sr / Ca ratios
B / Ca ratios in corals have been reported to be well corre-lated with Sr / Ca ratios (Hart and Cohen, 1996; Sinclair et al., 1998; Fallon et al., 2003; Montagna et al., 2007; Al-lison and Finch, 2010). Sr / Ca in corals is considered to be primarily controlled by seawater temperature (Sinclair et al., 1998), following a negative correlation (e.g. Quinn and Sampson, 2002; Corr`ege, 2006; DeLong et al., 2007; Co-hen and Thorrold, 2007; Goodkin et al., 2007). This agrees with our study where Sr / Ca ratio decreases with increasing temperature (R2=0.89; interpretation of the Sr / Ca values is presented elsewhere, see Juillet-Leclerc et al., 2012). A strong negative correlation is observed between Sr / Ca and B / Ca (R2=0.92), which contradicts the positive correlation measured in previous studies on corals from natural environ-ments (e.g. Allison and Finch, 2010). These observations en-lighten (1) the significant impact of temperature on B (and Sr) concentrations when seawater pH is maintained constant; and (2) the (negatively) coupled incorporation of B and Sr intoAcroporasp.
4.3.4 B / Ca ratios after recovery experiment
Boron concentrations determined at the end of step 3 do not present any correlation with growth culture conditions un-der which they grew during the 10 weeks of the recovery period (200 µmol photons m−2s−1, 25◦C). Also, no straight-forward correlation between boron concentrations measured at the end of step 3 can be made with any of the previous step 2 culture conditions. B / Ca ratios measured after the recov-ery period are all significantly lower than those at the end of step 2, independently of the experimental conditions consid-ered (see Table 4). These results agree with the observations made for boron isotope composition and tend to confirm that the mechanical stress applied to the coral between step 2 and step 3 led to a perturbation of the pH enhancement process at the site of calcification.
5 Conclusions
We investigated the impact of light and temperature on boron isotope composition and boron concentration of Acro-pora sp. skeleton from nubbins maintained under cul-ture experiments. Metabolic measurements indicate that photosynthesis, respiration and calcification rates increase with increasing light and temperature.δ11B values indicate higher pH at the site of calcification compared to ambi-ent seawater pH, both under low light (LL) and high light (HL) conditions. Changes in light intensities from 200 to 400 µmol photon m−2s−1 induces a decrease in pH at the
site of calcification of about 0.03, 0.04 and 0.03 pH-units at 22, 25 and 28◦C, respectively. These light variations, cho-sen to mimic average annual variations in natural environ-ments whereAcroporasp. can be found, only biased pH re-constructions by about 0.05 units. Paleo-pH rere-constructions from corals being still broadly limited to a precision no bet-ter than≈0.05 pH-units, our observations support the idea that variations in light intensities on pH reconstructions for inter-annual resolution can be considered as negligible.
An increase ofδ11B is observed between 22 and 25◦C, which corresponds to enhancements of 0.027 and 0.016 pH units at the site of calcification, for LL and HL, respectively. However, no furtherδ11B increase occurred between 25 and 28◦C. This non-linear temperature effect complicates the de-termination of a correcting factor, underlining the need of ad-ditional culture experiments to better calibrate the impact of temperature on the pH-δ11B proxy.
This suggests that the controlling factors driving boron con-centrations have not yet been adequately identified and might be influenced by other seawater variables and species specific responses.
Boron isotopic compositions and boron concentrations de-termined at the end of step 3 do not present any correlation with environmental parameters of step 3 culture conditions (200 µmol photons m−2s−1, 25◦C) nor with any of the previ-ous step 2 culture conditions. Nevertheless, when translated into pH, recovery boron isotopic compositions and boron concentrations are all consistent with decreased pH values, independently of the light and temperature conditions con-sidered. These results indicate that physical stress applied to the organisms before beginning of step 3 led to a disruption of the pH enhancement at the site of calcification. This high-lights the fact that corals submitted to strong stress factors (e.g. storms, bleaching events etc.) should not be considered for paleo-environmental reconstructions.
Acknowledgements. This work was supported by the CEA – CNRS and USVQ (national project INSU/ASTICO), and by Australian Research Council (ARC) grant DP0986505 and the ARC Centre of Excellence in Coral Reef Studies. It was also partially funded by the Framework 7 European Project on Ocean Acidification (EPOCA grant agreement number 211384). Paolo Montagna is grateful for financial support from the Marie Curie International Outgoing Fellowship (MEDAT-ARCHIVES). This is LSCE contri-bution 4828. The authors would like to thank Guillaume Tisserand for his help with coral culturing experiments. We are grateful to Louise Bordier for helping with elemental and isotopic samples preparation and measurement, and Michael Holcomb for editing the manuscript and for his help with statistical issue.
Edited by: A. Shemesh
The publication of this article is financed by CNRS-INSU.
References
Al-Horani, F. A., Al-Moghrabi, S. M., and de Beer, D.: Microsen-sor study of photosynthesis and calcification in the scleractinian coral,Galaxea fascicularis: active internal carbon cycle, J. Exp. Mar. Biol. Ecol., 288, 1–15, 2003.
Allemand, D., Ferrier-Pages, C., Furla, P., Houlbreque, F., Puverel, S., Reynaud, S., Tambutte, E., Tambutte, S., and Zoccola, D.: Biomineralisation in reef-building corals: from molecular mech-anisms to environmental control, C. R. Palevol, 3, 453–467, 2004.
Allen, K. A., Honisch, B., Eggins, S. M., Yu, J. M., Spero, H. J., and Elderfield, H.: Controls on boron incorporation in cultured tests
of the planktic foraminiferOrbulina universa, Earth Planet. Sci. Lett., 309, 291–301, 2011.
Allison, N., and Finch, A. A.:δ(11)B, Sr, Mg and B in a modern
Poritescoral: the relationship between calcification site pH and skeletal chemistry, Geochim. Cosmochim. Ac., 74, 1790–1800, 2010.
Al-Moghrabi, S. M., Allemand, D., and Jaubert, J.: Valine uptake by the scleractinian coralGalaxea fascicularis: characterization and effect of light and nutritional status., J. Comp. Physiol. B, 163, 355–362, 1993.
Al-Moghrabi, S. M., Al-Horani, F. A., and de Beer, D.: Calcifica-tion by the scleractinian coralGalaxea fascicularis: direct mea-surements on calicoblastic layer using micro-sensors, in: 8th Int. Symp. on Biomineralization, 45, 2001.
Barnes, D. J., and Chalker, B. E.: Calcification and photosynthesis in reef-building corals and algae, in: Coral Reefs, edited by: Z. Dubinsky, Amsterdam, Elsevier, 109–131, 1990.
Bourdin, C., Douville, E., and Genty, D.: Alkaline-earth metal and rare-earth element incorporation control by ionic radius and growth rate on a stalagmite from the Chauvet Cave, Southeastern France, Chem. Geol., 290, 1–11, 2011.
Caldeira, K., and Wickett, M. E.: Ocean model predictions of chemistry changes from carbon dioxide emissions to the at-mosphere and ocean, J. Geophys. Res.-Oceans, 110, C09S04, doi:10.1029/2004JC002671, 2003.
Caldeira, K., and Wickett, M. E.: Anthropogenic carbon and ocean pH, Nature, 425, 365–365, 2005.
Chalker, B. E. and Taylor, D. L.: Light-enhanced calcification, and role of oxidative phosphorylation in calcification of coral Acrop-ora cervicornis, P. Roy. Soc. Lond. B Bio., 190, 323–331, 1975. Chalker, B. E. and Barnes, D. J.: Gamma-densitometry for the
mea-surement of skeletal density, Coral Reefs, 9, 11–23, 1990. Cohen, A. L. and McConnaughey, T. A.: Geochemical perspectives
on coral mineralization, 151–187, in: Dove PMDJJWS, edited by: Biomineralization, Vol. 54, 2003.
Cohen, A. L. and Thorrold, S. R.: Recovery of temperature records from slow-growing corals by fine scale sampling of skeletons, Geophys. Res. Lett., 34, L17706, doi:10.1029/2007GL030967, 2007.
Coles, S. L., and Jokiel, P. L.: Synergistic effects of temperature salinity, and light on hermatypic coralsMontipora verrucosa, Mar. Biol., 49, 187–195, 1977.
Coles, S. L., and Jokiel, P. L.: Effects of temperature on photosyn-thesis and respiration in hermatypic corals, Mar. Biol., 43, 209– 216, 1978.
Corr`ege, T.: Sea surface temperature and salinity reconstruction from coral geochemical tracers, Palaeogeogr. Palaeocl., 232, 408–428, 2006.
Davies, P. S.: Short-term growth measurements of corals using an accurate buoyant weighing technique, Mar. Biol., 101, 389–395, 1989.
DeLong, K. L., Quinn, T. M., and Taylor, F. W.: Reconstruct-ing twentieth-century sea surface temperature variability in the southwest Pacific: A replication study using multiple coral Sr/Ca records from New Caledonia, Paleoceanography, 22, PA4212, doi:10.1029/2007PA001444, 2007.
DOE: Handbook of methods for the analysis of the various parame-ters of the carbon dioxide system in sea-water, Version 2, edited by: Dickson, A. G. and Goyet, C., ORNL/CDIAC-74, 1994. Douville, E., Paterne, M., Cabioch, G., Louvat, P., Gaillardet,
J., Juillet-Leclerc, A., and Ayliffe, L.: Abrupt sea surface pH change at the end of the Younger Dryas in the central sub-equatorial Pacific inferred from boron isotope abundance in corals (Porites), Biogeosciences, 7, 2445–2459, doi:10.5194/bg-7-2445-2010, 2010.
Dubinsky, Z., Falkowski, P. G., and Sharf, D.: Aspects of adapta-tion of hermatypic orals and their endosymbiotic zooxanthellae to light, Bull. Inst. Oceanogr. Fish., 9, 124–134, 1983.
Fallon, S. J., McCulloch, M. T., van Woesik, R., and Sinclair, D. J.: Corals at their latitudinal limits: laser ablation trace element sys-tematics inPoritesfrom Shirigai Bay, Japan, Earth Planet. Sci. Lett., 172, 221–238, 1999.
Fallon, S. J., McCulloch, M. T., and Alibert, C.: Examining water temperature proxies in Porites corals from the Great Barrier Reef: a cross-shelf comparison, Coral Reefs, 22, 389–404, 2003. Foster, G. L.: Seawater pH, pCO2 and CO23− variations in the
Caribbean Sea over the last 130 kyr: A boron isotope and B/Ca study of planktic foraminifera, Earth Planet. Sci. Lett., 271, 254– 266, 2008.
Foster, G. L., Pogge von Strandmann, P. A. E., and Rae, J. W. B.: Boron and Magnesium Isotopic Composition of Seawater, Geochem. Geophy. Geosy., 11, 1–10, 2010.
Furla, P., Benazet-Tambutte, S., Jaubert, J., and Allemand, D.: Func-tional polarity of the tentacle of the sea anemone Anemonia viridis: role in inorganic carbon acquisition, Am. J. Physiol.-Reg. I., 274, R303–R310, 1998.
Gattuso, J. P. and Hansson, L.: Ocean acidification, edited by: Gat-tuso, J.-P. and Hansson, L., Oxford university press, 352 pp., 2011.
Gattuso, J. P., Allemand, D., and Frankignoulle, M.: Photosynthesis and calcification at cellular, organismal and community levels in coral reefs: A review on interactions and control by carbonate chemistry., Am. Zool., 39, 160–183, 1999.
Goodkin, N. F., Hughen, K. A., and Cohen, A. L.: A multicoral calibration method to approximate a universal equation relating Sr/Ca and growth rate to sea surface temperature, Paleoceanog-raphy, 22, PA1214, doi:10.1029/2006PA001312, 2007.
Goreau, T. F.: The physiology of skeleton formation in corals. 1. A method for measuring the rate of calcium deposition by corals under different conditions, Biol. Bull., 116, 59–75, 1959. Griffith, P. C., Cubit, J. D., Adey, W. H., and Norris, J. N.:
Computer-automated flow respirometry: metabolism measure-ments on a Caribbean reef and in a microcosm, Limnol. Oceanogr., 32, 442–451, 1987.
Harding, D. J., Arden, J. W., Rickaby, R. E. M.: A method for precise analysis of trace element/calcium ratios in car-bonate samples using quadrupole inductively coupled plasma mass spectrometry, Geochem. Geophy. Geosy., 7, Q06003, doi:10.1029/2005GC001093, 2006.
Hart, S. R. and Cohen, A. L.: An ion probe study of annual cycles of Sr/Ca and other trace elements in corals, Geochim. Cosmochim. Ac., 60, 3075–3084, 1996.
Hemming, N. G. and Hanson, G. N.: Boron isotopic composition and concentration in modern marine carbonates, Geochim. Cos-mochim. Ac., 56, 537–543, 1992.
Hendry, K. R., Rickaby, R. E. M., Meredith, M. P., and Elder-field, H.: Controls on stable isotope and trace metal uptake in
Neogloboquadrina pachyderma(sinistral) from an Antarctic sea-ice environment, Earth Planet. Sci. Lett., 278, 67–77, 2009. Herfort, L., Thake, B., and Taubner, I.: Bicarbonate stimulation of
calcification and photosynthesis in two hermatypic corals, J. Phy-cology, 44, 91–98, 2008.
Hershey, J. P., Fernandez, M., Milne, P. J., and Millero, F. J.: The ionization of boric acid in NaCl, Na-Ca-Cl and Na-Mg-Cl solu-tions at 25◦C., Geochim. Cosmochim. Ac., 50, 143–148, 1986. H¨onisch, B., Hemming, N. G., Grottoli, A. G., Amat, A., Hanson,
G. N., and Buma, J.: Assessing scleractinian corals as recorders for paleo-pH: Empirical calibration and vital effects, Geochim. Cosmochim. Ac., 68, 3675–3685, 2004.
H¨onisch, B., Hemming, N. G., and Loose, B.: Comment on “A crit-ical evaluation of the boron isotope-pH proxy: The accuracy of ancient ocean pH estimates”, edited by: Pagani, M., Lemarchand, D., Spivack, A. and Gaillardet, J., Geochim. Cosmochim. Ac., 71, 1636–1641, 2007.
H¨onisch, B., Bickert, T., and Hemming, N. G.: Modern and Pleis-tocene boron isotope composition of the benthic foraminifer
Cibicidoides wuellerstorfi, Earth Planet. Sci. Lett., 272, 309–318, 2008.
H¨onisch, B., Hemming, N. G., Archer, D., Siddall, M., and Mc-Manus, J. F.: Atmospheric Carbon Dioxide Concentration Across the Mid-Pleistocene Transition, Science, 324, 1551–1554, 2009. Iglesias-Prieto, R. and Trench, R. K.: Acclimation and adapta-tion to irradiance in symbiotic dinoflagellates. II. Response of chlorophyll-protein complexes to different photon-flux densities, Mar. Biol., 130, 23 pp., 1997.
Jacques, T. G., Marshall, N., and Pilson, M. E. Q.: Experimental ecology of the temperate scleractinian coralAstrangia danae, 2. Effect of temperature, light-intensity and synbiosis with zooxan-thellae on metabolic-rate and calcification, Mar. Biol., 76, 135– 148, 1983.
Jokiel, P. L., and Coles, S. L.: Effects of temperature on mortality and growth of Hawaiian reef corals, Mar. Biol., 43, 201–208, 1977.
Jokiel, P. L., Maragos, J. E., and Franzisket, L: Coral growth: buoyant weight technique, in: Stoddart, D. R. and Johannes, R. E., Coral reefs, Research Methods, UNESCO monographs on oceanographic methodology, Paris, 529–542, 1978.
Juillet-Leclerc, A., Reynaud, S., Dissard, D., Tisserant, G., and Ferrier-Pag`es, C.: Sr/Ca and Mg/Ca are indicators of the cal-cification rate of zooxanthellate scleractinian corals, Geochim. Cosmochim. Ac., submitted, 2012.
Kajiwara, K., Nagai, A., Ueno, S., and Yokochi, H.: Examination of the effect of temperature, light intensity and zooxanthellae concentration on calcification and photosynthesis of scleractinian coralAcropora pulchra, J. Sch. Mar. Sci., Tech Tokai Univ., 40, 95–103, 1995.
Kitano, Y., Okumura, M., and Idogaki, M.: Coprecipitation of Borate-Boron with Calcium-carbonate, Geochem. J., 12, 183– 189, 1978.
Klochko, K., Kaufman, A. J., Yao, W. S., Byrne, R. H., and Tossell, J. A.: Experimental measurement of boron isotope fractionation in seawater, Earth Planet. Sci. Lett., 248, 276–285, 2006. Klochko, K., Cody, G. D., Tossell, J. A., Dera, P., and Kaufman, A.
arag-onite using (11)B MAS NMR, Geochim. Cosmochim. Ac., 73, 1890–1900, 2009.
Krief, S., Hendy, E. J., Fine, M., Yam, R., Meibom, A, Foster, G. L., and Shemesh, A.: Physiological and isotopic responses of scle-ractinian corals to ocean acidification, Geochim. Cosmochim. Ac., 74, 4988–5001, 2010.
Kuhl, M., Cohen, Y., Dalsgaard, T., Jorgensen, B. B., and Revsbech, N. P.: Microenvironment and photosynthesis of zooxanthellae in scleractinian corals studied with microsensors for O2, pH and light, Mar. Ecol.-Progr. S., 117, 159–172, 1995.
Louvat, P., Bouchez, J., and Paris, G.: MC-ICP-MS Isotope mea-surements with direct injection nebulisation (d-DIHEN): optimi-sation and application to Boron in seawater and carbonate sam-ples, Geostand. Geoanal. Res., 35, 75–88, 2011.
McCulloch, M., Trotter, J., Montagna, P., Falter, J., Dunbar, R., Frei-wald, A., F¨orsterra, G., L´opez Correa, M., Maier, C., R¨uggeberg, A., Taviani, M., and Thresher, R.: Boron Isotope Systematics of Cold-water Scleractinian Corals: Internal pH Up-regulation and Response to Ocean Acidification, Geochem. Cosmochim. Ac., in press, 2012.
Montagna, P., McCulloch, M., Mazzoli, C., Silenzi, S., and Odorico, R.: The non-tropical coralCladocora caespitosaas the new cli-mate archive for the Mediterranean: high-resolution (similar to weekly) trace element systematics, Quaternary Sci. Rev., 26, 441–462, 2007.
Moya, A., Tambutte, S., Tambutte, E., Zoccola, D., Caminiti, N., and Allemand, D.: Study of calcification during a daily cycle of the coralStylophora pistillata: implications for ’light-enhanced calcification’, J. Exp. Biol., 209, 3413–3419, 2006.
Okai, T., Suzuki, A., Terashima, S., Inoue, M., Nohara, M., Kawa-hata H., and Imai, N.: Collaborative analysis of GSJ/AIST geo-chemical reference materials JCp-1 (Coral) and JCt-1 (Giant Clam). Chikyukagaku, Geochemistry, 38, 281–286, 2004. Palmer, M. R. and Pearson, P. N.: A 23 000-Year record of surface
water pH andpCO2 in the Western Equatorial Pacific, Ocean Science, 300, 480–482, 2003.
Pelejero, C., Calvo, E., McCulloch, M. T., Marshall, J. F., Gagan, M. K., Lough, J. M., and Opdyke, B. N.: Preindustrial to modern in-terdecadal variability in coral reef pH, Science, 309, 2204–2207, 2005.
Quinn, T. M., and Sampson, D. E.: A multiproxy approach to recon-structing sea surface conditions using coral skeleton geochem-istry, Paleoceanography, 17, 2002.
Reynaud, S., Ferrier-Pages, C., Sambrotto, S. R., Juillet-Leclerc, A., Jaubert, J., and Gattuso J.-P.: Effect of feeding on the carbon and oxygen isotopic composition in the tissues and skeleton of the zooxanthellae coralStylophora pistillata, Mar. Ecol.-Progr. S., 238, 81–89, 2002.
Reynaud, S., Ferrier-Pages, C., Boisson, F., Allemand, D., and Fair-banks, R. G.: Effect of light and temperature on calcification and strontium uptake in the scleractinian coralAcropora verweyi, Mar. Ecol.-Progr. S., 279, 105–112, 2004.
Reynaud, S., Leclercq, N., Romaine-Lioud, S., Ferrier-Pages, C., Jaubert, J., and Gattuso, J. P.: Interacting effects of CO2partial pressure and temperature on photosynthesis and calcification in a scleractinian coral, Global Change Biol., 9, 1660–1668, 2003. Reynaud, S., Ferrier-Pages, C., Meibom, A., Mostefaoui, S.,
Mort-lock, R., Fairbanks, R., and Allemand, D.: Light and temperature effects on Sr/Ca and Mg/Ca ratios in the scleractinian coral
Acro-pora sp., Geochim. Cosmochim. Ac., 71, 354–362, 2007. Reynaud-Vaganay, S., Gattuso, J. P., Cuif, J. P., Jaubert, J., and
Juillet-Leclerc, A.: A novel culture technique for scleractinian corals: application to investigate changes in skeletal δ18O as a function of temperature, Mar. Ecol.-Progr. S., 180, 121–130, 1999.
Reynaud-Vaganay, S., Juillet-Leclerc, A., Jaubert, J., and Gattuso, J. P.: Effect of light on skeletal d13C and d18O, and interaction with photosynthesis, respiration and calcification in two zoox-anthellate scleractinian corals, Palaeogeogr. Palaeocl., 175, 393– 404, 2001.
Rodolfo-Metalpa, R., Peirano, A., Houlbreque, F., Abbate, M., and Ferrier-Pages, C.: Effects of temperature, light and heterotrophy on the growth rate and budding of the temperate coralCladocora caespitosa, Coral Reefs, 27, 17–25, 2008.
Rodolfo-Metalpa, R., Martin, S., Ferrier-Pag`es, C., and Gattuso, J.-P.: Response of the temperate coralCladocora caespitosato mid- and long-term exposure to pCO2 and temperature levels projected for the year 2100 AD, Biogeosciences, 7, 289–300, doi:10.5194/bg-7-289-2010, 2010.
Rollion-Bard, C., Blamart, D., Trebosc, J., Tricot, G., Mussi, A., and Cuif, J. P.: Boron isotopes as pH proxy: A new look at boron speciation in deep-sea corals using(11)B MAS NMR and EELS, Geochim. Cosmochim. Ac., 75, 1003–1012, 2011.
Roy, R. N., Roy, L. N., Vogel, K. M., Moore, C. P., Pearson, T., Good, C. E., and Miller, F. J.: Thermodynamics of the dissocia-tion of boric acid in seawater, Mar. Chem., 44, 243–248, 1993. Shirai, K., Kawashima, T., Sowa, K., Watanabe, T., Nakaniori, T.,
Takahata, N., Arnakawa, H., and Sano, Y.: Minor and trace ele-ment incorporation into branching coralAcropora nobilis skele-ton, Geochim. Cosmochim. Ac., 72, 5386–5400, 2008.
Sinclair, D. J., Kinsley, L. P. J., and McCulloch, M. T.: High reso-lution analysis of trace elements in corals by laser ablation ICP-MS, Geochim. Cosmochim. Ac., 62, 1889–1901, 1998. Spivack, A. J., You, C. F., and Smith, H. J.: Foraminiferal boron
isotope ratios as a proxy for surface ocean pH over the past 21-Myr, Nature, 363, 149–151, 1993.
Tambutt´e, S., Holcomb, M., Ferrier-Pages, C., Reynaud, S., Tam-butte, E., Zoccola, D., and Allemand, D.: Coral biomineraliza-tion: From the gene to the environment, J. Exp. Mar. Biol. Ecol., 408, 58–78, 2011.
Tripati, A. K., Roberts, C. D., and Eagle, R. A.: Coupling of CO2 and Ice Sheet Stability Over Major Climate Transitions of the Last 20 Million Years, Science, 326, 1394–1397, 2009. Trotter, J., Montagna, P., McCulloch, M., Silenzi, S., Reynaud, S.,
Mortimer, G., Martin, S., Ferrier-Pag`es, C., Gattuso, J.-P., and Rodolfo-Metalpa, R.: Quantifying the pH ’vital effect’ in the temperate zooxanthellate coralCladocora caespitosa: Validation of the boron seawater pH proxy, Earth Planet. Sci. Lett., 303, 163–173, 2011.
Vengosh, A., Kolodny, Y., Starinsky, A., Chivas, A. R., and McCul-loch, M. T.: Coprecipitation and isotopic fractionation of boron in modern biogenic carbonates, Geochim. Cosmochim. Ac., 55, 2901–2910, 1991.
Wei, G. J., McCulloch, M. T., Mortimer, G., Deng, W. F., and Xie, L. H.: Evidence for ocean acidification in the Great Barrier Reef of Australia, Geochim. Cosmochim. Ac., 73, 2332–2346, 2009. Yu, J. M. and Elderfield, H.: Benthic foraminiferal B/Ca ratios
re-flect deep water carbonate saturation state, Earth Planet. Sci. Lett., 258, 73–86, 2007.
Yu, J. M., Elderfield, H., and H¨onisch, B.: B/Ca in planktonic foraminifera as a proxy for surface seawater pH, Paleoceanog-raphy, 22, PA2202, doi:10.1029/2006PA001347, 2007.
Yu, J. M., Foster, G. L., Elderfield, H., Broecker, W. S., and Clark, E.: An evaluation of benthic foraminiferal B/Ca andδ(11)B for deep ocean carbonate ion and pH reconstructions, Earth Plane. Sci. Lett., 293, 114–120, 2010.