BGD
9, 5969–6014, 2012Impact of light and temperature on coral
Boron incorporation
D. Dissard et al.
Title Page
Abstract Introduction
Conclusions References
Tables Figures
◭ ◮
◭ ◮
Back Close
Full Screen / Esc
Printer-friendly Version Interactive Discussion
Discussion
P
a
per
|
Dis
cussion
P
a
per
|
Discussion
P
a
per
|
Discussio
n
P
a
per
|
Biogeosciences Discuss., 9, 5969–6014, 2012 www.biogeosciences-discuss.net/9/5969/2012/ doi:10.5194/bgd-9-5969-2012
© Author(s) 2012. CC Attribution 3.0 License.
Biogeosciences Discussions
This discussion paper is/has been under review for the journal Biogeosciences (BG). Please refer to the corresponding final paper in BG if available.
Light and temperature e
ff
ect on
δ
11
B and
B/Ca ratios of the zooxanthellate coral
Acropora
sp.: results from culturing
experiments
D. Dissard1,2, E. Douville2, S. Reynaud3, A. Juillet-Leclerc2, P. Montagna4, P. Louvat5, and M. McCulloch1
1
School of Earth and Environment, The University of Western Australia, 35 Stirling Highway Crawley WA 6009, Perth, Australia
2
Laboratoire des Sciences du Climat et de l’Environnement, LSCE/IPSL, UMR 8212 UVSQ-CNRS-CEA. B ˆat. 12, Av. de la Terrasse, 91198 Gif sur Yvette, France 3
Centre Scientifique de Monaco, Avenue Saint-Martin, 98000, Monaco 4
Institute of Marine Sciences – National Research Council, ISMAR-CNR, Via Gobetti 101 40129 Bologna, Italy
5
BGD
9, 5969–6014, 2012Impact of light and temperature on coral
Boron incorporation
D. Dissard et al.
Title Page
Abstract Introduction
Conclusions References
Tables Figures
◭ ◮
◭ ◮
Back Close
Full Screen / Esc
Printer-friendly Version Interactive Discussion
Discussion
P
a
per
|
Dis
cussion
P
a
per
|
Discussion
P
a
per
|
Discussio
n
P
a
per
|
Received: 26 April 2012 – Accepted: 1 May 2012 – Published: 25 May 2012
Correspondence to: D. Dissard ([email protected])
BGD
9, 5969–6014, 2012Impact of light and temperature on coral
Boron incorporation
D. Dissard et al.
Title Page
Abstract Introduction
Conclusions References
Tables Figures
◭ ◮
◭ ◮
Back Close
Full Screen / Esc
Printer-friendly Version Interactive Discussion
Discussion
P
a
per
|
Dis
cussion
P
a
per
|
Discussion
P
a
per
|
Discussio
n
P
a
per
|
Abstract
The boron isotopic composition (δ11B) of marine carbonates (e.g. corals) has been established as a reliable proxy for paleo-pH, with the strong correlation betweenδ11B of marine calcifiers and seawater pH being now well documented. However, further investigations are needed in order to better quantify other environmental parameters
5
potentially impacting boron isotopic composition and boron concentration into coral aragonite. To achieve this goal the tropical scleractinian coral Acropora sp. was cul-tured under 3 different temperature (22, 25 and 28◦C) and two light conditions (200 and 400 µmol photon m−2s−1). Theδ11B indicates an internal increase in pH from am-bient seawater under both light conditions. Changes in light intensities from 200 to
10
400 µmol photon m−2 s−1
could bias pH reconstructions by about 0.05 units. For both light conditions, a significant impact of temperature onδ11B can be observed between 22 and 25◦C corresponding to enhancements of about 0.02 pH-units, while no further
δ11B increase can be observed between 25 and 28◦C. This non-linear temperature effect complicates the determination of a correcting factor. B/Ca ratios decrease with
15
increasing light, confirming the decrease in pH at the site of calcification under en-hanced light intensities. When all the other parameters are maintained constant, boron concentrations in Acropora sp. increase with increasing temperature and increasing carbonate ions concentrations. These observations contradict previous studies where B/Ca in corals was found to vary inversely with temperature suggesting that the
control-20
ling factors driving boron concentrations have not yet been adequately identified and might be influenced by other seawater variables and species specific responses.
1 Introduction
Increased atmospheric CO2 concentrations from 280 (pre-industrial values) to 380 ppmv (actual) have decreased surface ocean pH by approximately 0.1 unit (Orr
25
BGD
9, 5969–6014, 2012Impact of light and temperature on coral
Boron incorporation
D. Dissard et al.
Title Page
Abstract Introduction
Conclusions References
Tables Figures
◭ ◮
◭ ◮
Back Close
Full Screen / Esc
Printer-friendly Version Interactive Discussion
Discussion
P
a
per
|
Dis
cussion
P
a
per
|
Discussion
P
a
per
|
Discussio
n
P
a
per
|
(IPCC, 2007), suggest a further decrease of 0.3 pH units by the end of the century (Caldeira and Wickett, 2003, 2005), with poorly known consequences on marine envi-ronments and ecosystems (Gattuso and Hanson, 2011). Knowledge of seawater car-bonate ion concentration ([CO23−]) and pH provides crucial insights into the ocean’s role in regulating the global carbon cycle. However, unlike other key climatic indices such
5
as temperature and salinity, seawater pH has, until recently, seldom been recorded in marine observations, and hence the need for a reliable proxy record to increase the accuracy of reconstructing pH. The boron isotopic composition (δ11B) of marine carbonates has been established as a proxy for paleo-pH (e.g., Spivack et al., 1993; Palmer and Pearson, 2003; Pelejero et al., 2005; H ¨onisch et al., 2008, 2009; Wei et
10
al., 2009; Douville et al., 2010), with its reliability being validated by species specific calibrations (e.g., Trotter et al., 2011).
Boron dissolved in seawater is mainly present in the form of boric acid (B(OH)3) and borate ion (B(OH)−
4) and their relative abundance is strongly pH dependent (Hershey et al., 1986). Because of the isotopic equilibrium fractionation between the two
aque-15
ous boron species, the isotopic compositions of boric acid and borate ion are also pH dependent. Based on the observation that modern marine carbonates reflect the iso-topic composition of borate, Vengosh et al. (1991) proposed the following mechanism for boron substitution in the CO23− site in carbonate:
CaCO3+B(OH)−
4=Ca(HBO3)+HCO−3+H2O
20
The pKB value (stoichiometric equilibrium constant between B(OH)3 and B(OH)−4 in seawater) determined by Dickson (1990) has been confirmed by Roy et al. (1993). The fractionation factor (α) between the two aqueous boron species has been a subject of much debate (Zeebe et al., 2005). Recently, using a spectrophotometric approach, Klochko et al. (2006) determined thatα in seawater has a value of 1.0272±0.0006
25
(Salinity=35, BoronTotal=0.01 mol kg− 1
BGD
9, 5969–6014, 2012Impact of light and temperature on coral
Boron incorporation
D. Dissard et al.
Title Page
Abstract Introduction
Conclusions References
Tables Figures
◭ ◮
◭ ◮
Back Close
Full Screen / Esc
Printer-friendly Version Interactive Discussion
Discussion
P
a
per
|
Dis
cussion
P
a
per
|
Discussion
P
a
per
|
Discussio
n
P
a
per
|
recently raised by two studies, which measured proportions of boric acid in coral arag-onite varying from 12 to 48 % (Klochko et al., 2009; Rollion-Bard et al., 2011). Because the incorporation of such proportions of boric acid would shift the boron isotopic com-position of coral skeletons to considerably higher values, it appears unlikely that the trigonal B(OH)−
3 species detected in calcite and aragonite is directly derived from
sea-5
water. Recently, Tossell et al. (2005) and Klochko et al. (2009) have pointed out the possibility of a “chemosorption stage” where B(OH)CO−3 isomers may form on the sur-face before breaking down into either BO3 or BO4 in natural carbonates. In turn, this may result in internal boron isotope redistribution which would allow both BO3 and BO4to be incorporated while preserving the internal (site of calcification)δ11B isotopic
10
composition. The biologically-mediated pH regulation at the site of calcification, via seawater isolation and active modification, likely superimposes a biological regulation and accounts for the observed species-specific isotopic signatures.
So far, no light effect has been reported to impact boron isotopic composition on aragonitic corals (H ¨onisch et al., 2004). However, variations in light are known to impact
15
symbiont algae photosynthesis and calcification rate (Dubinski et al., 1983; Gattuso et al., 1999; Reynaud et al., 2004; Juillet-Leclerc et al., 2012), which in turn might significantly impact the carbonate chemistry of the micro-environment and therewith the B isotopic composition. This highlights the need for species-specific calibrations in order to better understand the controlling factors ofδ11B in biogenic carbonates.
20
Alternatively, the recognition of the importance to perform accurate pH reconstruction has warranted the use of a multi-proxy approach to resolve past deep-water [CO23−]. Recently, Yu and Elderfield (2007) and Yu et al. (2007) proposed that the B/Ca ratio in foraminiferal calcite can be use as a proxy for seawater [CO23−]. The basic assump-tion behind this proxy is that the B/Ca ratio in foraminifera is a funcassump-tion of the ratio of
25
[B(OH)−
BGD
9, 5969–6014, 2012Impact of light and temperature on coral
Boron incorporation
D. Dissard et al.
Title Page
Abstract Introduction
Conclusions References
Tables Figures
◭ ◮
◭ ◮
Back Close
Full Screen / Esc
Printer-friendly Version Interactive Discussion
Discussion
P
a
per
|
Dis
cussion
P
a
per
|
Discussion
P
a
per
|
Discussio
n
P
a
per
|
can be made at present for aragonitic corals. On the contrary, several studies have reported that the B/Ca ratio in tropical and temperate corals can be robust at docu-menting SST variations in certain locations (e.g., Hart and Cohen, 1996; Sinclair et al., 1998; Fallon et al., 1999, 2003; Montagna et al., 2007). Nevertheless, after measuring B concentrations in tropicalPorites sp. coral cores from the Great Barrier Reef, Fallon
5
et al. (2003) concluded that coral B/Ca ratio had to be influenced by factors other than temperature. Further investigations are therefore needed in order to better understand the parameters regulating the boron concentration into coral aragonite.
In this study, we present the boron isotopic composition (δ11B) and the elemental ratio (B/Ca) measured on the zooxanthellate coralAcroporasp., cultured under three
10
different temperature conditions (22, 25 and 28◦C) and two light intensities (200 and 400 µmol photon m−2s−1) corresponding to annual variations observed in Noum ´ea la-goon where the colonies were collected. Newly formed aragonite was analysed for boron isotopes using Multi Collector-Inductively Coupled Plasma Mass Spectrometry (MC-ICPMS), and for B/Ca ratios by Inductively Coupled Plasma-Quadrupole Mass
15
Spectrometry (ICP-QMS).
2 Material and method
2.1 Experimental set-up
The culturing experiment was performed at the Scientific Centre of Monaco (CSM). The tropical branching zooxanthellate coralAcroporasp. was chosen for its strong aptitude
20
to grow under culture condition and its large representation throughout the world coral communities.
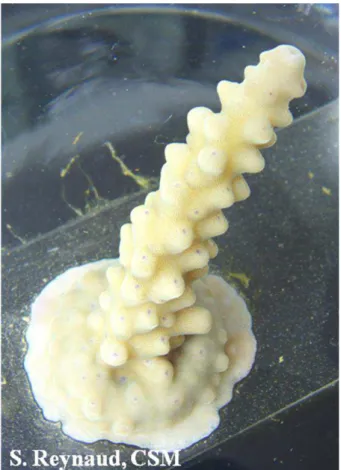
Culture experiments were conducted following the protocol described by Reynaud et al. (1999), in which tips were sampled from a single parent colony, adhered onto slides (2.6×6×0.2 cm, see Fig. 1) using underwater epoxy (Devcon®), and randomly
25
BGD
9, 5969–6014, 2012Impact of light and temperature on coral
Boron incorporation
D. Dissard et al.
Title Page
Abstract Introduction
Conclusions References
Tables Figures
◭ ◮
◭ ◮
Back Close
Full Screen / Esc
Printer-friendly Version Interactive Discussion
Discussion
P
a
per
|
Dis
cussion
P
a
per
|
Discussion
P
a
per
|
Discussio
n
P
a
per
|
deposited on the side was removed with a scalpel, dried overnight at room temperature, and stored in containers pending geochemical analyses. By sampling only the mate-rial covering the slide, this method allows easy collection of newly formed aragonite, ensuring it was precipitated under the targeted culture conditions. The experimental tanks were continuously supplied with Mediterranean seawater (salinity 38) pumped
5
from 55 m depth and heated at a constant temperature (21 or 27◦C) in two common tanks maintained under ambientpCO2(pCO2≈390 ppm), prior to flowing into the cul-ture aquaria (Rena®pump, 6 l min−1
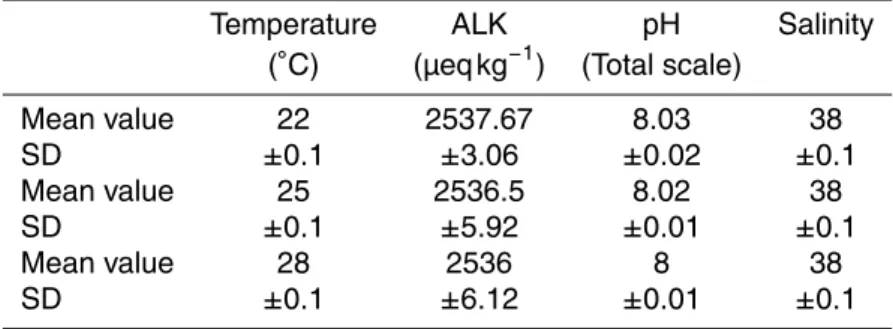
). The seawater renewal rate in each tank was ap-proximately five times a day. Light was provided by metal halide lamps (Phillips HPIT, 400 W), on a 12 h : 12 h light dark photo period. Irradiance was measured once a week
10
using a 4πquantum sensor (Li-Cor, LI-193SA) (Table 1). The culture temperature was controlled to within±0.1◦C using a temperature controller (EW, PC 902/T). Temper-ature and light intensities were chosen to mimic average annual variations in natural environments where the Acropora sp. parent colonies originated (Noum ´ea lagoon in winter: 200 µmol photon m−2s−1, 22◦C; and summer: 400 µmol photon m−2s−1, 28◦C,
15
Quinn and Sampson, 2002). Salinity, pH and total alkalinity (TA) were measured di-rectly within the culture tanks (Table 1, all pHT values in this manuscript are reported in Total scale). pH was measured using a glass combination electrode (Orion 8103SC) calibrated on the Total Scale using Tris/HCl and 2-aminopyridine/HCl Buffer solutions with a salinity of 38 and prepared according to Doe (1994) (accuracy±0.003 pH units).
20
For TA measurements, seawater samples were filtered through 0.45 mm membranes, poisoned with Mercury Chloride and stored in a cool and dark place pending analy-ses (Doe, 1994). TA was determined using a titration system (TIAMO, TITRANDO 888, Metrohm), with a reproducibility of 3 µmol kg−1. Salinity was measured using a conduc-timeter (HQ14, Hach Lange). Due to the strong seawater renewal rate in the culture
25
BGD
9, 5969–6014, 2012Impact of light and temperature on coral
Boron incorporation
D. Dissard et al.
Title Page
Abstract Introduction
Conclusions References
Tables Figures
◭ ◮
◭ ◮
Back Close
Full Screen / Esc
Printer-friendly Version Interactive Discussion
Discussion
P
a
per
|
Dis
cussion
P
a
per
|
Discussion
P
a
per
|
Discussio
n
P
a
per
|
slides could not fit in the incubating chamber, therefore, all metabolic measurements such as respiration, photosynthesis, and calcification rate were conducted simultane-ously on small fragments from the same parent colony hung on nylon wire (Al-Moghrabi et al., 1993) and cultured under similar conditions.
2.2 Experimental protocol
5
Nubbins sampled from a singleAcroporasp. parent colony were adhered onto slides and associated individually to a coral fragment hung on nylon wire for metabolic mea-surements. The culture experiment was conducted following a three steps protocol. Step 1: All the nubbins were cultivated in the same aquarium at constant temperature (25◦C) and light conditions (200 µmol photon m−2s−1). This step lasted for 9 weeks and
10
is considered as the acclimation period. Step 2: The nubbins were subsequently ran-domly distributed within six tanks under six different conditions (200, 22; 200, 25; 200, 28; 400, 22; 400, 25 and 400, 28), where the first number indicates the light intensity (µmol photons m−2s−1) and the second one the temperature (◦C). This second step, which is considered as the experiment itself, lasted for 15 weeks. At the end of step
15
2, all the newly precipitated aragonite forming a ring on the slide (lateral growth) was carefully collected with a scalpel, and all nubbins were placed under identical culture conditions (200 µmol photon m−2s−1, 25◦C) for step 3. This ensured the secretion of new skeleton through identical biological regulation (same organism) but allowing dif-ferentiation of aragonite precipitated during step 2 from step 3. Step 3 is referred to as
20
“recovery period” in the following manuscript and lasted for ten additional weeks.
2.3 Metabolic measurements
Photosynthesis and respiration were measured once a month using the respirometry technique, which consists in monitoring the changes in oxygen concentration during incubation time. Each fragment of coral hung on nylon wire was placed in a
respiro-25
BGD
9, 5969–6014, 2012Impact of light and temperature on coral
Boron incorporation
D. Dissard et al.
Title Page
Abstract Introduction
Conclusions References
Tables Figures
◭ ◮
◭ ◮
Back Close
Full Screen / Esc
Printer-friendly Version Interactive Discussion
Discussion
P
a
per
|
Dis
cussion
P
a
per
|
Discussion
P
a
per
|
Discussio
n
P
a
per
|
corresponding to the culture conditions. The nubbins were subsequently placed in the dark for 20 min to measure the respiration rate and then returned to the culture aquarium. The medium was continuously agitated during measurements using a mag-netic stirrer, and replaced after each incubation. The respirometric chamber was ther-mostated to be kept at constant temperature. All incubations took place between 08:00
5
and 14:00 LT. Oxygen concentration was monitored in the chamber using an oxygen electrode (Strathkelvin 928) calibrated daily against air-saturated seawater (100 %) and a nitrogen-bulled (zero oxygen). Rates of net photosynthesis and respiration were es-timated using a linear regression of O2 against time. Photosynthesis and respiration values were then normalized to the skeletal surface area estimated using the wax
tech-10
nique (Simson and Kenzie, 1991). In order to determine calcification rates, corals were weighted once a week using the buoyant weight technique (Jokiel et al., 1978; Davies, 1989). Calcification rate were calculated using the following formula:
G= n
s
Pn
P0 −1
Where G is the calcification rate, n is the number of the culture days, Pn is the dry
15
weight after 15 days of culture andP0is the initial dry weight.
2.4 Geochemical measurements
For each experimental condition, elemental and isotopic measurements were per-formed on two replicates, except for condition 400, 28, where values presented are the average of three replicates.
20
2.4.1 Boron isotopes measurements
BGD
9, 5969–6014, 2012Impact of light and temperature on coral
Boron incorporation
D. Dissard et al.
Title Page
Abstract Introduction
Conclusions References
Tables Figures
◭ ◮
◭ ◮
Back Close
Full Screen / Esc
Printer-friendly Version Interactive Discussion
Discussion
P
a
per
|
Dis
cussion
P
a
per
|
Discussion
P
a
per
|
Discussio
n
P
a
per
|
Neptune) at the Institut de Physique du Globe de Paris (IPGP, France), following the protocol described by Douville et al. (2010) that includes a chemical separation of boron before its measurement. Direct injection high efficiency nebuliser (d-DIHEN) was used for sample introduction (Louvat et al., 2011). The direct injection technique allowed a strong reduction of the analytical blank contribution (lower than 0.5 ‰ of the sample
5
signal for each isotope). Instrumental mass fractionation and drift of the11B/10B ra-tio with time was corrected by standard-sample-standard bracketing. Each sample was measured three times successively, with resulting relative standard deviation being sys-tematically in agreement with the external reproducibility of 0.25 ‰ (2σ) deduced from repeated analyses of boric acid standard NBS-951 and North Atlantic Seawater
Stan-10
dard NASS-V (Louvat et al., 2011; Douville et al., 2010). Meanδ11B values measured on standards chemically prepared by following identical procedures than those applied to samples were: 39.53±0.11 ‰, 24.42±0.10 ‰ and 0.14±0.20 ‰ at 2σfor NASS-V, JCp-1 and NBS 981, respectively. These isotopic compositions are well comparable with the recently published values of Foster et al. (2010) and Wang et al. (2010).
15
2.4.2 Boron concentrations
B/Ca concentrations were determined using quadrupole ICP-MS XseriesII (Thermo Fisher Scientific) at the Laboratoire des Sciences du Climat et de l’Environnement (LSCE, France). Analyses were calibrated against carbonate standards JCp-1 (coral), JCt-1 (clam) and Aragonite AK. Sample and standard solutions were systematically
20
adjusted to 100 ppm Ca through dilution, in order to (1) avoid dominant Ca signal in-creasing salt deposition on cones and affecting therewith ICP-MS stability, and (2) ad-just the Ca concentrations being introduced in the ICP-QMS, allowing control of Ca matrix effects on trace elements analysis (Harding et al., 2006; Bourdin et al., 2011). To monitor and correct for instrumental drift, standards JCp-1 and JCt-1, and Aragonite
25
BGD
9, 5969–6014, 2012Impact of light and temperature on coral
Boron incorporation
D. Dissard et al.
Title Page
Abstract Introduction
Conclusions References
Tables Figures
◭ ◮
◭ ◮
Back Close
Full Screen / Esc
Printer-friendly Version Interactive Discussion
Discussion
P
a
per
|
Dis
cussion
P
a
per
|
Discussion
P
a
per
|
Discussio
n
P
a
per
|
B/Ca measurements of the JCp-1 standard, analytical uncertainties were calculated to be 3 % at 2σ(Douville et al., 2010), with a mean value of 459 µmol mol−1. These results are in good agreement with the previously published value of Okai et al. (2004).
3 Results
3.1 Metabolic measurements
5
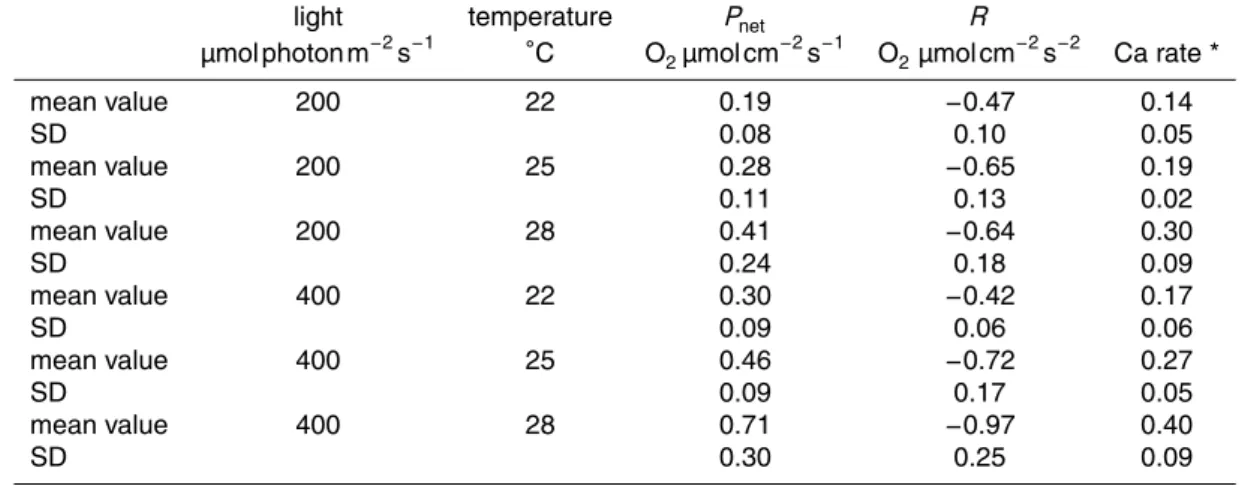
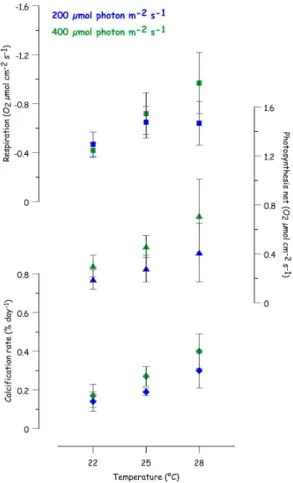
All nubbins survived the experiment despite the variations in light and temperature. Metabolic rates (respiration, photosynthesis and calcification) were monitored for each experimental condition in order to assess the impact of these two environmental pa-rameters on coral growth (Fig. 2, Table 2). The values plotted in Fig. 2 are averaged measurements, per experimental conditions, performed on all nubbins hung on nylon
10
wire and cultured during 15 weeks.
The increase in both temperature and light induces an enhancement of the calcifica-tion rate. A linear increase of the calcificacalcifica-tion rate with temperature is observed under both LL and HL conditions.
Net photosynthesis was significantly influenced by light and temperature (ANOVA,
15
P =0.004 and P =0.001, respectively), with no interaction between the two factors (ANOVA, P =0.4). For the three temperatures considered in this study (22, 25 and 28◦C), photosynthesis rates are always significantly higher under HL compared to LL conditions.
Although results appear less straightforward, respiration rates were also affected by
20
light and temperature (ANOVA, P =0.0050 and P <0.00001, respectively), with an interaction between the two parameters (P =0.0012). Under HL conditions, a linear increase of the respiration rate is observed with increasing temperature. Under LL con-ditions, an increase is observed between 22 and 25◦C. No further enhancement is observed between 25 and 28◦C. While no significant change is observed at 22◦C
be-25
BGD
9, 5969–6014, 2012Impact of light and temperature on coral
Boron incorporation
D. Dissard et al.
Title Page
Abstract Introduction
Conclusions References
Tables Figures
◭ ◮
◭ ◮
Back Close
Full Screen / Esc
Printer-friendly Version Interactive Discussion
Discussion
P
a
per
|
Dis
cussion
P
a
per
|
Discussion
P
a
per
|
Discussio
n
P
a
per
|
respiration rate at 25 and 28◦C. As previously observed for the calcification rate, the impact of light on both photosynthesis and respiration rates increases with increasing temperatures.
3.2 Boron isotopes measurements
The boron isotope compositions measured on the two replicates per experimental
con-5
ditions (except for condition 400, 28, where three replicates were considered) were av-eraged for each experimental condition and plotted against temperature (Fig. 3). The meanδ11B vary from 21.76 to 23.19 ‰ (T =22–28◦C, pH
T=8.02±0.02,S=38±0.1 and light conditions: 200–400 µmol photon m−2s−1, Table 3).
For the three temperature regimes, boron isotope compositions show a significant
10
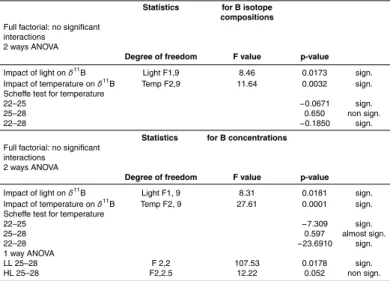
decrease with increasing light (2 ways ANOVA F1,9=8.46, p=0.0173, see Table 4). When increasing light intensities from 200 to 400 µmol photon m−2s−1, boron isotope compositions measured in our study, show a decrease of 0.4, 0.6 and 0.5 ‰ for 22, 25 and 28◦C, respectively (Table 3). These decreases can be considered statistically similar for each temperature condition (Table 4).
15
Boron isotope compositions show a significant increase with increasing temperature between 22 and 25◦C for both light conditions (SCHEFFE test 22–25◦C,p=−0.0671, Table 4). Measuredδ11B varied between 22.16±0.42 ‰ (22◦C) and 23.10±0.22 ‰ (25◦C) under LL, and between 21.76
±0.20 ‰ (22◦C) and 22.50±0.40 ‰ (25◦C) un-der HL conditions (pHT≈8.02). For temperature between 25 and 28◦C no significant
20
variation of the δ11B could be observed, for any of the light conditions (SCHEFFE test 25–28◦C,p=0.650, Table 4).δ11B was measured to vary from 23.10
±0.22 ‰ at 25◦C to 23.19±0.61 ‰ at 28◦C (at 200 µmol photon m−2s−1) and from 22.50±0.40 ‰ at 25◦C to 22.67± 0.20 ‰ at 28◦C (at 400 µmol photon m−2s−1), with pHT≈8.02 for both conditions.
25
BGD
9, 5969–6014, 2012Impact of light and temperature on coral
Boron incorporation
D. Dissard et al.
Title Page
Abstract Introduction
Conclusions References
Tables Figures
◭ ◮
◭ ◮
Back Close
Full Screen / Esc
Printer-friendly Version Interactive Discussion
Discussion
P
a
per
|
Dis
cussion
P
a
per
|
Discussion
P
a
per
|
Discussio
n
P
a
per
|
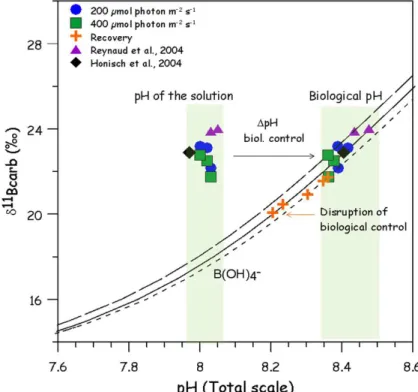
0.0006,δ11Bseawater=39.61 ‰ and BT=416 µM) are plotted on the same graph. The difference between medium and reconstructed pH is illustrated by the arrow and re-ferred to as∆pH biological control.
Two other studies report on δ11B measured on Acropora sp. cultured un-der similar conditions. H ¨onisch et al. (2004) measured δ11B values of
Acro-5
pora nobilis of about 22.9 ‰ (T =27◦C, pH
T=7.97, and light condition of 300±15 µmol photon m−2s−1), while Reynaud et al. (2004) report δ11B of Acrop-ora sp. varying between 24.0 and 23.9 ‰ (T =25–28◦C, pHT=8.03–8.05, S=38 and light=380±20 µmol photons m−2s−1). For comparison, theδ11B data of Reynaud et al. (2004) and H ¨onisch et al. (2004) are plotted versus pH on Fig. 4. For similar
am-10
bient pCO2 conditions, boron isotope compositions are comparable for Acropora sp. andAcropora nobilis.This observation is of great interest asδ11B was measured with MC-ICPMS in our study, while H ¨onisch et al. (2004) and Reynaud et al. (2004) used the N-TIMS (Negative Thermo-Ionazation Mass Spectrometry) approach. Therefore, in light of our results it appears that results obtained by MC-ICPMS and N-TIMS analytical
15
techniques are comparable and allow accurate and reproducibleδ11B measurements of aragonitic corals.
Boron isotope composition measured on nubbins after the end of step 3 (200 µmol photons m−2s−1, 25◦C), displayed strong scattering with lower values vary-ing from 20.07 to 21.73 ‰ (Table 3, Figs. 3 and 4). No straightforward pattern of these
20
values with the experimental conditions of step 2 could be observed.
3.3 Elemental concentrations
The mean coral B/Ca ratios obtained for each experimental condition (step 2) are plot-ted in Fig. 5a. Values vary between 460 and 512 µmol mol−1(Table 3, Fig. 5a).
B/Ca ratios show a significant decrease with increasing light (2 ways ANOVA
25
BGD
9, 5969–6014, 2012Impact of light and temperature on coral
Boron incorporation
D. Dissard et al.
Title Page
Abstract Introduction
Conclusions References
Tables Figures
◭ ◮
◭ ◮
Back Close
Full Screen / Esc
Printer-friendly Version Interactive Discussion
Discussion
P
a
per
|
Dis
cussion
P
a
per
|
Discussion
P
a
per
|
Discussio
n
P
a
per
|
512±4 µmol mol−1 under LL and 455±5, 478±7 and 487±10 µmol mol−1 under HL for 22, 25 and 28◦C, respectively.
Increasing temperature induces an increase in B concentrations between 22 and 25◦C, for both light conditions (SCHEFFE test 22–25◦C,p=−7.309, Table 4). A further enhancement can be observed between 25 and 28◦C under LL (one way ANOVA,
5
F2.2=107.53, p=0.0178) whereas no significant boron concentration increase can be considered between 25 and 28◦C under HL (one way ANOVA,F2,2.5=12.22, p= 0.052).
H ¨onisch et al. (2004) measured B/Ca ratios of Acropora nobilis from coral cultur-ing experiments of 54.3, 57.9 and 63.0 ppm of boron at pHT=8.17, 7.97 and 7.72,
10
respectively (T =27◦C, and light condition of 300±15 µmol photon m−2s−1). These re-sults, which correspond to B/Ca of 503.3, 531.9 and 593.2 µmol mol−1, respectively (using Ca=40%), are well comparable with our study for similarpCO2conditions (532 vs. 478 to 512 µmol mol−1, respectively). Similarly, B/Ca ratios measured onAcropora nobilis from natural environment have been measured to fluctuate between 474 and
15
612 µmol mol−1(Shirai et al., 2008) using similar ICP-MS facilities.
B/Ca ratios measured after the end of step 3 (recovery), vary between 416 and 446 µmol mol−1(Table 3, Fig. 5a). These values are lower than those measured at the end of step 2, independently of the light and temperature conditions considered.
For comparison, B/Ca ratios were plotted versus Sr/Ca ratios measured
simultane-20
BGD
9, 5969–6014, 2012Impact of light and temperature on coral
Boron incorporation
D. Dissard et al.
Title Page
Abstract Introduction
Conclusions References
Tables Figures
◭ ◮
◭ ◮
Back Close
Full Screen / Esc
Printer-friendly Version Interactive Discussion
Discussion
P
a
per
|
Dis
cussion
P
a
per
|
Discussion
P
a
per
|
Discussio
n
P
a
per
|
4 Discussion
4.1 Metabolic measurements
In our study, photosynthesis, respiration and calcification rates increase with both in-creasing light and temperature (Fig. 2, Table 2). These observations are in good agree-ment with numerous previous studies on tropical and temperate corals (e.g., Chalker
5
and Taylor, 1975; Coles and Jokiel, 1977; Jokiel and Coles, 1977; Dubinsky et al., 1983; Jacques et al., 1983; Reynaud-Vaganay et al., 2001; Al-Horani et al., 2003; Rodolfo-Metalpa et al., 2008).
Photosynthetic activity increases with increasing light for the three considered tem-peratures. Similar observations were already made for tropical corals which were
ob-10
served to change zooxanthellae density and/or pigment concentration in order to adapt to varying light levels (e.g., Falkowski and Dubinsky, 1981; Iglesias-Prieto and Trench, 1997). Photosynthetic activity also increases with increasing temperature under both light conditions. Due to potential bleaching of coral colonies with increasing tempera-ture, the impact of temperature on photosynthesis has been extensively studied. A
de-15
crease in photosynthetic efficiency is indeed often observed after a heat stress (e.g., Iglesias-Prieto et al., 1992; Warner et al., 1996, 1999; Hill et al., 2004). However, the temperature range in our study 22–28◦C can be considered as non stressful for trop-ical species likeAcroporasp. (e.g., Reynaud et al., 2003; Ferrier-Pages et al., 2007). Under such a temperature fluctuation, photosynthesis has been observed to increase
20
with increasing temperature (e.g., Kajiwara et al., 1995; Reynaud et al., 2003).
Under LL, respiration does not vary (Fig. 2), while under HL, it is linearly correlated with temperature. Kajiwara et al. (1995) already recorded such a behavior for Acrop-ora pulchra,which was interpreted as an increase in the algal respiration with raising temperature (Karako-Lampert et al., 2004). Although no difference can be observed at
25
BGD
9, 5969–6014, 2012Impact of light and temperature on coral
Boron incorporation
D. Dissard et al.
Title Page
Abstract Introduction
Conclusions References
Tables Figures
◭ ◮
◭ ◮
Back Close
Full Screen / Esc
Printer-friendly Version Interactive Discussion
Discussion
P
a
per
|
Dis
cussion
P
a
per
|
Discussion
P
a
per
|
Discussio
n
P
a
per
|
et al. (1995) calculated that coral respiration was 6 times higher under irradiance of 350 µmol m−2
s−1
than the dark respiration measured under identical conditions. Calcification is observed to increase with increasing light. This effect is commonly re-ferred as “light enhanced calcification” (LEC, Goreau, 1959; Chalker and Taylor, 1975; Barnes and Chalker, 1990). Although the mechanism is still not entirely understood,
5
it is clear that calcification and photosynthesis are related (see Sect. 4.2.3., Gattuso et al., 1999; Allemand et al., 2004; Moya et al., 2006). Calcification is also enhanced with temperature both at LL and HL, as previously observed for several species of corals (Coles and Jokiel, 1977, 1978; Reynaud et al., 2007).
Overall, the coral metabolic responses to varying environmental parameters (light
10
and temperature) are in agreement with observations previously made on corals from both culture experiments and natural environment. It can be considered that nubbins measured in this study were well acclimatized to culture conditions and should present geochemical signatures representative of the environmental parameters maintained in the culture conditions.
15
4.2 Boron isotope
Due to the important seawater renewal rate into our culture aquaria (5 times per day), seawater carbonate chemistry remained constant through the experiment, for all con-ditions (Table 1). Therefore, it is assumed that in our study the variation of the skeletal
δ11B reflects pH at the site of calcification (Trotter et al., 2011).
20
4.2.1 Boron isotopes compositions
MeasuredAcropora sp. δ11B versus measured ambient seawater pH are plotted rel-ative to the borate ion curves determined for each experimental temperature at 22, 25 and 28◦C using the fractionation factor determined by Klochko et al. (2006) α=
1.0272±0.0006 (salinity=35, BT=416 µM and δ 11
Bseawater=39.61 ‰, Fig. 4). The
25
BGD
9, 5969–6014, 2012Impact of light and temperature on coral
Boron incorporation
D. Dissard et al.
Title Page
Abstract Introduction
Conclusions References
Tables Figures
◭ ◮
◭ ◮
Back Close
Full Screen / Esc
Printer-friendly Version Interactive Discussion
Discussion
P
a
per
|
Dis
cussion
P
a
per
|
Discussion
P
a
per
|
Discussio
n
P
a
per
|
to an increase in pH of the site of calcification of about 0.36, 0.40 and 0.39 pH units under LL, and 0.33, 0.36 and 0.35 pH units under HL, for 22, 25 and 28◦C, respectively. These increases in pH are in good agreement with the recent study of Venn et al. (2011) onStylophora pistillatausing live tissue imaging. They measured a pH increase from 0.2 to 0.5 pH units above ambient seawater under the calicoblastic epithelium. Using
5
microsensors, Al-Moghrabi et al. (2001) and Al-Horani et al. (2003) measured a pH varying from 8.1 to 9.3 in the site of calcification of Galaxea fascicularis. Although this pH enhancement appears somewhat higher, those measurements remain com-patible with the internal pH values calculated in our study representing average values for calcification over ∼15 weeks (see methods). Hence, in contrast to the
microsen-10
sor or live tissue imaging approaches, which give instantaneous values, boron isotope provides an average of several daily cycles (weeks). Furthermore, species-specific up-regulation mechanisms may account for the observed differences (H ¨onisch et al., 2004; Krief et al., 2010; Trotter et al., 2011).
4.2.2 Light effect
15
To obtain a more reliable boron isotope pH proxy, it is critical to better quantify the “vital effect” superimposed by the coral on ambient seawater pH during calcification. It has been long known that light influences the rate of coral calcification. This ef-fect is commonly referred as “light enhanced calcification” (LEC) (e.g., Goreau, 1959; Chalker and Taylor, 1975; Barnes and Chalker, 1990). However, despite numerous
20
studies performed on the coral-zooxanthellae symbiotic relationship, the mechanisms linking photosynthesis of the symbionts to coral calcification remain largely unknown (e.g., Gattuso et al., 1999; Allemand et al., 2004; Moya et al., 2006). Modifications of carbonate chemistry inside the coelenterons have been hypothesized to be responsi-ble for (part of) the LEC processes. Following Moya et al. (2006), three mechanisms
25
BGD
9, 5969–6014, 2012Impact of light and temperature on coral
Boron incorporation
D. Dissard et al.
Title Page
Abstract Introduction
Conclusions References
Tables Figures
◭ ◮
◭ ◮
Back Close
Full Screen / Esc
Printer-friendly Version Interactive Discussion
Discussion
P
a
per
|
Dis
cussion
P
a
per
|
Discussion
P
a
per
|
Discussio
n
P
a
per
|
calcification by the OH− resulting from the carbon concentrating mechanism (CCM) (Furla et al., 1998); and 3) Production of H+ by calcification favouring CO2 formation easily absorbed by dinoflagellates, and therewith calcium carbonate precipitation (Mc-Connaughey and Whelan, 1997). Interestingly, the first two processes should induce an increase in pH of the extracellular site of calcification with light enhancement. On
5
the contrary, the third mechanism might lead to a decrease in pH with increasing light intensity, as more CO2should be released at the site of calcification.
To date, only a few studies have reported internal pH measurements of the coral site of calcification. Al-Moghrabi et al. (2001), Al-Horani et al. (2003) and Venn et al. (2011) all reported an increase in pH in the site of calcification under light vs. dark conditions,
10
independently of the analytical methods considered (e.g. microelectrodes, live tissue imaging). Moreover, Kuhl et al. (1995) measured a decrease in pH in the outer 0.1 mm of coral tissue (Faviasp.) with decreasing light intensities. However, to our knowledge, no study reports on variation in pH of coral site of calcification under various light intensities.
15
In our study, when translated into pH values, a light enhancement of 200 µmol photons m−2s−1 induces a decrease in pH of the site of calcification of about 0.03, 0.04 and 0.03 pH-units at 22, 25 and 28◦C, respectively (Table 3). Krief et al. (2010) observed a decrease in calcification rate together with an increase in tissue biomass (measured by protein concentration) forPoritessp. andStylophora
pis-20
tillatamaintained for 14 months under increasedpCO2conditions. They argue that the inverse response of skeleton deposition and tissue biomass to changingpCO2 condi-tions seems to be consistent with the hypothesis that calcification stimulates zooxan-thellae photosynthesis by enhancing CO2concentration within the coelenterons. Under highpCO2conditions, more CO2is available in the site of calcification rending less
en-25
BGD
9, 5969–6014, 2012Impact of light and temperature on coral
Boron incorporation
D. Dissard et al.
Title Page
Abstract Introduction
Conclusions References
Tables Figures
◭ ◮
◭ ◮
Back Close
Full Screen / Esc
Printer-friendly Version Interactive Discussion
Discussion
P
a
per
|
Dis
cussion
P
a
per
|
Discussion
P
a
per
|
Discussio
n
P
a
per
|
site of calcification is related to increased calcification and photosynthesis rates. How-ever, this appears to be more a consequence than a cause and does not explain the impact of light intensity on internal pH and calcification rates.
More recently, Al Horani (2005) argued that higher respiration rates stimulated by algal photosynthesis under enhanced light conditions, increase ATP availability and
5
therewith coral Ca2+ ATPase activity and calcification rates. This in turn could account for the increase in pH of the site of calcification measured in the light vs. dark con-ditions (Al-Horani et al., 2003; Venn et al., 2011). Increases in light intensities and consequently calcification rates should release more CO2 in the site of calcification, and decrease internal pH with increasing light, as measured in our study.
10
To date, H ¨onisch et al. (2004), is the only other study to report on the impact of light on coral boron isotope composition (Porites compressa). Although variation in light intensities considered in their study (from 540 to 1210 µmol photons m−2s−1) is 3 times greater than in our experiment,δ11B remained overall not affected. It might be argued than different species react differently to changes in light intensities, as for example the
15
slow calcifying massivePoritessp. might present differences in metabolic fractionation when compared with the fast-growing branchedAcropora sp. Nevertheless, it should be noted that the total duration of H ¨onisch et al. (2004) culturing experiments was 57 days, before which, five days were allocated to corals acclimation. In our study, corals were allowed for acclimation during 9 weeks (63 days), while the experiments
20
itself (step 2) lasted for 15 weeks (105 days). The length of the acclimation period and of the experiment can play a significant role as stressed corals may present disruption in metabolic control and therewith, differing isotopic signatures (see Sect. 4.2.5).
Our results indicate that pH at the site of calcification seems to be re-lated to photosynthetic rates. However, changes in light intensities from 200 to
25
BGD
9, 5969–6014, 2012Impact of light and temperature on coral
Boron incorporation
D. Dissard et al.
Title Page
Abstract Introduction
Conclusions References
Tables Figures
◭ ◮
◭ ◮
Back Close
Full Screen / Esc
Printer-friendly Version Interactive Discussion
Discussion
P
a
per
|
Dis
cussion
P
a
per
|
Discussion
P
a
per
|
Discussio
n
P
a
per
|
photosynthetic activities do not significantly compromiseδ11B-pH reconstructions for tropical corals. Due to analytical but also sampling bias, paleo-pH reconstructions are still broadly limited to a precision no better than≈0.05 pH-units. Therefore, variations in light intensities on pH reconstructions can be considered as negligible. Our results thus confirm the general veracity of theδ11B-pH proxy and as well as providing new
5
insights on the mechanism of internal pH regulation in corals.
4.2.3 Temperature effect
In our study,δ11B increases with increasing temperature between 22 and 25◦C. When considering analytical uncertainties/reproducibility (from 0.20 to 0.42 ‰), theseδ11B in-creases of 0.94 (LL) and 0.74 ‰ (HL), remain small but statistically significant (Table 4)
10
and correspond to enhancements of 0.027 and 0.016 pH units in the site of calcifica-tion, respectively. However, no significant variations can be observed between 25 and 28◦C withδ11B varying from 0.09 (LL) and 0.17 ‰ (HL) (Fig. 3, Tables 3 and 4). These results differ from our metabolic data, which show a linear increase in calcification rate with increasing temperature for both light conditions (R2=0.95 and 0.99 for LL and
15
HL, respectively). As mentioned above, corals can enhance pH under the calicoblas-tic epithelium (e.g., Venn et al., 2011). A mechanism involving the removal of protons from the site of calcification via Ca2+ATPase was proposed to be responsible for the observed pH increase (Cohen and McConnaughey, 2003; McConnaughey and Whe-lan, 1997; Al-Horani et al., 2003). Ip et al. (1991) and Isa et al. (1994) demonstrated the
20
existence of a Ca2+ATPase activity in the homogenates of coral tissues. Subsequently, McConnaughey and Whelan (1997) suggested that the protons generated during cal-cification were removed by a Ca2+ATPase activity, resulting in a pH enhancement (and therewith increase in [CO23−]) and Ca2+ concentration of coral site of calcification. Zoc-cola et al. (2004) localized a Ca2+ATPase in the epithelium of Stylophora pistillata,
25
BGD
9, 5969–6014, 2012Impact of light and temperature on coral
Boron incorporation
D. Dissard et al.
Title Page
Abstract Introduction
Conclusions References
Tables Figures
◭ ◮
◭ ◮
Back Close
Full Screen / Esc
Printer-friendly Version Interactive Discussion
Discussion
P
a
per
|
Dis
cussion
P
a
per
|
Discussion
P
a
per
|
Discussio
n
P
a
per
|
More recently, Herfort et al. (2008) reported that additions of NaHCO3 to synthetic seawater, proportionally increased the calcification rate ofAcropora sp. until the con-centration exceeded four times that of seawater (8 mM). These observations indicate that the concentrations of carbonate species ([HCO−3] and/or [CO23−]) rather than cal-cium, are the limiting factor of coral calcium carbonate precipitation. By definition, CO2
5
is more soluble in cold water. Hence, an increase in temperature leads to a decrease in [CO2(aq)] and a subsequent decrease in [HCO−3] and increase in [CO23−] (for in-stance, under similar conditions an increase in temperature from 5◦C to 25◦C leads to a [CO23−] increase of 90 %). In turn, this might explain why, within a certain species-specific temperature range, coral calcification rates have been observed to increase
10
with increasing temperature (e.g., Coles and Jokiel, 1977, 1978; Reynaud et al., 2007). Moreover, if temperature can influence carbonates availabilities as a result of chemical re-equilibration, for corals operating below their thermal optimum, increased temper-ature was also suggested to enhance zooxanthellae photosynthesis and thereby in-crease the pH of the site of calcification (McConnaughey and Whelan, 1997; Al-Horani
15
et al., 2003).
Linear increase in calcification rates with increasing temperature observed in our study agrees with these hypotheses. Nevertheless, if the internal pH reconstructed from boron isotopic signature shows an increase between 22 and 25◦C, no signifi-cant pH enhancement can be observed between 25 and 28◦C. Our data may thus
20
suggest that once the pH and hence the carbonate saturation state of the aragonite (Ω) in the site of calcification passes a certain threshold value (independently whether the carbonate enrichment is a result of a metabolic and/or chemical process), the en-zyme system works at a constant rate, which does not require any further pH increase and therewith becomes unreactive to additional temperature enhancement (in the
lim-25
BGD
9, 5969–6014, 2012Impact of light and temperature on coral
Boron incorporation
D. Dissard et al.
Title Page
Abstract Introduction
Conclusions References
Tables Figures
◭ ◮
◭ ◮
Back Close
Full Screen / Esc
Printer-friendly Version Interactive Discussion
Discussion
P
a
per
|
Dis
cussion
P
a
per
|
Discussion
P
a
per
|
Discussio
n
P
a
per
|
important SST changes have occurred. This non-linear temperature effect complicates the determination of a potential correcting factor.
4.2.4 Comparison impact of light vs. temperature
Herfort et al. (2008) reported that a dramatic increase inAcroporasp. calcification rates with increased [HCO−
3] of the growth media could be monitored in the dark, although
5
these were lower than in the light for a given [HCO−3]. They therefore concluded that cal-cification was light triggered but not light dependent. As mentioned previously, increase in calcification rate with increased light conditions has been suggested to increase CO2 concentration in the site of calcification (Al-Horani et al., 2003) and may account for the decrease in internal pH with increasing light intensities measured in our study. It could
10
be argued that the increase in calcification rate with increasing temperatures does not correspond to a decrease in δ11B and therewith in internal pH as observed under enhanced light conditions. However, one should keep in mind that these two environ-mental parameters might influence calcification on many different levels. Temperature, for example, is known to impact metabolic processes (e.g. enzyme activity), which in
15
turn might account for the observed differences in pH regulation. At this stage calcifica-tion mechanisms need to be better understood to fully quantify light and temperature effect onδ11B-pH proxy.
4.2.5 Boron isotope composition after recovery experiment
Boron isotopic composition determined at the end of step 3 (recovery period), does not
20
show any correlation with recovery period culture conditions (200 µmol photon m−2s−1, 25◦C). Moreover, no straightforward correlation between boron isotopic compositions measured at the end of step 3 can be made with any of the previous step 2 culture conditions. When translated into pH values using Klochko et al. (2006) fractionation factor, almost all boron isotopic composition measured at the end of step 3 present
25
BGD
9, 5969–6014, 2012Impact of light and temperature on coral
Boron incorporation
D. Dissard et al.
Title Page
Abstract Introduction
Conclusions References
Tables Figures
◭ ◮
◭ ◮
Back Close
Full Screen / Esc
Printer-friendly Version Interactive Discussion
Discussion
P
a
per
|
Dis
cussion
P
a
per
|
Discussion
P
a
per
|
Discussio
n
P
a
per
|
2 (from 8.35 to 8.42), independently of the light and temperature conditions considered (Table 3, Figs. 3 and 4). These results indicate that the mechanical breakage applied at the end of step 2 induced a significant stress to the organisms, which led to a disruption of pH enhancement at the site of calcification. In terms of proxy reconstruction this finding highlights the fact that corals submitted to strong stress factors (e.g. storms,
5
bleaching etc.) should not be considered for paleo-environmental reconstructions.
4.3 Boron concentrations
4.3.1 Light effect
B/Ca ratios show comparable trends thanδ11B to light variations although boron con-centrations and boron isotope compositions were measured following different sample
10
preparation and analytical techniques (ICP-QMS and MC-ICPMS, respectively). An in-crease in pH of the calcification site makes B(OH)4the dominant species in the site of calcification (Hershey et al., 1986; Hemming and Hanson, 1992), and the boron con-centration in the coral is proportional to the boron activity in the precipitating solution (Kitano et al., 1978; Vengosh et al., 1991; Hemming and Hanson, 1992). Therefore,
15
a decrease in pH of the site of calcification under increased light intensity should in-duce a decrease in [B(OH)−
4] and therewith lower B concentrations to be recorded in the coral aragonite. Our results confirm the decrease in pH at the site of calcification observed under enhanced light intensity.
4.3.2 Temperature effect
20
In our study, when all the other parameters are maintained constant, boron concentra-tions inAcroporasp. increase with increasing temperature and [CO23−]. So far, B/Ca in corals was found to vary inversely with temperature (Hart and Cohen, 1996; Sinclair et al., 1998; Fallon et al., 2003; Montagna et al., 2007; Allison et al., 2010; Trotter et al., 2011). To our knowledge, Trotter et al. (2011) is the only other study to report on the
BGD
9, 5969–6014, 2012Impact of light and temperature on coral
Boron incorporation
D. Dissard et al.
Title Page
Abstract Introduction
Conclusions References
Tables Figures
◭ ◮
◭ ◮
Back Close
Full Screen / Esc
Printer-friendly Version Interactive Discussion
Discussion
P
a
per
|
Dis
cussion
P
a
per
|
Discussion
P
a
per
|
Discussio
n
P
a
per
|
impact of temperature on B/Ca ratios of cultured shallow water corals. They cultured the Mediterranean coralCladocora caespitosaunder different temperature conditions and observed, in contradiction to our study, a negative correlation with seawater tem-perature. Nevertheless, in the experimental set-up used by Trotter et al. (2011), corals were not maintained under constant temperature conditions, but supplied with natural
5
unfiltered seawater following seasonal temperature fluctuations (for complete experi-mental protocol see Rodolfo-Metalpa et al., 2010). With the exception ofpCO2, which was held constant, irradiance as well as the photoperiod were changed according to their seasonal values measured at ca. 20 m depth in the Bay of Villefranche, where corals had been originally collected. Changes in food availability following seasonal
10
fluctuations as corals fed from the unfiltered sea-water, might also impact coral biology and therewith B incorporation. Therefore, B/Ca ratios measured by Trotter et al. (2011) might well follow changes in calcification, respiration and/or photosynthesis rates of the coral-symbiont assemblage, triggered by seasonal changes in temperature, light, and feeding regime, rendering difficult to unravel the impact of temperature from that
15
of other parameters that vary concomitantly.
Interestingly, Trotter et al. (2011) pointed out that the observed correlation of B/Ca with temperature seemed to be the result of the strong temperature dependence of seawater [B(OH−4)]/[CO23−]. In their study, increase in temperature correlates with in-creasing calcification rates (Rodolfo-Metalpa et al., 2010), inin-creasing seawater [CO2−
3 ]
20
(decreasing [B(OH−4)]/[CO23−]) and decreasing B/Ca ratios in the coral skeleton, while [B(OH−4)]/[HCO−3] remains insignificantly correlated to either B/Ca ratios or tempera-ture. Due to the relative proportion of [B(OH−4)] vs. [CO23−] and/or [HCO−3] in seawater, carbonate forms are expected to be the main driver of variations in [B(OH−
4)]/[CO 2− 3 ] and [B(OH−4)]/[HCO−3] ratios. In our study, increases in temperature from 22 to 28◦C
25
BGD
9, 5969–6014, 2012Impact of light and temperature on coral
Boron incorporation
D. Dissard et al.
Title Page
Abstract Introduction
Conclusions References
Tables Figures
◭ ◮
◭ ◮
Back Close
Full Screen / Esc
Printer-friendly Version Interactive Discussion
Discussion
P
a
per
|
Dis
cussion
P
a
per
|
Discussion
P
a
per
|
Discussio
n
P
a
per
|
(decrease in [B(OH−4)]/[CO23−]) but contrarily to Trotter et al. (2011), increase in B/Ca ratios in the coral skeleton. Interestingly, the influence of temperature on foraminifera B/Ca ratios is currently subject of debate.
For planktonic foraminifera for example, while certain studies report a positive re-lationship between the partition coefficient (KD=[(B/Ca)CaCO3]/[B(OH)−4/HCO
−
3]sw) and
5
temperature (Globorotalia inflata,Globigerina bulloidesfrom coretop samples, and Glo-bigerinoides ruberfrom downcore, Tripati et al., 2009; Yu et al., 2007), others observed a negativeKD–T (◦C) relationship (Globigerinoides sacculifer,G. ruber, and Neoglobo-quadrina dutertrei from coretop; Foster, 2008). Similarly, when B/Ca ratios increase with temperature inGloborotalia inflata(Yu et al., 2007), no temperature influence can
10
be observed onNeogloboquadrina pachyderma(sinistral) (Hendry et al., 2009). These observations suggest that the controlling factors and processes driving boron trans-port to the calcification site and its incorporation into marine calcium carbonates, have not yet been adequately identified. Additional species-specific experiments combining both culture experiment and natural environment samples are necessary to improve
15
our understanding and therewith the use of B/Ca as an environmental proxy.
4.3.3 B/Ca vs. Sr/Ca ratios
B/Ca ratios in corals have been reported to be well correlated with Sr/Ca ratios (Hart and Cohen, 1996; Sinclair et al., 1998; Fallon et al., 2003; Montagna et al., 2007; Allison et al., 2010). Sr/Ca in corals is considered to be primarily controlled by
sea-20
water temperature (Sinclair et al., 1998), following a negative correlation (e.g., Quinn and Sampson, 2002; Corr `ege, 2006; DeLong et al., 2007; Cohen and Thorrold, 2007; Goodkin et al., 2007). This agrees with our study where Sr/Ca ratio decreases with increasing temperature (R2=0.89; Interpretation of the Sr/Ca values will be presented elsewhere: Juillet-Leclerc et al., 2012). A strong negative correlation is observed
be-25
BGD
9, 5969–6014, 2012Impact of light and temperature on coral
Boron incorporation
D. Dissard et al.
Title Page
Abstract Introduction
Conclusions References
Tables Figures
◭ ◮
◭ ◮
Back Close
Full Screen / Esc
Printer-friendly Version Interactive Discussion
Discussion
P
a
per
|
Dis
cussion
P
a
per
|
Discussion
P
a
per
|
Discussio
n
P
a
per
|
These observations enlighten: (1) The significant impact of temperature on B (and Sr) concentrations when seawater pH is maintained constant; and (2) The (negatively) coupled incorporation of B and Sr intoAcroporasp.
4.3.4 B/Ca ratios after recovery experiment
Boron concentrations determined at the end of step 3, do not present any
correla-5
tion with growth culture conditions under which they grew during the 10 weeks of the recovery period (200 µmol photon m−2s−1, 25◦C). Also, no straightforward correlation between boron concentrations measured at the end of step 3 can be made with any of the previous step 2 culture conditions. B/Ca ratios measured after the recovery pe-riod are all significantly lower than those at the end of step 2, independently of the
10
experimental conditions considered (see Table 3). These results agree with the obser-vations made for boron isotope composition and tend to confirm that the mechanical stress applied to the coral between step 2 and step 3, led to a perturbation of the pH enhancement process at the site of calcification.
5 Conclusions
15
We investigated the impact of light and temperature on boron isotope composition and boron concentration of Acropora sp. skeleton from nubbins maintained under culture experiments. Metabolic measurements indicate that photosynthesis, respiration and calcification rates increase with increasing light and temperature. δ11B values indi-cate higher pH at the site of calcification compared to ambient seawater pH, both
20
under Low Light and High Light conditions. Changes in light intensities from 200 to 400 µmol photon m−2s−1could bias pH reconstructions by about 0.05 units. A increase of δ11B is observed between 22 and 25◦C, which corresponds to enhancements of 0.027 and 0.016 pH units at the site of calcification, for LL and HL, respectively. However, no further δ11B increase occurred between 25 and 28◦C. This non-linear
BGD
9, 5969–6014, 2012Impact of light and temperature on coral
Boron incorporation
D. Dissard et al.
Title Page
Abstract Introduction
Conclusions References
Tables Figures
◭ ◮
◭ ◮
Back Close
Full Screen / Esc
Printer-friendly Version Interactive Discussion
Discussion
P
a
per
|
Dis
cussion
P
a
per
|
Discussion
P
a
per
|
Discussio
n
P
a
per
|
temperature effect complicates the determination of a correcting factor, underlining the need of additional culture experiment to better calibrate the impact of temperature on the pH-δ11B proxy.
B/Ca ratios decrease with increasing light confirming the decrease in pH at the site of calcification under enhanced light intensities observed withδ11B signatures. When all
5
the other parameters are maintained constant, boron concentrations in Acropora sp. increase with increasing temperature and increasing carbonate ions concentrations. These observations contradict previous studies where B/Ca in corals was found to vary inversely with temperature. This suggests that the controlling factors driving boron concentrations have not yet been adequately identified and might be influenced by
10
other seawater variables and species specific responses.
Boron isotopic composition and boron concentrations determined at the end of step 3 do not present any correlation with environmental parameters of step 3 culture condi-tions (200 µmol photon m−2s−1, 25◦C) nor with any of the previous step 2 culture con-ditions. Nevertheless, when translated into pH, recovery boron isotopic compositions
15
and boron concentrations are all consistent with decreased pH values, independently of the light and temperature conditions considered. These results indicate that physical stress applied to the organisms before beginning of step 3 led to a disruption of the pH enhancement at the site of calcification. This highlights the fact that corals submitted to strong stress factors (e.g. storms, bleaching events etc.) should not be considered
20
for paleo-environmental reconstructions.
Acknowledgements. This work was supported by the CEA – CNRS and USVQ (national project INSU/ASTICO), and by Australian Research Council (ARC) grant DP0986505 and the ARC Centre of Excellence in Coral Reef Studies. It was also partially funded by the Framework 7 European Project on Ocean Acidification (EPOCA grant agreement number 211384). Paolo
25
Montagna is grateful for financial support from the Marie Curie International Outgoing Fellow-ship (MEDAT-ARCHIVES). This is LSCE contribution 4800. The authors would like to thank Guillaume Tisserand for his help with coral culturing experiments. We are grateful to Louise Bordier for helping with elemental and isotopic samples preparation and measurement, and Michael Holcomb for editing the manuscript and for his help with statistical issue.
BGD
9, 5969–6014, 2012Impact of light and temperature on coral
Boron incorporation
D. Dissard et al.
Title Page
Abstract Introduction
Conclusions References
Tables Figures
◭ ◮
◭ ◮
Back Close
Full Screen / Esc
Printer-friendly Version Interactive Discussion
Discussion
P
a
per
|
Dis
cussion
P
a
per
|
Discussion
P
a
per
|
Discussio
n
P
a
per
|
The publication of this article is financed by CNRS-INSU.
References
Al-Horani, F. A.: Effects of changing seawater temperature on photosynthesis and calcification
5
in the scleractinian coralGalaxea fascicularis, measured with O2, Ca2+and pH microsensors, Sci. Mar., 69, 347–354, 2005.
Al-Horani, F. A., Al-Moghrabi, S. M., and de Beer, D.: Microsensor study of photosynthesis and calcification in the scleractinian coral, Galaxea fascicularis: active internal carbon cycle, J. Exp. Mar. Biol. Ecol., 288, 1–15, 2003.
10
Allemand, D., Ferrier-Pages, C., Furla, P., Houlbreque, F., Puverel, S., Reynaud, S., Tam-butte, E., TamTam-butte, S., and Zoccola, D.: Biomineralisation in reef-building corals: from molec-ular mechanisms to environmental control, C.R. Palevol, 3, 453–467, 2004.
Allison, N., Finch, A. A., and EIMF 2010: delta(11)B, Sr, Mg and B in a modern Porites coral: the relationship between calcification site pH and skeletal chemistry, Geochim. Cosmochim.
15
Ac., 74, 1790–1800, 2010.
Al-Moghrabi, S., Allemand, D., and Jaubert, J.: Valine uptake by the scleractinian coralGalaxea fascicularis: characterization and effect of light and nutritional status, J. Comp. Physiol. B, 163, 355–362. 1993.
Al-Moghrabi, S. M., Al-Horani, F. A., and de Beer, D.: Calcification by the scleractinian coral
20
Galaxea fascicularis: direct measurements on calicoblastic layer using micro-sensors, in: 8th Int. Symp. on Biomineralization, 45, 2001.