ACPD
8, 2863–2902, 2008Transport of CO in the African upper
troposphere
B. Barret et al.
Title Page
Abstract Introduction
Conclusions References
Tables Figures
◭ ◮
◭ ◮
Back Close
Full Screen / Esc
Printer-friendly Version
Interactive Discussion Atmos. Chem. Phys. Discuss., 8, 2863–2902, 2008
www.atmos-chem-phys-discuss.net/8/2863/2008/ © Author(s) 2008. This work is distributed under the Creative Commons Attribution 3.0 License.
Atmospheric Chemistry and Physics Discussions
Transport pathways of CO in the African
upper troposphere during the monsoon
season: a study based upon the
assimilation of spaceborne observations
B. Barret1,2, P. Ricaud1,2, C. Mari1,2, J.-L. Atti ´e1,2, N. Bousserez1,2, B. Josse3, E. Le Flochmo ¨en1,2, N. J. Livesey5, S. Massart4, V.-H. Peuch3, A. Piacentini4, B. Sauvage1,2, V. Thouret1,2, and J.-P. Cammas1,2
1
Universit ´e de Toulouse, Laboratoire d’A ´erologie, Toulouse, France
2
CNRS UMR 5560, Toulouse, France
3
CNRM-GAME, M ´et ´eo-France and CNRS URA 1357, Toulouse, France
4
CERFACS, Toulouse, France
5
Jet Propulsion Laboratory, California Institute of Technology, Pasadena, CA, USA Received: 2 January 2008 – Accepted: 17 January 2008 – Published: 13 February 2008 Correspondence to: B. Barret ([email protected])
ACPD
8, 2863–2902, 2008Transport of CO in the African upper
troposphere
B. Barret et al.
Title Page
Abstract Introduction
Conclusions References
Tables Figures
◭ ◮
◭ ◮
Back Close
Full Screen / Esc
Printer-friendly Version
Interactive Discussion
Abstract
The transport pathways of carbon monoxide (CO) in the African Upper Troposphere (UT) during the West African Monsoon (WAM) is investigated through the assimila-tion of CO observaassimila-tions by the Aura Microwave Limb Sounder (MLS) in the MOCAGE Chemistry Transport Model (CTM). The assimilation setup, based on a 3-D First Guess
5
at Assimilation Time (3-D-FGAT) variational method is described. Comparisons be-tween the assimilated CO fields and in situ airborne observations from the MOZAIC program between Europe and both Southern Africa and Southeast Asia show an over-all good agreement around the lowermost pressure level sampled by MLS (∼215 hPa). The 4-D assimilated fields averaged over the month of July 2006 have been used to
10
determine the main dynamical processes responsible for the transport of CO in the African UT. The studied period corresponds to the second AMMA (African Monsoon Multidisciplinary Analyses) aircraft campaign. At 220 hPa, the CO distribution is char-acterized by a latitudinal maximum around 5◦N mostly driven by convective uplift of air
masses impacted by biomass burning from Southern Africa, uplifted within the WAM
15
region and vented predominantly southward by the upper branch of the winter hemi-sphere Hadley cell. Above 150 hPa, the African CO distribution is characterized by a broad maximum over northern Africa. This maximum is mostly controlled by the large scale UT circulation driven by the Asian Summer Monsoon (ASM) and characterized by the Asian Monsoon Anticyclone (AMA) centered at 30◦N and the Tropical Easterly
20
Jet (TEJ) on the southern flank of the anticyclone. Asian pollution uplifted to the UT over large region of Southeast Asia is trapped within the AMA and transported by the anticyclonic circulation over Northeast Africa. South of the AMA, the TEJ is responsible for the tranport of CO-enriched air masses from India and Southeast Asia over Africa. Using the high time resolution provided by the 4-D assimilated fields, we give evidence
25
ACPD
8, 2863–2902, 2008Transport of CO in the African upper
troposphere
B. Barret et al.
Title Page
Abstract Introduction
Conclusions References
Tables Figures
◭ ◮
◭ ◮
Back Close
Full Screen / Esc
Printer-friendly Version
Interactive Discussion
1 Introduction
Carbon Monoxide (CO) plays an important role in tropospheric chemistry. It is an atmo-spheric pollutant produced by incomplete combustion processes (industries, transport, biomass burning (BB), (seeHolloway et al.(2000) for a complete review). It affects both climate change, as an ozone (O3) precursor (Daniel and Solomon,1998), and the
tro-5
pospheric oxidizing capacity as the main sink of the hydroxyl radical (OH) (Thompson,
1992). Furthermore, with a lifetime of 1–2 months in the troposphere, CO is an excel-lent tracer of polluted air masses. Fast economic growth in industrialised Asia have led to a fast increase of CO (Stavrakou and Muller, 2006) and other O3 precursors such as nitrogen dioxide (NO2) (Richter et al.,2005) and Volatile Organic Compounds (Fu
10
et al.,2006) in the troposphere. Most of the state of the art Chemistry Transport Mod-els (CTM’s) underestimate tropospheric CO in the Norhern Hemisphere (NH) probably because of an underestimation of CO emissions from fossil fuel burning in east Asia (Shindell et al.,2006). Airborne and spaceborne observations of tropospheric CO have been used extensively to study intercontinental transport of pollution in the lower and
15
free troposphere (Stohl et al., 2002; Duncan et al., 2004; Liang et al., 2007). Until recently, spaceborne CO observations were based on nadir viewing sensor in the in-frared mostly sensitive to the free troposphere (Deeter et al., 2003; McMillan et al.,
2005;Barret et al. ,2005;Rinsland et al.,2006). Since August 2004, the Microwave Limb Sounder (MLS) onboard the Aura satellite provides unprecedented information
20
about the global Upper Troposphere-Lower Stratosphere (UTLS) CO distribution (
Fil-ipiak et al., 2005; Livesey et al., 2007). These observations have allowed a better understanding of the CO transport processes in the UTLS (Li et al., 2005; Fu et al.,
2006;Park et al.,2007). The North African/Eastern Mediterranean UT is a crossroad impacted by transport processes on synoptic to seasonal timescales and on regional to
25
ACPD
8, 2863–2902, 2008Transport of CO in the African upper
troposphere
B. Barret et al.
Title Page
Abstract Introduction
Conclusions References
Tables Figures
◭ ◮
◭ ◮
Back Close
Full Screen / Esc
Printer-friendly Version
Interactive Discussion Zone (ITCZ), poleward horizontal transport aloft and a sinking branch equatorward of
the Suptropical Westerly Jets (SWJ). Sauvage et al. (2007a) studied the meridional gradients of O3in the African UT, observed by in-situ airborne measurements provided by the MOZAIC program. They put to the forth the impact of uplift of boundary layer O3-poor air masses within the ITCZ followed by photochemical production of O3 by
5
O3 precursors produced by lightnings or originating from the surface, within the upper level branches of the Hadley circulation. In particular, during the NH monsoon season in Africa, O3precursors emitted by BB south of the ITCZ and further transported to the ITCZ (Sauvage et al., 2005, 2007b; Mari et al., 2007) are likely to play an important role upon the African UT composition. Sauvage et al.(2007a) have also mentioned a
10
possible impact of meridional transport by the northward flow on the western flank of the Asian Monsoon Anticyclone (AMA), that dominates the UT circulation in the North-ern Hemispehere during the summer monsoon (Hoskins and Rodwell,1995; Park et
al., 2007), over the UT African O3 distribution. Saunois et al. (2007) have used an idealized 2-D model to reproduce the O3, water vapor (H2O) and carbon monoxide
15
(CO) meridional gradients in the African UT. Both studies give evidence of the Hadley circulation control upon the UT meridional O3gradient over Africa. However, large un-certainties remain concerning the impact of zonal transport from Asia upon the African UT composition.
In particular, during boreal summer, the African and the Asian UT are strongly
con-20
nected through synoptic variations of the AMA centered at 30◦N (Popovic and Plumb, 2001; Randel and Park, 2006) and fast horizontal transport by the strong westward winds of the Tropical Easterly Jet (TEJ) on the southern flank of the AMA (
Sathiyamoor-thy et al., 2007). Some evidence of the importance of zonal transport upon African tropospheric O3 has been given in (Chatfield et al., 2004). Based on SHADOZ O3
25
ACPD
8, 2863–2902, 2008Transport of CO in the African upper
troposphere
B. Barret et al.
Title Page
Abstract Introduction
Conclusions References
Tables Figures
◭ ◮
◭ ◮
Back Close
Full Screen / Esc
Printer-friendly Version
Interactive Discussion ozone maximum over the Middle East simulated with the GEOS-Chem CTM in
agree-ment with observed O3vertical profiles. They found that O3photochemically produced in the Eastern and Southern Asian UT and transported westward by the TEJ accounts for 65% of the UT O3 supply over the Middle East. In their study about the pollution crossroads over the Mediterranean,Lelieveld et al.(2002) have shown that Asian
pol-5
lution uplifted by convection within the Asian Summer Monsoon (ASM) region can be transported westward over Africa and subsequently northward to the Eastern Mediter-ranean by the anticyclonic flow on the western flank of the AMA. This transport pathway contributes significantly to the enhanced CO concentrations observed over the East-ern Mediterranean in the UTLS. Evidence of this transport pathway has been further
10
highlighted by (Scheeren et al.,2003) who have identified a BB plume originating in South Asia in the eastern Mediterranean UT, based on aircraft in situ chemical obser-vations and backtrajectory analyses. The aforementioned studies have given evidence of the strong impact of both Asian emissions through transport by the AMA during the NH monsoon season and African emissions through the Hadley circulation upon the
15
African UT composition. The objective of our study is to address the main transport pathways of chemical species in the African UT and particularly to further discrimi-nate the influence of these two transport pathways during the NH monsoon season. In order to achieve our goal, we have combined chemistry transport modeling and CO spaceborne observations from the limb viewing Aura/MLS through data assimilation.
20
Assimilation of spaceborne chemical data in a CTM allows constraining the distribution of observed species while meteorological analyses give a realistic dynamical forcing. Therefore, the assimilation provides 4-D fields that are best suited to address transport processes and budget analyses (Pradier et al.,2006). Furthermore, the assimilated fields allow us to study variations of the transport processes on synoptic timescales
25
as-ACPD
8, 2863–2902, 2008Transport of CO in the African upper
troposphere
B. Barret et al.
Title Page
Abstract Introduction
Conclusions References
Tables Figures
◭ ◮
◭ ◮
Back Close
Full Screen / Esc
Printer-friendly Version
Interactive Discussion similation setup as MOCAGE-MLS. Both models and spaceborne observations need
high quality independent observations to be validated. The MOZAIC program has pro-vided observations of the tropical UT composition (CO and O3) for several years and particularly for the period of interest in this study which corresponds to the second phase of the AMMA (African Monsoon Multidisciplinary Analyses) airborne experiment
5
Redelsperger et al.,2006;Mari et al.,2005; Lebel et al., 20071. We have used those data to evaluate the MOCAGE model and the MOCAGE-MLS assimilation system.
Our paper is organized as follows. Section 2is dedicated to the description of the whole assimilation setup covering the Aura/MLS CO observations in the UTLS, the MOCAGE CTM and the MOCAGE-MLS assimilation system. The validation of the
10
assimilated fields based on MOZAIC aircraft in situ CO observations is discussed in Sect.3. Section 4is dedicated to the discussion of the July 2006 monthly mean CO UT distributions and to the main transport pathways of CO in the African UT. Section5
provides an analysis of the variability of the UT CO distribution over Africa and of the dynamical processes responsible for this variability. Finally, summary and conclusions
15
of the study are presented in Sect.6.
2 The Assimilation of MLS CO data in the MOCAGE-PALM system
In this section we describe the three elements we have employed to perform the as-similation of Aura/MLS observations. First, we discuss the Aura/MLS CO observations in the UTLS and the way we have actually utilized them. Second, the main
character-20
istics of the MOCAGE CTM with the direct simulation we have performed are exposed. Finally we give the main details of both the assimilation setup and the assimilation performances.
1
ACPD
8, 2863–2902, 2008Transport of CO in the African upper
troposphere
B. Barret et al.
Title Page
Abstract Introduction
Conclusions References
Tables Figures
◭ ◮
◭ ◮
Back Close
Full Screen / Esc
Printer-friendly Version
Interactive Discussion 2.1 Aura/MLS observations of CO in the UTLS
The MLS instrument has been flying onboard the Aura satellite in a sun-synchronous polar orbit since August 2004. Vertical profiles of 17 atmospheric parameters are re-trieved from the millimeter and sub-millimeter thermal emission measured at the at-mospheric limb (Waters et al.,2006). The latest MLS CO observations we use in this
5
study (V2.2) are described inPumphrey et al.(2007). One of the most interesting fea-tures of MLS is its ability to measure CO and other constituents in the UTLS where retrievals are made at 4 levels, namely 215, 147, 100 and 68 hPa. Furthermore, the relatively low sensitivity of measurements in the millimeter and sub-millimeter domain to high humidity and clouds allows MLS to provide a good spatial coverage in the
tropi-10
cal UT. MLS CO data in the UTLS have a 4 to 5 km vertical resolution, a 500 to 600 km along-track resolution and a precision of∼20 ppbv (Livesey et al.,2007). Livesey et al. (2007) have made detailed characterization and validation of MLS CO and O3 data in the UTLS. The Aura/MLS CO observations used in our assimilation system have been screened according to their recommendations. We have therefore rejected data with
15
negative precisions corresponding to a contribution of the MLS measurements to the estimated concentration lower than 50%, with odd “Status” fields, with “Quality” fields greater than 1.2 and with “Convergence” fields lower than 1.8. For the 147, 100 and 68 hPa MLS retrieval levels,Livesey et al.(2007) estimate a scaling uncertainty of 30%. Comparing MLS CO and MOZAIC in situ airborne CO observations at northern
mid-20
latitude they show that MLS CO at 215 hPa is roughly a factor of 2 too high and they deduce a scaling uncertainty of∼100% at that level. In their validation studies, Cler-baux et al. (2007) andPumphrey et al. (2007) have compared CO profiles measured by the ACE-FTS (Bernath et al., 2005) and Aura/MLS instruments. They both show that MLS is biased high in the UT with the highest relative difference (∼100%) found
25
ACPD
8, 2863–2902, 2008Transport of CO in the African upper
troposphere
B. Barret et al.
Title Page
Abstract Introduction
Conclusions References
Tables Figures
◭ ◮
◭ ◮
Back Close
Full Screen / Esc
Printer-friendly Version
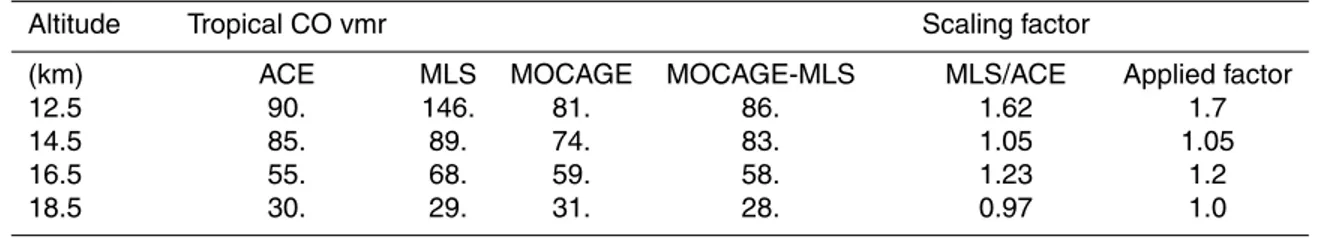
Interactive Discussion biases of these observations at the 4 UTLS retrieval levels within the scaling
uncertain-ties described inLivesey et al. (2007). In order to achieve this task, we have used the ACE-FTS tropical CO climatology fromFolkins et al.(2006) (see their Fig. 12). Indeed, some limitations of the ACE-FTS sensor (e.g. limited number of profiles measured per day, high sensitivity to clouds and humidity, lower coverage of tropical versus polar
5
latitudes) make a direct validation of our assimilated fields for a one month period at tropical latitudes rather difficult. In Table1we have reported the climatological values from ACE-FTS computed by Folkins et al. (2006) and the mean tropical CO values from MLS at the 4 UTLS retrieval levels for the month of July 2006. As expected, the highest difference between the two instruments occurs at 215 hPa, with a MLS/ACE
10
ratio of 1.62. Nevertheless this ratio is much lower than the value of 2.0 that has been estimated by the validation studies we have mentioned before. Results from assimi-lation tests compared to MOZAIC aircraft in situ observations (see Sect. 3) have led us to use a slightly higher value (1/1.7) to adjust the MLS observations at 215 hPa. At 147 hPa, the agreement between the ACE-FTS climatology and the mean MLS tropical
15
value is rather good, and we have rescaled the MLS observations by a factor of 1/1.05. The 100 hPa MLS tropical CO values are biased high by 23% relative to the ACE-FTS climatology. Therefore, MLS partly misses the steep vertical gradient observed in the tropics from 14.5 km to the LS by ACE-FTS and confirmed by various aircraft cam-paigns (Folkins et al.,2006). The adjustment of the MLS CO observations by 1/1.2 at
20
100 hPa will compensate this bias. At 68 hPa, the mean MLS tropical value is close to the ACE-FTS climatology, in agreement withPumphrey et al.(2007) and Clerbaux et
al. (2007) and we have kept the original values.
2.2 Model description
MOCAGE is the global CTM developed at the CNRM (Centre National de Recherches
25
Meteorologiques) of Meteo-France (Bousserez et al., 2007; Teyssedre et al., 2007;
ACPD
8, 2863–2902, 2008Transport of CO in the African upper
troposphere
B. Barret et al.
Title Page
Abstract Introduction
Conclusions References
Tables Figures
◭ ◮
◭ ◮
Back Close
Full Screen / Esc
Printer-friendly Version
Interactive Discussion It uses a semi-lagrangian advection scheme to transport the species (Josse et al.,
2004). The model is constrained with the European Center for Medium range Weather Forecast (ECMWF) 6-hourly meteorological analyses (horizontal winds, temperature, specific humidity, surface pressure). The vertical velocities are computed from the ECMWF horizontal wind fields by imposing the mass conservation law for each
atmo-5
spheric column. The simulations are performed on a regular 2◦×2◦horizontal grid and
on 47 hybrid (σ, P) levels from the surface up to 5 hPa. The vertical resolution typically varies from 40 to 400 m in the boundary layer (7 levels) and is about 800 m in the UTLS. The chemical scheme used is RACMOBUS, which combines the stratospheric scheme REPROBUS (Lefevre et al.,1994) and the tropospheric scheme RACM (Stockwell et
10
al., 1997). Convective processes are simulated with the scheme of Bechtold et al.
(2001), and turbulent diffusion is calculated with the scheme byLouis(1979). For an-thropogenic (including BB) sources, the model uses the emission inventory from
Den-tener et al. (2005) with a monthly or yearly time-resolution depending on the species. In particular, nitrogen oxides (NOx), CO and Volatile Organic Compounds emissions
15
from BB have a monthly time-resolution. The total CO surface emissions represen-tative of year 2000 amounts to 1094 Tg(CO)yr−1. We started our simulations on 1
January 2006 from a climatological initial field in order to have a 6 months spin-up be-fore July 2006. In the following we will discuss results from a direct simulation with the MOCAGE CTM (control run) and from the assimilation of MLS CO observations with
20
the MOCAGE-MLS system (assimilation run) for July 2006.
2.3 Assimilation setup
Assimilation of spaceborne atmospheric chemical data in CTM’s have first focused on stratospheric ozone and related species (see e.g.Errera and Fonteyn,2001;Geer et
al.,2006;Lahoz et al.,2007). With the increasing number of spaceborne instruments
25
ACPD
8, 2863–2902, 2008Transport of CO in the African upper
troposphere
B. Barret et al.
Title Page
Abstract Introduction
Conclusions References
Tables Figures
◭ ◮
◭ ◮
Back Close
Full Screen / Esc
Printer-friendly Version
Interactive Discussion
2006). To our knowledge, the UTLS region has not yet been the subject of scientific studies based on spaceborne CO data assimilation while new limb sensors, such as Aura/MLS (Livesey et al., 2007) ACE-FTS (Clerbaux et al., 2007) or Envisat/MIPAS (Raspollini et al.,2006) provide information about the UTLS composition. The sparse horizontal sampling of such limb sensors requires averaging over time periods ranging
5
from about 1 week to 1 month in order to obtain global distributions useful for scientific purposes. However, the UTLS composition variability, driven by transport and chem-istry processes on synoptic timescales cannot be captured by such averaging proce-dures. The coarse vertical resolution of UTLS spaceborne measurements does not allow to resolve processes with finer vertical scales typical of this atmospheric region.
10
Furthermore, the lack of regular independent in situ observations in the tropical UTLS makes the validation of spaceborne observations particularly difficult in this region. Finally, as mentioned in the introduction, global CTM’s have problems to reproduce the tropospheric composition and more particularly the CO tropospheric distribution (Shindell et al.,2006). Therefore, the goals of the assimilation of UTLS Aura/MLS CO
15
data in the MOCAGE CTM presented in this study are manyfold: (i) to estimate the concentrations of CO at altitudes where they are not observed by MLS (ii) to fill in tem-poral and spatial gaps from the Aura/MLS CO measurements to enable the study of the processes responsible for the CO distribution variability on synoptic timescales (iii) to evaluate the representation of UTLS CO transport and chemistry processes in the
20
MOCAGE CTM and (iv) to support the validation of the Aura/MLS CO observations. Our study is based on the assimilation of UTLS CO observations by the Aura/MLS sensor in the MOCAGE CTM with a 3-D-FGAT (First Guess at Assimilation Time, ) assimilation method driven by the PALM software developed at CERFACS (Buis et al.,
2006; Massart et al. , 2005). This MOCAGE-PALM assimilation system has been
25
er-ACPD
8, 2863–2902, 2008Transport of CO in the African upper
troposphere
B. Barret et al.
Title Page
Abstract Introduction
Conclusions References
Tables Figures
◭ ◮
◭ ◮
Back Close
Full Screen / Esc
Printer-friendly Version
Interactive Discussion ence between the model and all the observations located in a given temporal window.
The assimilation system computes daily analysis by dividing each day into 8 windows of 3 h. The analyzed increment is added to the background at the beginning of each window and integrated during 6 h. The last 3 h are used to obtain the new background for the next assimilation window.
5
The assimilation consists in the iterative minimization of a cost function computed from the differences between the observations and the model background weighted by their respective covariance matrices. The choice of the observation and of the back-ground covariance matrices is therefore important to reach the right balance between the background and the observations. We have assumed that the observations at
10
the different retrieval levels were independent and we have therefore used a diagonal covariance matrix for the observation error. In order to spread assimilation increments spatially, horizontal background correlations are modelled using a generalized diffusion operator (Weaver and Courtier,2001) with a scale-length of 4◦and vertical background
error correlations are modelled using an exponential law with a scale-length of∼2 km
15
(Massart et al., 2007). Assimilation tests performed with larger vertical scale-length (∼3 km) have shown that our results and conclusions are marginally sensitive to this parameter. A quantitative criterion for the choices of the background and observations errors is the chi-square (χ2) test. The normalisedχ2is the ratio of the cost function to half the number of observations in the assimilation window. A value ofχ2 close to 1
20
indicates a good balance while a value higher (respectively lower) than 1 indicates an underestimation (respectively overestimation) of the observation or background error covariance matrices. We have performed assimilations with different choices of the background and observation errors in order to reach aχ2value close to 1. Satisfactory results have been achieved using a background error of 10% throughout the UTLS and
25
er-ACPD
8, 2863–2902, 2008Transport of CO in the African upper
troposphere
B. Barret et al.
Title Page
Abstract Introduction
Conclusions References
Tables Figures
◭ ◮
◭ ◮
Back Close
Full Screen / Esc
Printer-friendly Version
Interactive Discussion rors, we have chosen to decrease neither the background nor the observation errors.
First, comparisons between CO from the control run and MOZAIC in situ data show that around 220 hPa, the model random error (15–20%) is larger than the 10% error we have prescribed for the model background. Second we prefer to keep the observa-tion errors prescribed in the assimilaobserva-tion system close to the errors given in the MLS
5
files because they are based on instrumental considerations (Livesey et al.,2007).
2.4 Assimilation results
In order to evaluate the CO fields from the control and the assimilation runs, we have first checked the consistency between the mean tropical CO volume mixing ratio (vmr) and the ACE-FTS climatology used to adjust the MLS observations in the UTLS. The
10
results are given in Table 1. The model underestimates CO in the tropical UT by ∼10 ppbv while in the tropical LS, mean modelled CO vmr’s are in good agreement with the ACE-FTS climatology. At the 3 MLS retrieval levels in the UT, the assimila-tion results in an improved agreement (within∼4 ppbv) with the climatology. The CO fields from MLS, and from the control and assimilation runs, averaged over the period
15
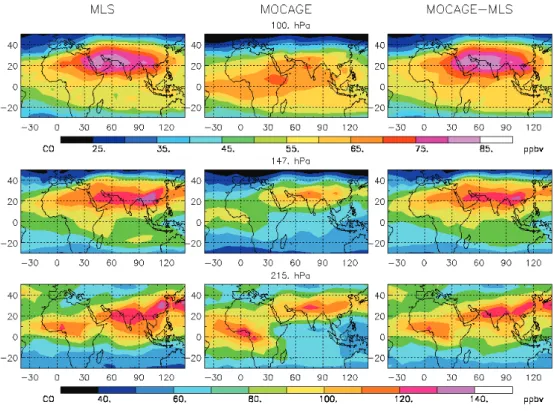
5–31 July 2006 are shown in Fig.1 in a large domain encompassing Africa and Asia. As expected, the assimilation results in a large improvement of the agreement rela-tive to the observations. At the 3 lowermost UTLS levels, the correlation coefficients between model and observations are in the range 0.59–0.71 and 0.85–0.88 between assimilation and observations. At 215 and 147 hPa the mean low biases between the
20
control run and both the MLS observations and the assimilation run are clearly visible in Fig.1. On a more regional scale, important discrepancies between the control run and MLS/assimilation run are occuring around the ASM and WAM regions. At 215 and 147 hPa over Asia, MOCAGE is biased low relative to MLS, but the structure of the CO distribution is in rather good agreement with the structure detected by MLS. Such
25
ACPD
8, 2863–2902, 2008Transport of CO in the African upper
troposphere
B. Barret et al.
Title Page
Abstract Introduction
Conclusions References
Tables Figures
◭ ◮
◭ ◮
Back Close
Full Screen / Esc
Printer-friendly Version
Interactive Discussion a problem has been reported byShindell et al.(2006) for most of the state of the art
global CTM’s. At 100 hPa, the CO enhanced concentrations within the AMA observed by MLS and reproduced by the assimilation run are not visible with the control run. A low bias in the Asian CO emissions may also explain this low bias in the CO dis-tribution. Nevertheless, the difference of structure in the CO observed and modeled
5
distributions at 100 hPa may also point to a problem of vertical transport to the LS in this region. At 215 hPa over the WAM, the model overestimates the CO concentrations relative to the MLS observations. Important quantities of the CO uplifted to that level by WAM convection comes from BB in Southern Africa (Sauvage et al.,2005,2007b;Mari
et al.,2007). Therefore, the discrepancy between the control run and MLS most likely
10
points to an overestimation of the climatological African BB emissions in the MOCAGE inventory.
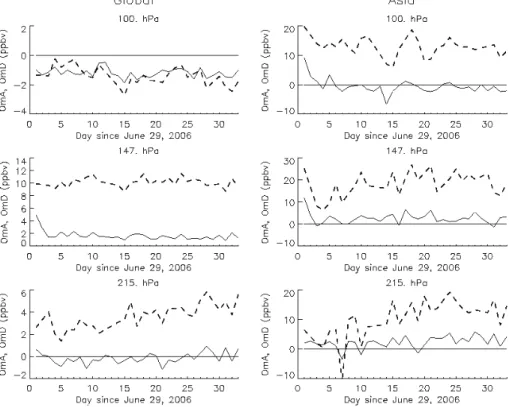
In order to evaluate our assimilation system and its time evolution, we have com-puted the daily mean differences between observations and assimilated fields, named Observations minus Analyses (OmA) and between the observations and the fields
sim-15
ulated by the control run that we name Observations minus Direct (OmD). The OmA and OmD are displayed in Fig. 2 for 100, 147 and 215 hPa for a global domain be-tween 40◦S and 40◦N and for Asia from 10◦N to 40◦N and 60◦E to 110◦E. Asia has
been chosen as a test region because the highest differences between the model and the MLS observations occur over Asia (Fig.1). Over both domains and for the three
20
pressure levels, the OmA is converging to an almost steady value within 1 to 3 days. Over the global domain the OmA remain within the (−2)−2 ppbv range while the OmD is in the range 2–5, 9–12 and (−1)–(−2) ppbv at 215, 147, and 100 hPa, respectively. Over Asia, OmD’s are higher and display more variability than over the global domain with typical values between 10 and 20 ppbv. However, after 3 days of assimilation,
25
ACPD
8, 2863–2902, 2008Transport of CO in the African upper
troposphere
B. Barret et al.
Title Page
Abstract Introduction
Conclusions References
Tables Figures
◭ ◮
◭ ◮
Back Close
Full Screen / Esc
Printer-friendly Version
Interactive Discussion
3 Validation of the assimilated fields
The agreement between the CO fields from the assimilation run and the climatology fromFolkins et al.(2006) which represents a background picture of tropical UTLS CO (Sect.2.4and Table1) validates the mean vertical structure of the assimilated CO dis-tributions avoiding the variability in CO in situ observations from scientific campaigns
5
due to sparse sampling in time and space. In this section, we make use of the MOZAIC data that are the only available regular UTLS CO in situ observations performed during our study period. Nevertheless, as these observations are carried out onboard com-mercial aircrafts, they only provide information about the lowermost part of the vertical domain under study, namely below∼200 hPa.
10
3.1 MOZAIC observations
As part of the MOZAIC program, in-situ measurements of CO and O3have been per-formed daily from Windhoek (22.5◦S, 17.5◦E, Namibia) to Frankfurt (50◦N, 8.6◦E,
Ger-many) since December 2005 with instruments onboard a commercial Air-Namibia air-craft. From 5 to 31 July, we have used data from the 27 daily flights. MOZAIC CO and
15
O3 regular measurements are also available from Austrian-Airlines commercial flights from Vienna (48.1◦N, 16.2◦E, Austria) to Bangkok (13.4◦N, 100.3◦E, Thailand) since
beginning of 2006. For our study period (5–31 July 2006), we have gathered data from 13 Austrian-Airlines flights to Bangkok. MOZAIC measurements carried out with a 30 s response time and with a reported precision of∼5 ppbv for CO (Nedelec et al.,
20
2003) have been averaged in 1 mn time bins. For the comparisons, outputs from the control and assimilation runs have been interpolated to the 1 mn averaged observa-tion times and locaobserva-tions. We have selected data recorded with a flight pressure level lower than 250 hPa in order to have enough data for statistical comparisons and to be close enough to the lowermost level (215 hPa) of the MLS CO observations used in the
25
ACPD
8, 2863–2902, 2008Transport of CO in the African upper
troposphere
B. Barret et al.
Title Page
Abstract Introduction
Conclusions References
Tables Figures
◭ ◮
◭ ◮
Back Close
Full Screen / Esc
Printer-friendly Version
Interactive Discussion 3.2 Validation results
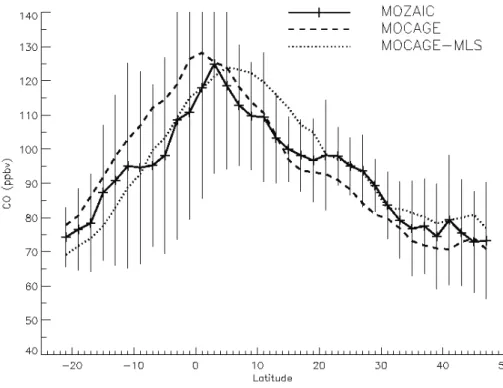
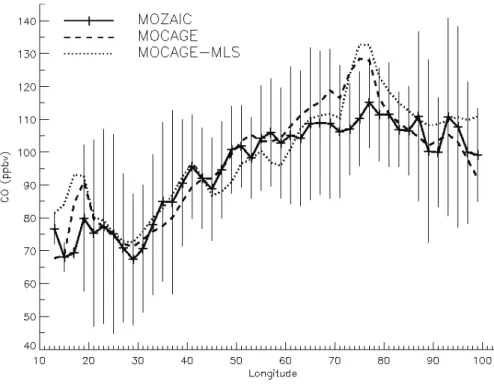
The comparisons between the MOZAIC CO observations and the outputs from the con-trol and assimilation runs are displayed in Fig.3for the Air-Namibia data and in Fig.4
for the Austrian-Airlines data. The data have been averaged over the period 5–31 July 2006 in 2◦latitude bins for Air-Namibia and in 2◦longitude bins for Austrian-Airlines. In
5
both cases the average biases between the modelled and assimilated CO fields and the MOZAIC observations are positive and not exceeding 4 ppbv or 5%. The good overall agreement between MOZAIC and the assimilated fields was expected since the scaling factor applied to the MLS observations at 215 hPa was partly chosen from comparisons between MOZAIC data and assimilation tests (Sect.2.1). The control and
10
the assimilation runs reproduce the observed CO meridional gradient correctly (Fig.3) with a sharp increase north of 22◦S, maxima between roughly the Equator and 5◦N,
and globally decreasing gradients from Equator-5◦N to 35◦N. Discrepancies between
the control run and the MOZAIC observations are found between 10◦S and the
equa-tor where MOCAGE overestimates CO by 10–15 ppbv and north of 20◦N where the
15
model underestimates the in situ observations by less than 10 ppbv. The assimilation run displays a very good agreement with MOZAIC between 10◦S and 5◦N. Between
5◦N and 20◦N, the assimilation overestimates CO by∼10 ppbv. The di
fferences be-tween the control and the assimilation runs indicates that this overestimation probably comes from a bias in the MLS observations. The agreement between MOZAIC and the
20
assimilation run is again excellent from 20◦N to 50◦N. The longitudinal transect from
Germany to Thailand from MOZAIC, and from the control and assimilation runs are in very good agreement (Fig.4). Both the model and the assimilation system are able to reproduce the south-eastward increase of UT CO. The only noticeable discrepancy is an overestimation of the CO vmr’s by up to 20 ppbv between 70◦E and 85◦E by
25
ACPD
8, 2863–2902, 2008Transport of CO in the African upper
troposphere
B. Barret et al.
Title Page
Abstract Introduction
Conclusions References
Tables Figures
◭ ◮
◭ ◮
Back Close
Full Screen / Esc
Printer-friendly Version
Interactive Discussion below 250 hPa in this region, the MLS sampling is relatively poor and consequently the
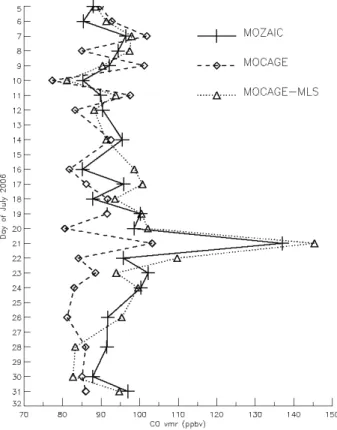
spaceborne observations do not constrain the model enough to correct the bias. An important aspect of the assimilation of spaceborne data is its ability to produce 4-D fields enabling to follow processes occuring on synoptic timescales not fully cap-tured by the observations. Thanks to their daily frequency, the MOZAIC Air-Namibia
5
program provides a very good set of data to evaluate the ability of our assimilation sys-tem to follow the CO daily variability over Africa. Figure5 presents the time evolution of the mean daily CO concentration between 20◦N and 30◦N and above the 250 hPa
level sampled along the aircraft flight track. Before 18 July and after 27 July, the model and the assimilation system reproduce correctly the measured CO variations
charac-10
terized by oscillations within the 80–95 ppbv range. The enhanced CO concentrations observed by MOZAIC from 19 to 26 July and the sharp peak characterized by CO con-centrations exceeding the background mean value by more than 50 ppbv observed on 21 July are far better reproduced by the assimilation system than by the model. From our comparisons with the MOZAIC observations we conclude that the assimilated CO
15
distributions at the lowermost boundary of the assimilation region are satisfactory. The mean bias between the assimilated fields and the in situ observations is below 5%. The main structures of the transects between Europe and Africa and between Europe and Southeast Asia are well reproduced by MOCAGE-MLS and the assimilation system is able to reproduce sporadic short events not simulated by the model.
20
4 Transport pathways of CO in the African UT
In this section, we discuss the main transport pathways in the African UT on a monthly scale based on July 2006 averaged fields from the assimilation run. The aim is to make an assessment of the relative impact of long range transport of pollution from Asia and of local African emissions upon the African UT CO distribution. The assimilation of MLS
25
ACPD
8, 2863–2902, 2008Transport of CO in the African upper
troposphere
B. Barret et al.
Title Page
Abstract Introduction
Conclusions References
Tables Figures
◭ ◮
◭ ◮
Back Close
Full Screen / Esc
Printer-friendly Version
Interactive Discussion coverage that allows us to study the dynamical tendencies in combinations with the
ECMWF dynamical analyses (ii) relative to the MOCAGE CTM, the constraint brought by the MLS observations allows us to correct biases in the model and to provide more realistic CO distributions at high spatial and temporal resolution (Sect.2.4). Numerous recent studies have pointed to the strong uplift of boundary layer polluted air from
In-5
dia Southeast Asia and South China to the Asian UT during the ASM (Li et al.,2001;
Lelieveld et al.,2002;Li et al.,2005;Fu et al.,2006;Park et al.,2007;Berthet et al.,
2007). Based on simulations from the GEOS-Chem CTM,Li et al.(2005) explain this uplift by (i) enhanced convection resulting from wind convergence in southwest China and, (ii) orographic lifting of the southwesterly flow from Bangladesh and Northeast
10
India over the southern slope of the Himalayas. Using trajectory calculationsBerthet et
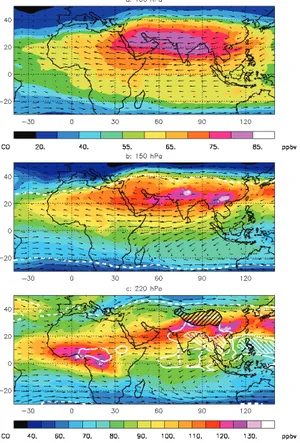
al. (2007) have also highlighted the potential of South China, Indian subcontinent as a source of pollutants transported from the boundary layer to the tropopause region and LS in summer. The mean CO distributions at 100, 150 and 220 hPa from the assimi-lation run together with the horizontal winds, the Outgoing Longwave Radiation (OLR)
15
200 and 220 W/m2characterizing deep convection (Park et al.,2007) and the dynam-ical tropopause contours superimposed and averaged over the period 5–31 July 2006 are displayed in Fig.6. At 220 hPa above Asia, the highest CO concentrations from MOCAGE-MLS are located between 20◦N and 30◦N and more specifically over
North-east India/Nepal and over Southwest China (Fig.6c) confirming the transport pathways
20
highlighted by Li et al. (2005). From spaceborne observations and back-trajectories calculations,Fu et al.(2006) argue that moist convection driven by enhanced surface heating over the Tibetan Plateau is deeper and detrains more water vapor and CO at the tropopause level than convection over the ASM region. As already described by
Park et al. (2007), the OLR are lower over the ASM region (see the 200 W/m2 OLR
25
ACPD
8, 2863–2902, 2008Transport of CO in the African upper
troposphere
B. Barret et al.
Title Page
Abstract Introduction
Conclusions References
Tables Figures
◭ ◮
◭ ◮
Back Close
Full Screen / Esc
Printer-friendly Version
Interactive Discussion from India and the Indian Ocean to Africa is responsible for the high CO concentrations
over the Arabic sea and the Arabic peninsula. This inflow of CO-enriched air masses from Asia is consistent with the results ofLi et al.(2001) concerning the major role of UT westward transport of O3from Asia to sustain the Middle East tropospheric ozone maximum in summer.
5
Over Asia during the ASM, the UT circulation is dominated by the AMA driven by di-abatic heating in the ASM region (Hoskins and Rodwell,1995;Park et al.,2007). The AMA is bounded by the Subtropical Westerly Jet on its northern flank (∼40◦N) and by
the TEJ on its southern flank (∼10◦N) and is extending on average from 20◦E to 120◦E.
Based on UT Aura/MLS observations at 150 hPa,Li et al.(2005) have highlighted the
10
trapping of polluted air masses within the AMA. Using O3 and H2O tropospheric ob-servations from the Atmospheric Infrared Sounder (AIRS), Randel and Park (2006) have also established that transient convective events were responsible for the vertical transport of H2O enriched and O3 poor air masses up to the UT (∼13 km), where the constituent anomalies are confined within the AMA. In a more recent study, Park et
15
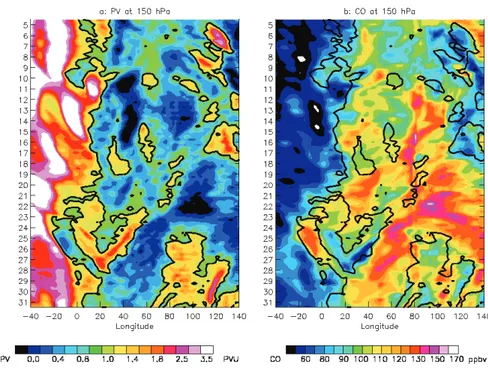
al. (2007) have taken advantage of a large range of UTLS spaceborne observations such as Aura/MLS CO, O3and H2O, to establish that this behavior extends to the LS at 100 hPa. The CO distributions from MOCAGE-MLS at 150 and 100 hPa (Fig.6a and b) confirm that polluted air masses are isolated within the AMA in the upper levels of the UT and in the LS. However, the uplift processes are still responsible for localized
20
enhanced CO concentrations at 150 hPa, while the 100 hPa distribution is more homo-geneous within the AMA highlighting slower uplift processes to the LS resulting in a better mixing of the air masses. At 220 hPa over Africa, the maximum values of CO (120 ppbv) are located around the WAM region, identified by low OLR (Fig.6c). In or-der to highlight the dynamical processes that drive the UT CO distributions over Africa
25
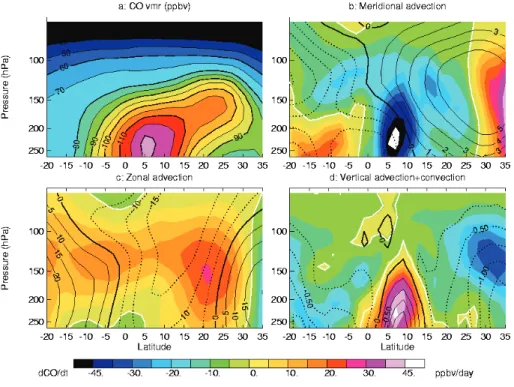
we have computed latitude-pressure cross-sections of CO mixing ratios (Fig.7a) and of CO dynamical tendencies (Fig.7b,c and d) based upon the ECMWF wind analyses and the 4-D CO assimilated fields for a zonal band encompassing Africa (20◦W–30◦E).
ACPD
8, 2863–2902, 2008Transport of CO in the African upper
troposphere
B. Barret et al.
Title Page
Abstract Introduction
Conclusions References
Tables Figures
◭ ◮
◭ ◮
Back Close
Full Screen / Esc
Printer-friendly Version
Interactive Discussion below ∼180 hPa is convective uplift responsible for the injection of up to 45 ppbv of
CO per day (Fig.7d). During the WAM season, BB which occurs in Southern Africa from 20◦S to the ITCZ around 5◦S (Mari et al., 2007) is the main source of CO in
Africa. In order to be uplifted to the UT by deep convection to produce the maximum CO concentrations in the WAM region displayed in Fig.6c, BB emissions have to be
5
transported to the ITCZ.Sauvage et al.(2005) andSauvage et al. (2007b) point to a connection between southern regions impacted by BB and the WAM mid-troposphere through transport by the south-easterly trade winds above the monsoon layer. Mari et
al. (2007) argue that air masses impacted by BB are transported out over the ocean by the southern hemispheric African Easterly Jet (AEJ-S) or toward the continental
10
part of the ITCZ during the break phase of the AEJ-S. Below 180 hPa, CO deposited by vertical transport in the WAM region is vented primarily by southward advection within the southern Hadley cell, more intense than its northern counterpart, with neg-ative tendencies in the range of 20–45 ppbv/day that compensate the uplift tendencies (Fig.7b). This southward transport results in high concentrations of CO over
South-15
ern Africa down to 10◦S at 220 hPa (Fig.6c) confirmed by the MOZAIC observations
(Fig.3). North of the ITCZ, between 12◦N and 20◦N, zonal advection of polluted air
masses by the TEJ blowing from India is the most important source of CO (Fig. 7c) to maintain the enhanced concentrations noticeable over Africa at 220 hPa (Fig.6c). Nevertheless, the validation performed with the MOZAIC data showing an
overesti-20
mation of∼10 ppbv of CO by the assimilation run in that region (Sect.3.2) makes us mitigate the impact of this zonal transport upon the CO distribution. Air masses im-pacted by African pollution and uplifted in the WAM region contribute much less to the CO budget north of the ITCZ because northward transport is predominant only north of the ITCZ (Fig.7b). This result further highlights that the high bias observed between
25
the control run and MOZAIC south of the CO maximum (∼3◦N) over Africa (Sect.3.2) is probably resulting from too strong African BB emissions during boreal summer in the model. North of 20◦N, the TEJ splits over the Middle East and turns clockwise,
ACPD
8, 2863–2902, 2008Transport of CO in the African upper
troposphere
B. Barret et al.
Title Page
Abstract Introduction
Conclusions References
Tables Figures
◭ ◮
◭ ◮
Back Close
Full Screen / Esc
Printer-friendly Version
Interactive Discussion et al. (2002). West of 20◦E, a well-marked westerly flow brings clean oceanic air over
Northern Africa. At 150 hPa, the African CO maximum concentrations (∼110 ppbv) are located over the Sahara around 25◦N (Figs. 6b and 7a). This northward shift of the
CO maximum is caused by three main processes. First, convection is weaker over the WAM than over the ASM region (see the 200 W/m2 contour in Fig. 6c) (even though
5
ASM convection is not responsible for the main transport of CO to the Asian UT as was discussed above). In the WAM region, positive upward tendencies are therefore much weaker at 150 hPa (∼10–15 ppbv/day) than at 220 hPa (Fig. 7d) and the CO concen-trations do not exceed 105 ppbv. Second, the AMA circulation is stronger at 150 hPa than at 220 hPa and the CO enriched air masses originating from Asia that have been
10
uplifted to the UT and trapped within the AMA are therefore transported over Northeast Africa. Finally, on the AMA southern flank (between 10◦N and 25◦N) the TEJ which
is also stronger at 150 hPa than at 220 hPa, is responsible for the westward transport of polluted air masses from Asia to the African Atlantic coast. Both processes linked to the strong anticyclonic circulation over Asia result in maxima CO positive
tenden-15
cies around 20 ppbv/day between 15◦N and 30◦N at 150 hPa (Fig. 7c). Such as at
220 hPa, northward advection on the western flank of the AMA between 20◦E and
35◦E is bringing polluted air to the Eastern Mediterranean UT. At the bottom of the LS
(100 hPa, Fig.6a), the CO distribution over Africa is also dominated by the AMA and the TEJ but the mean CO concentrations have decreased by∼30 ppbv probably as a
20
result of slow vertical uplift.
In this section, we have highlighted the main CO transport pathways in the African UT based on averaged assimilated CO and wind fields for the month of July 2006. Below 150 hPa, pollution in the African UT is mostly coming from African emissions and particularly BB in Southern Africa uplifted within the WAM region and advected
25
southward by the winter Hadley cell. At and above 150 hPa, the distribution of CO over Africa is mainly driven by westward transport of polluted air masses uplifted to the UT over Asia to Northeast Africa around 25◦N–35◦N by the AMA and to the African
ACPD
8, 2863–2902, 2008Transport of CO in the African upper
troposphere
B. Barret et al.
Title Page
Abstract Introduction
Conclusions References
Tables Figures
◭ ◮
◭ ◮
Back Close
Full Screen / Esc
Printer-friendly Version
Interactive Discussion
5 Variability of the CO transport pathways in the African UT
The dynamical processes responsible for the transport of CO between the Asian and the African UT that were described in the previous section are subject to variations on synoptic timescales. One of the advantage of the assimilation of spaceborne ob-servations is to provide 4-D fields with a synoptic timescale resolution not achievable
5
with the observations alone. In this section, we take advantage of this property of the assimilated fields to study the impact of the variations of the TEJ and the AMA upon the distribution of CO in the African UT. The AMA is not a steady feature, it is subject to important variations on synoptic timescales. Based on meteorological data for the years 1987 to 1991,Popovic and Plumb(2001) have shown that the UT divergent flow
10
in the Asian Monsoon area, present during the whole season varies greatly in strength and shape. In particular, eddy shedding and westward propagation of the anticyclone are the most dramatic changes observed. Based on the 4 years they have analyzed, they assess that eddy sheddings, that follow a strengthening and an elongation of the anticyclone by a couple of days, are occuring a few times per summer with a
dura-15
tion of 4 to 8 days. Air masses within the AMA are characterized by low PV values and
Popovic and Plumb(2001) have used PV fields to determine the position and extension of the AMA and of the eddy sheddings and westward propagation events.
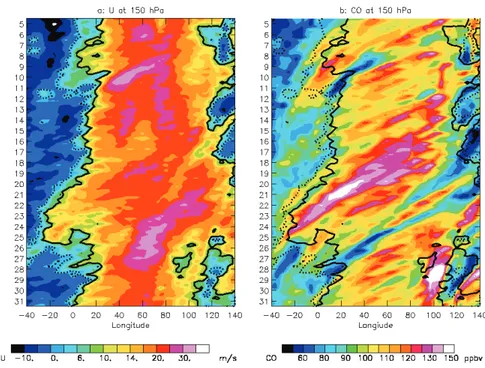
In order to evaluate the impact of such events upon the CO distribution in the UT, we display the Hovmoller diagrams of PV computed from the ECMWF analyses and of CO
20
mixing ratios from the MOCAGE-MLS assimilation system averaged in the latitudinal band 25–35◦N at 150 hPa (Fig.8). We arbitrarily use a value of 1.2 PVU to delimit the
AMA (black contour in Fig. 8). On average, the AMA extends westward to 20◦E but
it is subject to a strong variability as shown by the PV fields. From 5 to 16 July, the AMA is relatively stable and characterized by two main vortices centered at 50◦E and
25
80◦E. After 17 July, these two vortices weaken and the AMA is starting to strengthen
again above Asia between 100◦E and 120◦E and to elongate until 24 July. The AMA
Fur-ACPD
8, 2863–2902, 2008Transport of CO in the African upper
troposphere
B. Barret et al.
Title Page
Abstract Introduction
Conclusions References
Tables Figures
◭ ◮
◭ ◮
Back Close
Full Screen / Esc
Printer-friendly Version
Interactive Discussion thermore, between 23 and 27 July two small and weak vortices centered at 30◦E and
10◦W show up. Over the whole period, there is a clear anti-correlation between the
CO concentrations (Fig.8b) and the PV fields (Fig. 8a) with a correlation coefficient of−0.73. Within the 1.2 PVU contour, the CO mixing ratios are roughly larger than 90 ppbv. After the split of the AMA around 24 July, CO enhanced concentrations are
5
found within the two main vortices and follow the same shoehorse shape than the PV contours. Between 23 and 27 July, enhanced CO concentrations are also found in the two weak westernmost vortices. At 100 hPa (not shown), Asian transient convective events are not perturbing the CO distribution and the strong anticyclonic circulation is the main dynamical process controlling the CO distribution resulting in correlation
coef-10
ficient of−0.89 between the PV values and the CO concentrations. At the opposite, at 220 hPa (not shown) the correlation coefficient is reduced to−0.47 because the anticy-clonic circulation is weaker and convection is more important than at 150 hPa. On the southern flank of the AMA, south of 25◦N, the upper tropospheric circulation between
Asia and Africa is controlled by westward transport by the TEJ (Fig.7c). Therefore, to
15
evaluate the impact of the variability in the strength of the TEJ upon the CO distribution, we display Hovmoller diagrams of zonal wind velocities from the ECMWF analyses and of CO mixing ratios from the MOCAGE-MLS assimilation system at 150 hPa averaged in the 15–25◦N latitudinal band (Fig.9). The TEJ is delimited by the 10 m/s contour of
westward wind velocities (Black solid line). During most of 5–31 July, the TEJ is
con-20
fined eastward of 10◦E with the exception of 7–10 July and 21–26 July when the TEJ
is reaching 0◦E and 20◦W respectively. In the same latitudinal band, the highest CO
concentrations are mostly confined within the boundaries of the TEJ. The westward propagations of the TEJ on 7–11 July and 21–26 July are correlated with similar west-ward propagations of enriched CO air masses. The strong westwest-ward propagation of
25
the TEJ on 21–26 July, weaker but noticeable at 220 hPa (not shown) is responsible for the sharp peak in CO concentrations between 20◦N and 30◦N detected by MOZAIC
ACPD
8, 2863–2902, 2008Transport of CO in the African upper
troposphere
B. Barret et al.
Title Page
Abstract Introduction
Conclusions References
Tables Figures
◭ ◮
◭ ◮
Back Close
Full Screen / Esc
Printer-friendly Version
Interactive Discussion zonal winds and the CO concentrations are increasing from 0.48 at 220 hPa to 0.61 at
100 hPa (not shown).
6 Conclusions
In order to study the main dynamical processes responsible for the transport of pollution in the African UT during NH summer, we have assimilated MLS UTLS CO observations
5
in the MOCAGE CTM with the MOCAGE-PALM system and a 3-D-FGAT method. Prior to the assimilation, the MLS CO observations, known to be biased in the UTLS, have been adjusted towards a climatological tropical profile. Around the lowermost pres-sure level sampled by MLS (215 hPa), comparisons with the independent MOZAIC in situ observations have shown that the assimilation allows us to reproduce the CO UT
10
distribution but also the in situ observations at high spatial and temporal resolution. The most important discrepancy is a high bias of∼10 ppbv over Africa between 5◦N
and 20◦N. The CO assimilated fields provided by the MOCAGE-MLS system have
allowed us to establish the main transport pathways of CO in the African UT. Below 150 hPa, convective uplift of air masses impacted by BB in Southern Africa within the
15
WAM region between 0◦N and 12◦N is the main contributor to the latitudinal CO
maxi-mum. Below∼180 hPa, the polluted air masses deposited in the UT are vented mostly southward by the upper branch of the winter Hadley cell. At and above 150 hPa the main contributors are westward transport by the TEJ and the AMA of Asian polluted air masses that have been uplifted up to 100 hPa resulting in maxima CO concentrations
20
over North Africa around 25◦N. We took advantage of the synoptic timescale
resolu-tion of the MOCAGE-MLS assimilaresolu-tion system to study the impact of the variability of the dynamical processes responsible for the interconnection between the Asian and African UT upon the CO distributions. In the UT (150 hPa) over Northern Africa (25◦N–
35◦N), the variations of the AMA characterized by successive periods of elongations
25
ACPD
8, 2863–2902, 2008Transport of CO in the African upper
troposphere
B. Barret et al.
Title Page
Abstract Introduction
Conclusions References
Tables Figures
◭ ◮
◭ ◮
Back Close
Full Screen / Esc
Printer-friendly Version
Interactive Discussion are responsible for enhancements of the CO concentrations of up to 50 ppbv as far
as the African Atlantic coast. This study has highlighted the strength of the assimila-tion of spaceborne chemical observaassimila-tions in a CTM to study transport processes in th UT. This first step has opened important perspectives. First, the assimilation of CO MLS observations on longer time periods will allow us to study the variability of the
5
transport pathways in the African and Mediterranean UT on intraseasonal and sea-sonal timescales. A further step will also consist in assimilating O3 MLS observations to evaluate the impact of the transport pathways upon the UT O3. In particular, the CO-O3 relationship established from assimilated fields will provide a powerful tool to discriminate the origin of the air masses.
10
Acknowledgements. B. Barret is funded by the European Commission within the AMMA
pro-gramme. Based on a French initiative, AMMA was built by an international scientific group and is currently funded by a large number of agencies, especially from France, the United Kingdom, the United States, and Africa. It has been the beneficiary of a major financial contri-bution from the European Communities Sixth Framework Research Programme. The authors
15
acknowledge for the strong support of the European Commission, Airbus, and the Airlines (Austrian-Airlines, Austrian, Air France) who carry free of charge the MOZAIC equipment and perform the maintenance since 1994. MOZAIC is presently funded by INSU-CNRS, Meteo-France, and FZJ (Forschungszentrum Julich, Germany). Costs of transport for the MOZAIC instrumentation onboard the Air Namibia aircraft in 2006 were paid by INSU-CNRS and by the
20
Network of Excellence ACCENT; maintenance costs were paid by FZJ. Interpolated OLR data are provided by the NOAA/OAR/ESRL PSD, Boulder, Colorado, USA, from their Web site at
http://www.cdc.noaa.gov.
References
Barret, B., Turquety, S., Hurtmans, D., Clerbaux, C., Hadji-Lazaro, J., Bey, I., Auvray, M., and
25
P.-F. Coheur: Global carbon monoxide vertical distributions from spaceborne high-resolution FTIR nadir measurements, Atmos. Chem. Phys., 5, 2901–2914, 2005,
ACPD
8, 2863–2902, 2008Transport of CO in the African upper
troposphere
B. Barret et al.
Title Page
Abstract Introduction
Conclusions References
Tables Figures
◭ ◮
◭ ◮
Back Close
Full Screen / Esc
Printer-friendly Version
Interactive Discussion
Bechtold, P., Bazile, E., Guichard, F., Mascart, P., and Richard, E.: A mass flux convection scheme for regional and global models, Q. J. Roy. Meteor. Soc., 127, 869–886, 2001. 2871
Bernath, P. F., McElroy, C. T., Abrams, M. C., et al.: Atmospheric Chemistry Experiment (ACE): Mission overview, Geophys. Res. Lett., 32, L15S01, doi:10.1029/2005GL022386, 2005. 2869
5
Berthet, G., Esler, J. G., and Haynes, P. H.: A lagrangian perspective of the tropopause and the ventilation of the lowermost stratosphere, J. Geophys. Res., 112, D18102, doi:10.1029/2006JD008295, 2007. 2879
Bousserez, N., Attie, J.-L. , Peuch, V.-H., et al.: Evaluation of the MOCAGE chemistry transport model during the ICARTT/ITOP experiment, J. Geophys. Res., 112, D10S42,
10
doi:10.1029/2006JD007595, 2007. 2870
Buis, S., Piacentini, A., Declat, D., et al.: A Computational framework for assembling high performance computing applications, Concurrency Computat. Pract. Exper., 18, 247–262, 2006. 2872
Chatfield, R. B., Guan, H., Thompson, A. M., and Witte, J. C., Convective lofting links Indian
15
Ocean air pollution to paradoxical South atlantic ozone maxima, Geophys. Res. Lett., 31, L06103, doi:10.1029/2003GL018866, 2004. 2866
Clerbaux, C., Hadji-Lazaro, J., Hauglustaine, D., et al.: Assimilation of carbon monoxide mea-sured from satellite in a three-dimensional chemistry-transport model, J. Geophys. Res., 106, 15 385–15 394, 2001. 2871
20
Clerbaux, C., George, M., Turquety, S., et al.: CO measurements from the ACE-FTS satel-lite instrument: data analysis and validation using ground-based, airborne and spaceborne observations, Atmos. Chem. Phys. Discuss., 7, 15 277–15 340, 2007.2869,2870,2872
Daniel, J. S. and Solomon, S.: On the climate forcing of carbon monoxide, J. Geophys. Res., 103, 13 249–13 260, 1998. 2865
25
Deeter, M. N., Emmons L. K., Francis G. L., et al.: Operational carbon monoxide retrieval algorithm and selected results for the MOPITT instrument, J. Geophys. Res., 108, 4399, doi:10.1029/2002JD003186, 2003. 2865
Dentener, F., Stevenson, D., Cofala, J., et al.: The impact of air pollutant and methane emission controls on tropospheric ozone and radiative forcing: CTM calculations for the period 1990–
30
2030 , Atmos. Chem. Phys., 5, 1731–1755, 2005,
http://www.atmos-chem-phys.net/5/1731/2005/. 2871
Eu-ACPD
8, 2863–2902, 2008Transport of CO in the African upper
troposphere
B. Barret et al.
Title Page
Abstract Introduction
Conclusions References
Tables Figures
◭ ◮
◭ ◮
Back Close
Full Screen / Esc
Printer-friendly Version
Interactive Discussion
rope: Seasonal and Interannual variations (1987–1997), J. Geophys. Res., 109, D08301, doi:10.1029/2003JD004079, 2004. 2865
Errera, Q., and Fonteyn, D., Four-dimensional variational chemical assimilation of CRISTA stratospheric measurements, J. Geophys. Res., 106, 12 253–12 265, 2001.2871
Filipiak, M. J., Harwood, R. S., Jiang, J. H., Li, Q., Livesey, N. J., Manney, G. L., Read, W.
5
G., Schwartz, M. J., Waters, J. W., and Wu, D. L.: Carbon Monoxide Measured by the EOS Microwave Limb Sounder on Aura: First Results, Geophys. Res. Lett., 32, L14825, doi:10.1029/2005GL022765, 2005. 2865
Fisher, M. and Andersson, E.: Developments in 4D-Var and Kalman Filtering, ECMWF Techni-cal Memoranda, 347, 1–36, 2001. 2872
10
Folkins, I., Bernath, P., Boone, C., Donner, L. J., Eldering, A., Lesins, G., Martin, R. V., Sinnhu-ber, B.-M., and Walker, K.: Testing convective parameterizations with tropical measurements of HNO3, CO, H2O, and O3: Implications for the water vapor budget, J. Geophys. Res., 111, D23304, doi:10.1029/2006JD007325, 2006. 2870,2876
Fu, R., Hu, Y., Wright, J. S., et al.: Short circuit of water vapor and polluted air to the global
15
stratosphere by convective transport over the Tibetan Plateau (2006), Proc. Natl. Acad. Sci. USA., 103, 5664–5669, 2006. 2865,2879
Fu, T. M., Jacob, D. J., Palmer, P. I, et al.: Space-based formaldehyde measurements as constraints on volatile organic compound emissions in east and south Asia and implications for ozone (2007), J. Geophys. Res., 112, D06312, doi:10.1029/2006JD007853, 2007. 2865,
20
2874
Geer, A. J., Lahoz, W. A., Bekki, S., et al.: The ASSET intercomparison of ozone analyses: method and first results, Atmos. Chem. Phys., 6, 5445–5474, 2006,
http://www.atmos-chem-phys.net/6/5445/2006/. 2871,2872
Holloway, T., Levy, H., and Kasibhatla, P.: Global distribution of carbon monoxide, J. Geophys.
25
Res., 105, D10, 12 123–12 147, 2000. 2865
Hoskins, B. J. and Rodwell, M. J.: A model of the Asian summer monsoon. Part I: the global scale, J. Atmos. Sci., 52, 1329–1340, 1995. 2866,2880
Josse, B., Simon, P., and Peuch, V.-H.: Radon global simulations with the multiscale chemistry transport model MOCAGE, Tellus, Ser. B, 56, 339–356, 2004. 2871
30
Lahoz, W. A., Errera, Q., Swinbank, R., and Fonteyn, D.: Data assimilation of stratospheric constituents: a review, Atmos. Chem. Phys., 7, 5745–5773, 2007,
ACPD
8, 2863–2902, 2008Transport of CO in the African upper
troposphere
B. Barret et al.
Title Page
Abstract Introduction
Conclusions References
Tables Figures
◭ ◮
◭ ◮
Back Close
Full Screen / Esc
Printer-friendly Version
Interactive Discussion
Lamarque, J. F., Khattatov, B., Yudin, V., et al.: Application of a bias estimator for the improved assimilation of Measurements of Pollution in the Troposphere (MOPITT) carbon monoxide retrievals, J. Geophys. Res., 109, D16304, doi:10.1029/2003JD004466, 2004. 2871
Lefevre, F., Brasseur, G. P., Folkins, I., Smith, A. K., and Simon, P.: Chemistry of the 1991–1992 stratospheric winter: threedimensional model simulations, J. Geophys. Res., 99, 8183–8195,
5
1994. 2871
Lelieveld, J., Berresheim, H., Borrmann, S., et al.: Global Air Pollution Crossroads over the Mediterranean, Science, 298, 794–799, 2002. 2867,2879,2881
Li, Q. L., Jacob, D. J., Logan, J. A., et al.: A Tropospheric Ozone Maximum Over the Middle East, Geophys. Res. Lett., 28, D17, 3235–3238, 2001.2866,2879,2880
10
Li, Q. L., Jiang, J. H., Wu, D. L., et al.: Convective outflow of South Asian pollution: A global CTM simulation compared with EOS MLS observations, Geophys. Res. Lett., 32, L14826, doi:10.1029/2005GL022762, 2005. 2865,2879,2880
Liang, Q., Jaegle, L., Hudman R. C., et al.: Summertime influence of Asian pollution in the free troposphere over North America, J. Geophys. Res., D12S11, doi:10.1029/2006JD007919,
15
2007. 2865
Livesey, N. J., Filipiak, M. J., Froidevaux, L., et al.: Validation of Aura Microwave Limb Sounder O3and CO observations in the upper troposphere and lower stratosphere, J. Geophys. Res., in press, 2007.2865,2869,2870,2872,2873,2874
Louis, J.-F.: A parametric model of vertical eddy-fluxes in the atmosphere, Bound. Lay. Meteor.,
20
17, 187–202, 1979.2871
Mari, C. H., Cailley, G., Corre, L., et al.: Tracing biomass burning plumes from the Southern Hemisphere during the AMMA 2006 wet season experiment, Atmos. Chem. Phys. Discuss., 7, 17 339–17 366, 2007.2866,2875,2881
Mari, C. and Prospero, J., African Monsoon Multidisciplinary Analysis-Atmospheric Chemistry
25
(AMMA-AC): a new IGAC task; IGACtivities Newsletter, 31, 2–13, 2005.2868
Massart, S., Cariolle, C., and Peuch, V.-H., Towards an improvement of the atmospheric ozone distribution and variability by assimilation of satellite data, C. R. Geosciences, 15, 1305– 1310, 2005. 2872
Massart, S., Piacentini A., Cariolle, D., El Amraoui, L., and Semane N., Assessment of the
30
quality of the ozone measurements from the Odin/SMR instrument using data assimilation, Can. J. Phys., 85, 1209–1223, 2007. 2873
monox-ACPD
8, 2863–2902, 2008Transport of CO in the African upper
troposphere
B. Barret et al.
Title Page
Abstract Introduction
Conclusions References
Tables Figures
◭ ◮
◭ ◮
Back Close
Full Screen / Esc
Printer-friendly Version
Interactive Discussion
ide from NASAs Atmospheric Infrared Sounder, Geophys. Res. Lett., 32, L11801, doi:10.1029/2004GL021821, 2005. 2865
Nedelec, P., Cammas, J.-P., Thouret, V., et al.: An improved infrared carbon monoxide analyser for routine measurements aboard commercial Airbus aircraft: technical validation and first scientific results of the MOZAIC III programme, Atmos. Chem. Phys., 3, 1551–1564, 2003,
5
http://www.atmos-chem-phys.net/3/1551/2003/. 2876
Pradier, S., Attie, J.-L., Chong, M., et al.: Evaluation of 2001 springtime CO transport over West Africa using MOPITT CO measurements assimilated in a global chemistry transport model, Tellus Ser. B, 58, 163–176, 2006.2867,2871
Park, M., Randel, W. J., Gettelman, A., Massie, S. T., and Jiang, J. H.: Transport above the
10
Asian summer monsoon anticyclone inferred from Aura Microwave Limb Sounder tracers, J. Geophys. Res., 112, D16309, doi:10.1029/2006JD008294, 2007. 2865,2866,2879,2880
Popovic, J. and Plumb, R. A.: Eddy Sheding from the Upper-Tropospheric Asian Monsoon Anticyclone, J. Atmos. Sci., 58, 93–104, 2001. 2866,2883
Pumphrey, H. C., Filipiak, M. J., Livesey, N. J., et al.: Validation of middle-atmosphere
15
carbon monoxide retrievals from MLS on Aura, J. Geophys. Res., 112, D24S38, doi:10.1029/2007JD008723, 2007. 2869,2870
Randel, W. J. and Park, M.: Deep convective influence on the Asian summer monsoon anticy-clone and associated tracer variability observed with Atmospheric Infrared Sounder (AIRS), J. Geophys. Res., 111, D12314, doi:10.1029/2005JD006490, 2006.2866,2880
20
Raspollini, P., Belotti, C., Burgess A., et al.: MIPAS level 2 operational analysis, Atmos. Chem. Phys., 6, 5605–5630, 2006,http://www.atmos-chem-phys.net/6/5605/2006/. 2872
Redelsperger, J. L., Thorncroft, C. D., Diedhiou, A., et al.: African monsoon multidisciplinary analysis – An international research project and field campaign, Bull. Amer. Soc., 87, 1739, doi:10.1175/BAMS-87-12-1739, 2006.2868
25
Ricaud P., Barret, B., Attie, J.-L., et al.: Impact of land convection on troposphere-stratosphere exchange in the tropics, Atmos. Chem. Phys., 7, 5639–5657, 2007,
http://www.atmos-chem-phys.net/7/5639/2007/. 2870
Richter A., Burrows, J. P., Nuss, H., et al.: Increase in tropospheric nitrogen dioxide over China observed from space, Nature, 437, 129–132, 2005.2865,2874
30