ACPD
14, 20159–20195, 2014Transport pathways of peroxyacetyl nitrate in the upper
troposphere and lower stratosphere
S. Fadnavis et al.
Title Page
Abstract Introduction
Conclusions References
Tables Figures
◭ ◮
◭ ◮
Back Close
Full Screen / Esc
Printer-friendly Version
Interactive Discussion
Discussion
P
a
per
|
Discus
sion
P
a
per
|
Discussion
P
a
per
|
Discussion
P
a
per
|
Atmos. Chem. Phys. Discuss., 14, 20159–20195, 2014 www.atmos-chem-phys-discuss.net/14/20159/2014/ doi:10.5194/acpd-14-20159-2014
© Author(s) 2014. CC Attribution 3.0 License.
This discussion paper is/has been under review for the journal Atmospheric Chemistry and Physics (ACP). Please refer to the corresponding final paper in ACP if available.
Transport pathways of peroxyacetyl
nitrate in the upper troposphere and lower
stratosphere from di
ff
erent monsoon
systems during the summer monsoon
season
S. Fadnavis1, K. Semeniuk2, M. G. Schultz3, A. Mahajan1, L. Pozzoli4, S. Sonbawane1, and M. Kiefer5
1
Indian Institute of Tropical Meteorology, Pune, India
2
Department of Earth and Space Sciences and Engineering, York University, Toronto, Canada
3
Institute for Energy and Climate Research-Troposphere (IEK-8), Forschungszentrum Jülich, Jülich, Germany
4
Eurasia Institute of Earth Sciences, Istanbul Technical University, Istanbul, Turkey
5
ACPD
14, 20159–20195, 2014Transport pathways of peroxyacetyl nitrate in the upper
troposphere and lower stratosphere
S. Fadnavis et al.
Title Page
Abstract Introduction
Conclusions References
Tables Figures
◭ ◮
◭ ◮
Back Close
Full Screen / Esc
Printer-friendly Version
Interactive Discussion
Discussion
P
a
per
|
Discus
sion
P
a
per
|
Discussion
P
a
per
|
Discussion
P
a
per
|
Received: 5 June 2014 – Accepted: 14 July 2014 – Published: 4 August 2014 Correspondence to: S. Fadnavis ([email protected])
ACPD
14, 20159–20195, 2014Transport pathways of peroxyacetyl nitrate in the upper
troposphere and lower stratosphere
S. Fadnavis et al.
Title Page
Abstract Introduction
Conclusions References
Tables Figures
◭ ◮
◭ ◮
Back Close
Full Screen / Esc
Printer-friendly Version
Interactive Discussion
Discussion
P
a
per
|
Discus
sion
P
a
per
|
Discussion
P
a
per
|
Discussion
P
a
per
|
Abstract
The Asian summer monsoon involves complex transport patterns with large scale re-distribution of trace gases in the upper troposphere and lower stratosphere (UTLS). We employ the global chemistry–climate model ECHAM5-HAMMOZ in order to eval-uate the transport pathways and the contributions of nitrogen oxide reservoir species
5
PAN, NOx, and HNO3from various monsoon regions, to the UTLS over Southern Asia
and vice versa. The model is evaluated with trace gas retrievals from the Michelson Interferometer for Passive Atmospheric Sounding (MIPAS-E) and aircraft campaigns during the monsoon season (June–September).
There are three regions which contribute substantial pollution to the UTLS during the
10
monsoon: the Asian summer monsoon (ASM), the North American Monsoon (NAM) and the West African monsoon (WAM). However, penetration due to ASM convection is deeper into the UTLS as compared to NAM and WAM outflow. The circulation in these monsoon regions distributes PAN into the tropical latitude belt in the upper tro-posphere. Remote transport also occurs in the extratropical upper troposphere where
15
westerly winds drive North American and European pollutants eastward to partly merge with the ASM plume. Strong ASM convection transports these remote and regional pol-lutants into the lower stratosphere. In the lower stratosphere the injected polpol-lutants are transported westward by easterly winds.
The intense convective activity in the monsoon regions is associated with lightning
20
generation and thereby the emission of NOy species. This will affect the distribution of
PAN in the UTLS. The estimates of lightning produced PAN, HNO3, NOxand ozone ob-tained from control and lightning-offsimulations shows high percentage changes over the regions of convective transport especially equatorial Africa and America and com-paratively less over the ASM. This indicates higher anthropogenic pollution transport
25
ACPD
14, 20159–20195, 2014Transport pathways of peroxyacetyl nitrate in the upper
troposphere and lower stratosphere
S. Fadnavis et al.
Title Page
Abstract Introduction
Conclusions References
Tables Figures
◭ ◮
◭ ◮
Back Close
Full Screen / Esc
Printer-friendly Version
Interactive Discussion
Discussion
P
a
per
|
Discus
sion
P
a
per
|
Discussion
P
a
per
|
Discussion
P
a
per
|
1 Introduction
Deep monsoon convection plays a key role in venting chemical constituents from the boundary layer and their export from source regions (Dickerson et al., 1987). The largest regional monsoon systems are the North American monsoon (NAM), Asian Summer Monsoon (ASM), Western North Pacific monsoon (WNPM), South American
5
monsoon (SAM), West African Monsoon (WAM), and the Australian Monsoon (AUSM) (Chang et al., 2011). Recent observations and modeling studies indicate that the Asian summer monsoon (Park et al., 2004; Li et al., 2005; Randel and Park, 2006; Fu et al., 2006; Park et al., 2007; Xiong et al., 2009; Randel et al., 2010; Fadnavis et al., 2013), the North American Monsoon (Schmitz and Mullen, 1996; Collier and Zhang, 2006;
10
Barth et al., 2012) and the West African monsoon (Bouarar et al., 2011) play impor-tant roles in the transport of chemical constituents out of the boundary layer into the monsoon anticyclone in the upper troposphere and lower stratosphere. Model simu-lations also suggest that transported pollutants from the Asian monsoon region could contribute substantially to the budgets of stratospheric ozone, NOx and water vapour
15
(Randel et al., 2010). Transport of ozone precursors rich with VOCs during North Amer-ican monsoon enhances ozone in the anticyclone (Li et al., 2005; Zhang et al., 2008; Choi et al., 2009; Barth et al., 2012). The deep monsoon convection over West Africa transports Central African emissions to the UTLS leading to large ozone changes in the lower stratosphere (Bouarar et al., 2011). Although a number of papers have reported
20
transport of chemical constituents into the UTLS due to the Asian monsoon convection, less attention has been paid to deep convective transport from North/South America and West Africa to the lower stratosphere and to their relative contributions to the UTLS composition.
Peroxyacetylnitrate (PAN) is formed by the oxidation of non methane volatile
or-25
ACPD
14, 20159–20195, 2014Transport pathways of peroxyacetyl nitrate in the upper
troposphere and lower stratosphere
S. Fadnavis et al.
Title Page
Abstract Introduction
Conclusions References
Tables Figures
◭ ◮
◭ ◮
Back Close
Full Screen / Esc
Printer-friendly Version
Interactive Discussion
Discussion
P
a
per
|
Discus
sion
P
a
per
|
Discussion
P
a
per
|
Discussion
P
a
per
|
NOx(Fischer et al., 2013). Biomass burning, natural plant and soil emissions also con-tribute to NMVOC and NOx production. In the upper troposphere, lightning can add
substantial amounts of NOxand thus lead to additional PAN production if NMVOC
pre-cursors are present, e.g. from convective uplifting from the boundary layer. The estimated global NOx production by lightning is ∼3–5 Tg N year−
1
(Schumann
5
and Huntrieser, 2007; Martin et al., 2007; Murray et al., 2012). Strong lightning activity during ASM, NAM and WAM (Shepon et al., 2007; Evett et al., 2008; Ranalkar and Chaudhari, 2009; Barret et al., 2010; Penki and Kamra, 2013) contributes to PAN pro-duction via lightning NOx. The estimated increase in PAN is∼20–30 % due to nitrogen
enhancement by lightning (Tie et al., 2001). The main loss reactions of PAN are thermal
10
decomposition (most important in the lower troposphere up to∼500 hPa), photolysis
(most important in the UTLS), and the reaction with OH (Talukdar et al., 1995; Fischer et al., 2013).
Due to the cold temperatures in the UTLS, the chemical lifetime of PAN in this region is several months. The PAN lifetime in ECHAM5-HAMMOZ simulations varies between
15
80 and 200 days in the tropical UTLS (figure not included). PAN therefore travels over long distances and affects the NOy partitioning in areas that are far away from the precursor emission regions. Upon descent into warmer regions of the troposphere, PAN released NOxincreases ozone and OH production in remote regions (Singh et al.,
1986, 1998; Hudman et al., 2004). PAN mixing ratios vary from less than 1 pptv in
20
the remote marine atmosphere (as observed during the NASA GTE PEM-Tropics B campaign in the South Pacific lower marine boundary layer, data available at http://acd. ucar.edu/~emmons/DATACOMP/) to several ppbv in the polluted urban environment and biomass burning plumes (Ridley et al., 1992; Singh et al., 1998). In the UTLS mixing ratios are typically in the range 10–300 pptv (Emmons et al., 2000; Keim et al.,
25
2008).
ACPD
14, 20159–20195, 2014Transport pathways of peroxyacetyl nitrate in the upper
troposphere and lower stratosphere
S. Fadnavis et al.
Title Page
Abstract Introduction
Conclusions References
Tables Figures
◭ ◮
◭ ◮
Back Close
Full Screen / Esc
Printer-friendly Version
Interactive Discussion
Discussion
P
a
per
|
Discus
sion
P
a
per
|
Discussion
P
a
per
|
Discussion
P
a
per
|
aircraft campaigns and the Michelson Interferometer for Passive Atmospheric Sound-ing (MIPAS) instrument onboard the ENVIronmental SATellite (ENVISAT). The paper is organized as follows: Sect. 2 contains a short description of the data and model in-cluding the simulation setup. ECHAM5-HAMMOZ results are evaluated with airborne and MIPAS-E measurements in Sect. 3. In Sect. 4, we discuss the various convective
5
transport pathways of PAN into the UTLS; its redistribution in the stratosphere and re-circulation across the various monsoon regions. The analysis of percentage change in lightning produced ozone, HNO3, PAN and NOx on total concentration over the
con-vective zones is also presented. Conclusions are given in Sect. 5.
2 Methods
10
2.1 Satellite measurements
The MIPAS–E instrument onboard the ENVISAT was launched in March 2002 into a polar orbit of 800 km altitude, with an orbital period of about 100 min and an orbit repeat cycle of 35 days. MIPAS-E (Fischer and Oelhaf, 1996; Fischer et al., 2008) was a Fourier Transform Spectrometer that provided continual limb emission measurements
15
in the mid infrared over the range 685–2410 cm−1(14.6–4.15 µm). From June 2002 to
March 2004 MIPAS-E operated in its full spectral resolution mode at an unapodized resolution of 0.035 cm−1, and with tangent altitude steps of 3 km in the UTLS. From
January 2005 through the end of the mission in April 2012 the spectral resolution was reduced to 0.0875 cm−1, while the tangent altitude steps in the UTLS were reduced 20
to 1.5–2 km. MIPAS-E monitored several atmospheric trace constituents affecting at-mospheric chemistry including PAN, NOx, and O3. The details of the general retrieval
method and setup, error estimates and use of averaging kernel and visibility flag are documented by Von Clarmann et al. (2009). Details of the PAN retrievals, error bud-get, and vertical resolution are given by Glatthor et al. (2007) for 2002–2004, and by
25
ACPD
14, 20159–20195, 2014Transport pathways of peroxyacetyl nitrate in the upper
troposphere and lower stratosphere
S. Fadnavis et al.
Title Page
Abstract Introduction
Conclusions References
Tables Figures
◭ ◮
◭ ◮
Back Close
Full Screen / Esc
Printer-friendly Version
Interactive Discussion
Discussion
P
a
per
|
Discus
sion
P
a
per
|
Discussion
P
a
per
|
Discussion
P
a
per
|
In this study we analyze the MIPAS-E observed PAN data during the period 2002– 2011. The data are available at http://share.lsdf.kit.edu/imk/asf/sat/mipas-export/Data_ by_Target/. The data versions used in this study are V3O_PAN_5 for 2002–2004, and V5R_PAN_220/V5R_PAN_221 for 2005–2011. The data are processed as per the quality specifications given in the documentation. The useful height range is
speci-5
fied as 5 to 23 km. The data are contoured and gridded at 4◦longitude and 8◦ latitude
resolution.
2.2 ECHAM5-HAMMOZ model simulation and experimental setup
The ECHAM5-HAMMOZ aerosol–chemistry–climate model used in the present study comprises of the general circulation model ECHAM5 (Roeckner et al., 2003), the
tro-10
pospheric chemistry module, MOZ (Horowitz et al., 2003), and the aerosol module, Hamburg Aerosol Model (HAM) (Stier et al., 2005). It includes ozone, NOx, VOC and aerosols chemistry. The gas phase chemistry scheme is based on the MOZART-2 model (Horowitz et al., 2003), which includes comprehensive Ox-NOx-hydrocarbons
chemistry with 63 tracers and 168 reactions. The O(1D) quenching reaction rates were
15
updated according to Sander et al. (2003), and isoprene nitrates chemistry according to Fiore et al. (2005). The PAN formation process occurs through the reaction of the peroxy acetyl radical (CH3CO3) and NO2. This reaction is reversible and the thermal decomposition of PAN back to CH3CO3and NO2is the main sink of PAN. The reaction
rates for this reversible reaction are updated in Horowitz et al. (2003). CH3CO3is mainly
20
formed by oxidation of acetaldehyde (CH3CHO) by OH, and by the photolytic decom-position of acetone (CH3COCH3) and methylglyoxal (CH3COCHO). In the model
sim-ulations we included emissions of acetone from anthropogenic sources and wild fires (primary sources), while acetaldehyde and methylglyoxal are produced by oxidation of other NMVOCs (secondary sources). In particular, oxidation of primary NMVOCs
25
like ethane (C2H6), propane (C3H8) and propene (C3H6) forms acetaldehyde, while
CH3COCHO is mainly formed from the oxidation products of isoprene and terpenes.
ACPD
14, 20159–20195, 2014Transport pathways of peroxyacetyl nitrate in the upper
troposphere and lower stratosphere
S. Fadnavis et al.
Title Page
Abstract Introduction
Conclusions References
Tables Figures
◭ ◮
◭ ◮
Back Close
Full Screen / Esc
Printer-friendly Version
Interactive Discussion
Discussion
P
a
per
|
Discus
sion
P
a
per
|
Discussion
P
a
per
|
Discussion
P
a
per
|
are also formed through oxidation of NMVOCs, but their production is small compared to PAN. In the global mean, the main loss process of PAN from the atmosphere is the thermal decomposition into its precursors. Photolysis and reaction with OH are of relatively minor importance but matter in the UTLS region.
In ECHAM5-HAMMOZ dry deposition follows the scheme of Ganzeveld and Lelieveld
5
(1995). Soluble trace gases such as HNO3 and SO2 are also subject to wet
depo-sition. In-cloud and below cloud scavenging follows the scheme described by Stier et al. (2005). PAN is not highly water soluble, therefore dry and wet depositions are insignificant removal process.
The model is run at a spectral resolution of T42 corresponding to about 2.8◦ ×2.8◦ 10
in the horizontal dimension and 31 vertical hybrid σ-p levels from the surface up to 10 hPa. The details of model parameterizations, emissions and validation are described by Pozzoli et al. (2008a, b, 2011) and Fadnavis et al. (2013). Our base year for aerosol and trace gas emissions is 2000, and emissions were repeated annually throughout the simulation period except for biogenic VOC, dust and sea salt emissions, which
15
are parameterized according to the meteorology. The simulations were run as AMIP simulations with specified sea surface temperature (SST) and sea ice (SIC) data over the period 1995–2004.
To study the impact of lightning on the distributions of PAN we compare two sets of experiments; each conducted for 10 years 1995–2004: (1) the control experiment
20
ACPD
14, 20159–20195, 2014Transport pathways of peroxyacetyl nitrate in the upper
troposphere and lower stratosphere
S. Fadnavis et al.
Title Page
Abstract Introduction
Conclusions References
Tables Figures
◭ ◮
◭ ◮
Back Close
Full Screen / Esc
Printer-friendly Version
Interactive Discussion
Discussion
P
a
per
|
Discus
sion
P
a
per
|
Discussion
P
a
per
|
Discussion
P
a
per
|
3 Results and discussion
3.1 Comparison with aircraft measurements
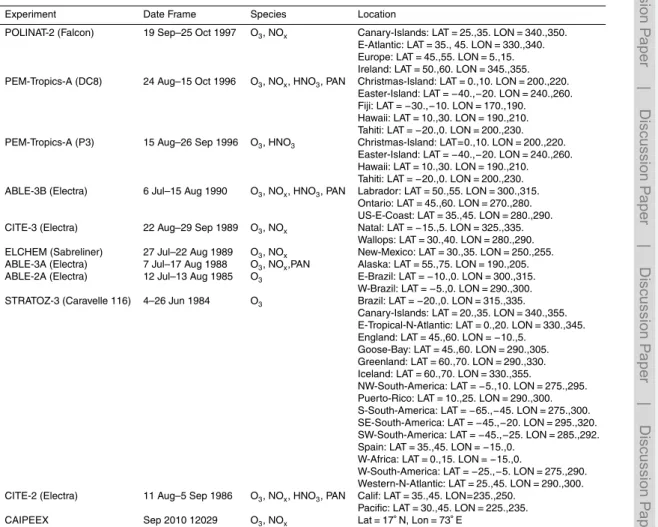
Model simulated PAN, NOx, HNO3 and Ozone mixing ratios are evaluated with cli-matological datasets of airborne campaigns during the monsoon season (June– September). The data were retrieved from http://acd.ucar.edu/~emmons/DATACOMP/
5
CAMPAIGNS/. The NOxand ozone volume mixing ratios observed during CAIPEEX ex-periment, September 2010, are evaluated over the Indian region. The details of instru-ment and measureinstru-ment technique are available at http://www.tropmet.res.in/~caipeex/ about-data.php. The list of data sets and aircraft campaign used for comparison are presented in Table 1. For the comparison, aircraft observations are averaged over 0–
10
2 km, 2–6 km and 6–8 km and at the center latitude and longitude of the flight region. Figure 1a–k compares the observed global distribution of PAN, ozone, HNO3 and NOxto those simulated by ECHAM5-HAMMOZ. The mean aircraft observations (listed
in Table 1) are shown as filled circles and model output are background contours. Fig-ure 1 indicates that model simulated PAN, HNO3 and NOx show good agreement with
15
aircraft measurements however model ozone concentrations in the lower troposphere (0–6 km) are higher over South America. In the upper troposphere (6–10 km) model simulated ozone compares better with aircraft observations. Model simulated ozone and NOxshow good agreement with CAIPEEX measurements over the Indian region.
3.2 Comparison with MIPAS-E measurements
20
In order to study the influence of monsoon circulation on the distribution of PAN in the UTLS region, seasonal mean (June–September) PAN concentrations are ana-lyzed. Figure 2a and b present the seasonal mean distributions of the PAN retrievals from MIPAS-E at 14 and 16 km averaged over the period 2002–2011. Simulated PAN concentrations by ECHAM5-HAMMOZ are plotted in Fig. 2c and d for comparison.
25
ACPD
14, 20159–20195, 2014Transport pathways of peroxyacetyl nitrate in the upper
troposphere and lower stratosphere
S. Fadnavis et al.
Title Page
Abstract Introduction
Conclusions References
Tables Figures
◭ ◮
◭ ◮
Back Close
Full Screen / Esc
Printer-friendly Version
Interactive Discussion
Discussion
P
a
per
|
Discus
sion
P
a
per
|
Discussion
P
a
per
|
Discussion
P
a
per
|
monsoon anticyclone region (12–40◦N, 20–120◦E), and over parts of North America,
the Gulf Stream, southern Atlantic Ocean and west coast of tropical Africa. ECHAM5-HAMMOZ CTRL simulations also show high PAN concentration at these locations (Fig. 2c), however PAN concentrations are lower than MIPAS-E observations and ap-pear somewhat more localized. At 14 km altitude, MIPAS-E exhibits a PAN maximum
5
originating from African sources over the South Atlantic, whereas the model shows this maximum over the African continent. This may be the outflow of biomass burning over central and southern Africa during summer monsoon which is underestimated in the model. From aircraft observations and model simulations Real et al. (2010) reported a plume in the mid and upper troposphere over southern Atlantic which originates from
10
central African biomass burning fire. These differences may also be related to issues in the vertical transport of PAN, or to a possible underestimate of the emission sources of non methane volatile organic compounds. Uncertainties in the rate coefficients and ab-sorption cross sections of PAN may also play a role. Also anthropogenic emissions are mostly underestimated in the emission inventories (Miyazaki et al., 2012). The
com-15
parison of cross-section plots of MIPAS-E PAN with model simulated PAN at various altitudes (8–23 km) indicate that in the UTLS, MIPAS-E PAN is higher than model sim-ulated PAN by ∼20–60 ppt. It is lower by 20–40 ppt over eastern part of anticyclone
and 40–50 ppt over Indonesia and Northern Australia. Near the southern pole MIPAS-E PAN is higher than MIPAS-ECHAM5-HAMMOZ by 70–90 ppt. The model could not produce
20
high PAN concentrations near the southern pole between 17 and 23 km. In the ASM region during the monsoon season MIPAS-E PAN is higher than model by 30–60 ppt. The comparison of PAN measurements from MIPAS-E with Atmospheric Chemistry Experiment-Fourier Transform Spectrometer (ACE-FTS) indicates that MIPAS-E PAN is higher than ACE-FTS in the UTLS by 70 ppt at the altitudes between 9.5–17.5 km,
25
ACPD
14, 20159–20195, 2014Transport pathways of peroxyacetyl nitrate in the upper
troposphere and lower stratosphere
S. Fadnavis et al.
Title Page
Abstract Introduction
Conclusions References
Tables Figures
◭ ◮
◭ ◮
Back Close
Full Screen / Esc
Printer-friendly Version
Interactive Discussion
Discussion
P
a
per
|
Discus
sion
P
a
per
|
Discussion
P
a
per
|
Discussion
P
a
per
|
4 Transport pathways
4.1 Transport from northern tropical land mass
From Fig. 2a–d it appears that air pollution is rising from Asia, North America and trop-ical Africa into the UTLS. Monsoon convective activity over Asia (June–September), North America (July–September) and tropical Africa (June–September, 10◦N–25◦S) 5
appears to play a dominant role in vertical transport. Some fraction of this convective transport can reach the lower stratosphere (Park et al., 2009) and subsequent horizon-tal transport can redistribute PAN in the stratosphere.
To illustrate vertical transport, longitude-altitude cross sections of PAN mixing ra-tios averaged over the ASM anticyclone region (0–30◦N) and for June–September as 10
obtained from MIPAS-E and ECHAM5-HAMMOZ at the altitudes 8–23 km are shown in Fig. 3a and b respectively. Both MIPAS-E observations and ECHAM5-HAMMOZ simulations show elevated levels of PAN (200–250 ppt) near 80–100◦E (ASM), 30◦
W-30◦E (WAM) and 80–100◦W (NAM) regions. The winds plotted in Fig. 3b show cross
tropopause transport from these regions. Figure 3c reveals that transport of
bound-15
ary layer PAN to UTLS mainly occurs from strong convective regions, mainly Bay of Bengal (∼80–90◦E), South China Sea (∼100–120◦E), western Atlantic Ocean (Gulf
Stream region) and Gulf of Mexico (80–100◦W). The transport due to ASM is stronger
and reaches deeper into the lower stratosphere. This is due to the more intense deep convection activity over the ASM region compared to the NAM region. The low
poten-20
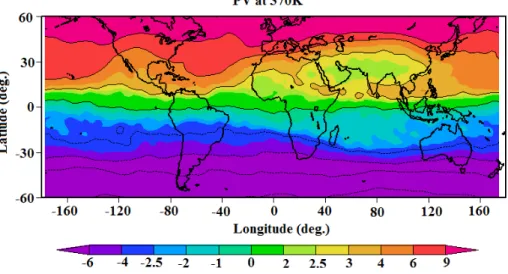
tial vorticity (PV) area indicate the strength of the monsoon anticyclone (Garny and Randel, 2013). The analysis of model simulated potential vorticity at 370 K, shown in Fig. 4 exhibits lower PV values over the ASM region compared to the NAM region. This reflects a stronger monsoon anticyclone over ASM. Out of all the regions in question convective activity is most intense over the region spanning the Bay of Bengal and the
25
ACPD
14, 20159–20195, 2014Transport pathways of peroxyacetyl nitrate in the upper
troposphere and lower stratosphere
S. Fadnavis et al.
Title Page
Abstract Introduction
Conclusions References
Tables Figures
◭ ◮
◭ ◮
Back Close
Full Screen / Esc
Printer-friendly Version
Interactive Discussion
Discussion
P
a
per
|
Discus
sion
P
a
per
|
Discussion
P
a
per
|
Discussion
P
a
per
|
over Central America as well but is much more localized and not effective at pumping North American NOxemissions into the UTLS.
4.2 Transport from southern tropical land mass
In order to understand transport of PAN due to southern WAM, SAM and AUSM, we consider longitude-pressure sections of MIPAS-E observations and model simulated
5
PAN concentrations averaged over 0–25◦S. PAN concentrations from MIPAS-E and
model simulations are plotted in Fig. 3d and e respectively. The model has plumes near 20◦E, 100◦E and 80◦W which are clearest in the view including the boundary layer PAN
distribution is plotted in Fig. 3f. These three regions of convective transport are (1) trop-ical south Africa 10–40◦E, referred as south Africa, (2) Indonesia and northern parts 10
of Australia∼100–110◦E and (3) South America∼70–80◦W. Outflow from Indonesia
and from northern parts of Australia (∼100◦E) penetrates deeper into the UTLS.
Fig-ure 4 shows lower PV values (PV negative in Southern Hemisphere, Dong and Colucci, 2005) over Indonesia and northern part of Australia confirming tropospheric air mass in the lower stratosphere. Tropical Rainfall Measuring Mission (TRMM) satellite
obser-15
vations show high frequency of intense overshooting convection over these areas (dur-ing the monsoon season) with highest density in the belt 0–10◦S over the Caribbean,
Amazon, Congo and Southern Maritime Continent (Liu and Zipser, 2005). The analy-ses of vertical winds show strong transport from 10–40◦E, 100–110◦E, 70–80◦W (in
the belt 0–10◦S). The amount of high level cloud fraction is also high over these re-20
gions. The model simulations show high PAN concentrations reaching the UTLS. Thus transport due to deep convection is reasonably well captured by the model. However, the MIPAS-E observations only show a plume rising over South Africa, The AUSM (Indonesia-Australia) and SAM plumes are not distinguishable at these altitudes. Fig-ure 3f shows that in the upper troposphere (8–14 km) they are mixed by the prevailing
25
ACPD
14, 20159–20195, 2014Transport pathways of peroxyacetyl nitrate in the upper
troposphere and lower stratosphere
S. Fadnavis et al.
Title Page
Abstract Introduction
Conclusions References
Tables Figures
◭ ◮
◭ ◮
Back Close
Full Screen / Esc
Printer-friendly Version
Interactive Discussion
Discussion
P
a
per
|
Discus
sion
P
a
per
|
Discussion
P
a
per
|
Discussion
P
a
per
|
in the upper troposphere (Fig. 3e) shows less PAN concentrations over the longitudes of SAM and AUSM (see Fig. 3e). It is also possible that the three plume structure in the upper troposphere seen in model is being obscured in the observations due to sampling issues and coarse resolution.
Figure 3a–f shows that simulated transport of PAN due to ASM, NAM and WAM
5
convection are stronger and penetrate deeper into the upper troposphere compared to SAM and AUSM. This is consistent with the distribution of deep convection noted by Gettelman et al. (2002). However, the PAN amounts in the UTLS in the model are less than observed by MIPAS-E. This may be due to an underestimate of the chemical PAN source from VOC precursors or too little vertical transport or a combination of both.
10
Earlier model studies with ECHAM also exhibited too low concentrations of CO in the upper tropospheric outflow (M.G. Schultz, unpublished data from the NASA).
4.3 Transport from Asian Summer Monsoon region
The latitude-altitude sections over the ASM (60–120◦E) of MIPAS-E observed PAN
(plotted in the altitude range 8–23 km) and ECHAM5-HAMMOZ CTRL simulations are
15
shown in Fig. 5a and b, respectively. ECHAM5-HAMMOZ simulations are similar to MIPAS-E retrievals of PAN. There is indication of plume ascent into the lower strato-sphere. The ECHAM5-HAMMOZ simulations also show transport of subtropical bound-ary layer PAN into the UTLS (see Fig. 5c) due to deep convection. This is not visible in the MIPAS-E data because of the lack of data below 8 km. Figure 5c shows that
20
there is transport from 40–50◦N reaching up to 10 km (
∼200 hPa). Park et al. (2004,
2007, 2009) and Randel and Park (2006) noted that trace species are introduced into the monsoon anticyclone at its eastern end around 200 hPa. The uplift over south-east Asia and the base of the Himalayas in India pumps tracers into the upper tropical tro-posphere where they get horizontally redistributed by the anticyclonic circulation and
25
form the region of high PAN values between 40◦N and high latitudes. Figure 7c shows
ACPD
14, 20159–20195, 2014Transport pathways of peroxyacetyl nitrate in the upper
troposphere and lower stratosphere
S. Fadnavis et al.
Title Page
Abstract Introduction
Conclusions References
Tables Figures
◭ ◮
◭ ◮
Back Close
Full Screen / Esc
Printer-friendly Version
Interactive Discussion
Discussion
P
a
per
|
Discus
sion
P
a
per
|
Discussion
P
a
per
|
Discussion
P
a
per
|
The Chinese emissions are feeding into this large plume over Russia and partly being transported and diluted over the extratropical Pacific Ocean.
4.4 Transport from North American monsoon region
Figure 5d and e exhibit latitude-altitude sections of PAN from MIPAS-E retrievals and ECHAM5-HAMMOZ simulations (seasonal mean for July–September) over the North
5
American monsoon region between 70W-120W. MIPAS-E observations and the model indicate transport of PAN into the UTLS. The distribution of ECHAM5-HAMMOZ simu-lated PAN from the boundary layer to UTLS (see Fig. 5f) shows that the source region is at around 30◦N. There is convective uplift of PAN over the northern Gulf of Mexico
region and over the Gulf Stream. High amounts of pollutants are emitted from north
10
east America from a number of power plants located in Atlanta, Washington, Chicago, Boston, Jacksonville (CEC report, 2011). The tropospheric NO2columns retrieved from
the SCIAMACHY and OMI satellite instrument shows high amount of anthropogenic NO2emissions over this region (Lamsal et al., 2011; Miyazaki et al., 2012). The Model simulations show high amount of PAN concentrations over this region (Fig. 7a–d). The
15
monsoon convection lifts these pollutants to the upper troposphere. The outflow of these pollutants is over the Atlantic (see Fig. 2a). TRMM precipitation radar obser-vations show significant overshooting convective activity over this region during the monsoon season (Liu and Zipser, 2005).
4.5 Transport from West African region 20
Figure 5g–i show vertical distributions of PAN over the African region (averaged over 0– 45◦E). MIPAS-E observations and model simulations indicate a plume that crosses the
tropopause and enters the lower stratosphere. The model surface fields (see Fig. 5i) show that this plume arises from latitudes 5–20◦S over Africa and that it moves
equa-torward. It subsequently merges with the ASM plume. A prominent tongue of high PAN
25
ACPD
14, 20159–20195, 2014Transport pathways of peroxyacetyl nitrate in the upper
troposphere and lower stratosphere
S. Fadnavis et al.
Title Page
Abstract Introduction
Conclusions References
Tables Figures
◭ ◮
◭ ◮
Back Close
Full Screen / Esc
Printer-friendly Version
Interactive Discussion
Discussion
P
a
per
|
Discus
sion
P
a
per
|
Discussion
P
a
per
|
Discussion
P
a
per
|
be related to emissions from Europe being transported towards the equator in the up-per subtropical troposphere. However, in the model, emissions from Europe, are trans-ported poleward instead of equatorward (Fig. 5i). There is a region of strong descent in the model between 30 and 40◦N (see Fig. 5h) which deforms the PAN isopleths around
12 km around 30◦N downward. This feature is not seen in the MIPAS-E retrievals and 5
indicates a disagreement of the model with the transport pattern of the atmosphere in this region. The transport of PAN in the 10–20◦S latitude band over the Congo, Angola,
Tanzania regions of southern and tropical Africa is not pronounced in the model com-pared to MIPAS-E observations. This behavior indicates that deep tropical convection is underestimated in the model in this latitude band.
10
The model simulated latitude-altitude, longitude-altitude cross sections of NOx, and HNO3over the ASM (10–40◦N, 60–120◦E), NAM (10–40◦N, 70–120◦W) and WAM (0–
25◦S, 0–45◦E) are shown in Fig. 6 panel a and b. Figure 6 in panel a shows transport
features in NOx. These are similar to those seen in the distribution of PAN. This shows that monsoon convection lifts boundary layer pollutants including NOy species to the
15
UTLS. The distribution of HNO3(shown in Fig. 6 panel b). Comparing with Fig. 3b and c
the region around 100◦E with intense convective uplift corresponds to HNO
3depletion
from the surface to above 10 km. In fact, the upper troposphere region of the ASM anticyclone exhibits much lower values of HNO3compared to all the other longitudes in
the 10–40◦N band (Fig. 6c in panel b). This suggests that in the model the convective 20
transport in the ASM region is associated with efficient removal by wet scavenging. In contrast, the North American monsoon region has HNO3 ascending to the upper
troposphere with significantly less loss. This is likely due to the fact that convection involved in vertical transport during the NAM is not as intense and not as deep as in the case of the ASM and there are differences in wet scavenging. Figure 6b in panel
25
ACPD
14, 20159–20195, 2014Transport pathways of peroxyacetyl nitrate in the upper
troposphere and lower stratosphere
S. Fadnavis et al.
Title Page
Abstract Introduction
Conclusions References
Tables Figures
◭ ◮
◭ ◮
Back Close
Full Screen / Esc
Printer-friendly Version
Interactive Discussion
Discussion
P
a
per
|
Discus
sion
P
a
per
|
Discussion
P
a
per
|
Discussion
P
a
per
|
Southern Hemisphere side of the equator during this period. Figure 6d in panel b shows significant transport of African emissions around ∼0–15◦S and a plume rising from
Europe (∼35–60◦N) as well. 4.6 Horizontal transport
PAN concentrations from MIPAS-E and ECHAM5-HAMMOZ simulations at different
5
altitudes are analyzed to understand horizontal transport. Figure 7a shows distribution of PAN from ECHAM5-HAMMOZ simulations near the surface (1 km). Sources of PAN are apparent over South America, southern Africa, North America, Europe, Russia and northern China/Mongolia. The PAN distribution at 3 km (see Fig. 7b) shows high concentrations above these regions indicating vertical transport. Figure 7c shows the
10
distribution at 6 km. There is transport of PAN from central Africa towards America and from Brazil towards Africa.
The LBA-CLAIRE-98 campaign observations (Andreae et al., 2001) and African Monsoon Multidisciplinary Analysis (AMMA) project (Real et al., 2010) show that the biomass burning plume originating from Brazil is lifted to altitudes around 10 km. This
15
plume is entrained into deep convection over the northern Amazon, transported out over the Atlantic and then returned to South America by the circulation around a large upper-level anticyclone. This transport is well captured by the model.
North American pollution is also being transported by the westerly winds over Eura-sia, forming an organized belt. This transport pattern persists up to 12 km (Fig. 7e
20
and g). MIPAS-E observations at 12 km also show this transport pattern. The source region for the PAN from southern Africa is the region of active biomass burning. Since this region is tropical, the outflow is over the Atlantic due to the prevailing easterly zonal winds. ECHAM5-HAMMOZ simulations shows similar transport (see Fig. 7g). But there are differences; in particular the transport over tropical Africa does not get displaced
25
ACPD
14, 20159–20195, 2014Transport pathways of peroxyacetyl nitrate in the upper
troposphere and lower stratosphere
S. Fadnavis et al.
Title Page
Abstract Introduction
Conclusions References
Tables Figures
◭ ◮
◭ ◮
Back Close
Full Screen / Esc
Printer-friendly Version
Interactive Discussion
Discussion
P
a
per
|
Discus
sion
P
a
per
|
Discussion
P
a
per
|
Discussion
P
a
per
|
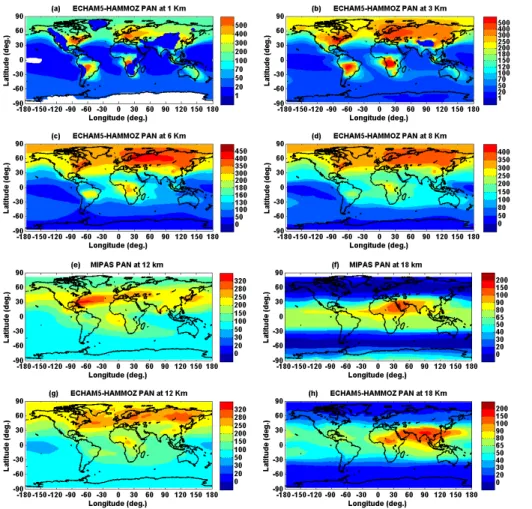
Figure 7f–h show the distribution of PAN from MIPAS-E retrievals and ECHAM5-HAMMOZ simulations, in the lower stratosphere (18 km). In both data sets PAN is transported westwards from ASM, NAM and WAM by prevailing easterly winds.
As can be seen from the above discussions, the ASM, NAM, and WAM outflow and convection over the Gulf Stream play an important role in the transport of boundary
5
layer pollution into the UTLS. Previous studies (e.g. Fadnavis et al., 2013) indicate that over the Asian monsoon region, transport into the lower stratosphere occurs and there is significant vertical transport over the southern slopes of the Himalayas (Fu et al., 2006; Fadnavis et al., 2013) and also over the region spanned by the Bay of Bengal and the South China Sea (Park et al., 2009). Pollutant transport due to North American
10
convection and tropical African outflow does not penetrate as deep into the strato-sphere as the ASM. However there is clear indication of upper tropostrato-sphere transport in middle latitude westerly winds that connects North American pollution to the ASM.
Figures 2–5 show that in the upper troposphere, westerly winds drive North Amer-ican and European pollutants eastward to at least partly merge with the ASM plume.
15
Strong ASM convection transports these remote and regional pollutants into the sphere. The Caribbean is a secondary source of pollutant transport into the strato-sphere. In the stratosphere the injected pollutants are transported westward by easterly winds and into the southern subtropics by the Brewer–Dobson circulation.
4.7 Impact of lightning on tropospheric PAN, NOx, HNO3and ozone
20
Long-range transport of PAN may increase NOx and hence ozone concentrations at remote locations. In the tropical lower troposphere, NOxis rapidly converted into HNO3
due to high amounts of OH. During the monsoon season the intense solar radiation along with high background concentrations of NOx, HOx and NMVOCs and intense lightning activity can affect the formation and distribution NOx, PAN, HNO3 and ozone
25
(Tie et al., 2001). The percentage change in lightning source of ozone, HNO3, PAN
ACPD
14, 20159–20195, 2014Transport pathways of peroxyacetyl nitrate in the upper
troposphere and lower stratosphere
S. Fadnavis et al.
Title Page
Abstract Introduction
Conclusions References
Tables Figures
◭ ◮
◭ ◮
Back Close
Full Screen / Esc
Printer-friendly Version
Interactive Discussion
Discussion
P
a
per
|
Discus
sion
P
a
per
|
Discussion
P
a
per
|
Discussion
P
a
per
|
in the UTLS though heterogeneous reactions. We analyze the spatial distribution of ozone, HNO3, PAN and NOx respectively produced from lightning at mid-tropospheric
and upper tropospheric pressure levels by plotting the differences between the sim-ulations. Figure 8a–d shows changes in zonally averaged spatial distribution of sea-sonal mean (June–September) ozone, HNO3, PAN and NOxrespectively. The analysis
5
indicates that the impact of lightning on these species is high in the tropical upper troposphere. The enhancement takes place between 40◦N–40◦S and between 8 and
14 km. In the tropical mid troposphere lightning produced maximum ozone is ∼15–
25 %, HNO3∼40–60 %∼PAN∼15–25 % and NOX∼20–40 % while in the upper
tro-posphere ozone is∼20–30 %, HNO3∼60–75 %, PAN∼28–35 %, and NOx∼50–75 %.
10
MOZART model simulations also show that lightning enhances PAN formation by 20– 30 %, NOx∼50 % and HNO3by 60–80 % in the middle troposphere (Tie et al., 2001).
Labrador et al. (2005) reported similar results from simulations using the Model of Atmospheric Transport and Chemistry Max-Planck-Institute (MATCH-MPI). The spatial distribution of NOx, ozone, and PAN and HNO3produced from lightning (see Fig. 8e–h)
15
indicate that in the upper troposphere (12 km) increase in O3∼20–25 % (11–17 ppbv),
HNO3∼40–70 %, PAN ∼25–35 % and NOx∼55–75 %, over North America are in
agreement with previous studies (e.g Labrador et al., 2005; Hudman et al., 2007; Zhao et al., 2009; Cooper et al., 2009), over equatorial Africa (PAN 30–45 %, HNO3∼70–
80 %, O3∼25 %, NOx∼70 %) agrees well with Barret et al., 2010; Bouarar et al., 2011
20
and over the ASM region (PAN∼25 %, HNO3∼65–70 %, O3∼20 %, NOx∼60–70 %)
agrees with Tie et al. (2001). These regions coincide with regions of convective vertical transport of PAN (as seen in Figs. 3 and 5). They will be lifted into the lower strato-sphere by the monsoon convection along with anthropogenic emissions and will redis-tribute in the tropical lower stratosphere. Latitude-longitude cross sections of lightning
25
produced PAN, NOx, ozone and HNO3at altitudes between 8–14 km show production of PAN, NOx, ozone and HNO3is relatively less over the ASM region than the equatorial
ACPD
14, 20159–20195, 2014Transport pathways of peroxyacetyl nitrate in the upper
troposphere and lower stratosphere
S. Fadnavis et al.
Title Page
Abstract Introduction
Conclusions References
Tables Figures
◭ ◮
◭ ◮
Back Close
Full Screen / Esc
Printer-friendly Version
Interactive Discussion
Discussion
P
a
per
|
Discus
sion
P
a
per
|
Discussion
P
a
per
|
Discussion
P
a
per
|
and 5). This indicates higher amounts anthropogenic emission transport into the UTLS from the ASM.
5 Conclusions
Analysis of PAN observations from the MIPAS instrument on the Envisat satellite for the period 2002–2011 and ECHAM5-HAMMOZ global model simulations shows that
5
during monsoon season pollution outflow from Asian summer monsoon (ASM), North American Monsoon (NAM) and West African monsoon (WAM) regions penetrates into the UTLS. However, penetration due to ASM convection is deeper than in the NAM and WAM regions during the June–September period and partly extends into the strato-sphere. In the upper troposphere, westerly winds drive North American and
north-10
ward propagating South African pollutants eastward and they mix with the ASM plume. Deep, overshooting convection and strong diabatic upwelling in the ASM region con-vection transports a part of these plumes into the lower stratosphere. Some cross tropopause transport occurs due to overshooting convection over North America and Southern Africa as well (Khaykin et al., 2009; Randel et al., 2012; Hassim et al., 2014).
15
In the lower stratosphere the injected pollutants from ASM, WAM and NAM are trans-ported westward by easterly winds and into the Southern Hemisphere subtropics by the Brewer–Dobson circulation. In the Southern Hemisphere, plumes rising from con-vective zones of South Africa, South America and Indonesia-Australia are evident in model simulations. PAN concentrations are higher in the plume rising from South Africa
20
than SAM and AUSM. In the upper troposphere, they merge by the prevailing westerly winds. MIPAS-E observations in the UTLS show a single plume over South Africa. The reasons for the single plume seen in MIPAS-E may be that lower concentrations of PAN reach these altitudes (above 8 km) from SAM and AUSM and mixing with South African plume. It is also possible that the three plume structure in the upper troposphere
25
ACPD
14, 20159–20195, 2014Transport pathways of peroxyacetyl nitrate in the upper
troposphere and lower stratosphere
S. Fadnavis et al.
Title Page
Abstract Introduction
Conclusions References
Tables Figures
◭ ◮
◭ ◮
Back Close
Full Screen / Esc
Printer-friendly Version
Interactive Discussion
Discussion
P
a
per
|
Discus
sion
P
a
per
|
Discussion
P
a
per
|
Discussion
P
a
per
|
simulations shows that the PAN from southern Africa and Brazil is transported towards America by the circulation around a large upper-level anticyclone and then lifted to the UTLS in the NAM region.
Lightning production of NOy species may enhance PAN concentrations in the up-per troposphere and affect its transport in the lower Stratosphere. The percentage
5
change in lightning produced ozone, HNO3, PAN and NOx on total concentration has
been evaluated using the ECHAM-HAM model. In the upper troposphere, lightning causes significant increases in these species over the equatorial America (PAN∼25–
35 %, HNO3∼50–75 %, O3∼20–25 %, NOx∼55–75 %), equatorial Africa (PAN∼30–
45 %, HNO3∼70–80 %, O3∼ 25 %, NOx∼70 %) and the ASM region (PAN ∼25 %,
10
HNO3∼65–70 %, O3∼20 %, NOx∼60 %). These regions coincide with intense
con-vective zones with significant vertical transport. Lighting production is higher over equa-torial Africa and America compared to the ASM. However, the vertical distribution shows that higher amounts of PAN are transported into the upper troposphere in the ASM region. This indicates higher amount anthropogenic emission transport into the
15
UTLS from the ASM region. This is consistent with the fact that anthropogenic emis-sions in the ASM region are higher than in the NAM and WAM (Lamsal et al., 2011; Miyazak et al., 2012).
Recent observations show a positive trend (with time) in lightning (Price and Asfur, 2006) and deep convective activity over the tropical land mass (Aumann and
Ruz-20
maikin, 2013). TRMM precipitation radar also shows high density of deep over shoot-ing events over the convective regions of Caribbean, Mexico, Sahara desert, Congo and Indonesia (Liu and Zipser, 2005) during summer monsoon season. This should amplify the UTLS trend from increasing tropospheric pollution. However, an analysis of this process is beyond the scope of this study.
25
Acknowledgements. The authors thank the MIPAS-E teams for providing data and the High
ACPD
14, 20159–20195, 2014Transport pathways of peroxyacetyl nitrate in the upper
troposphere and lower stratosphere
S. Fadnavis et al.
Title Page
Abstract Introduction
Conclusions References
Tables Figures
◭ ◮
◭ ◮
Back Close
Full Screen / Esc
Printer-friendly Version
Interactive Discussion
Discussion
P
a
per
|
Discus
sion
P
a
per
|
Discussion
P
a
per
|
Discussion
P
a
per
|
References
Andreae, M. O., Artaxo, P., Fischer, H., Freitas, S. R., Grégoire, J.-M., Hansel, A., Hoor, P., Kormann, R., Krejci, R., Lange, L., Lelieveld, J., Lindinger, W., Longo, K., Peters, W., de Reus, M., Scheeren, B., Silva Dias, M. A. F., Ström, J., Velthoven, P. F. J. van and William, J.: Transport of biomass burning smoke to the upper troposphere by deep convection in the 5
equatorial region, Geophys. Res. Lett., 28, 951–958, 2001.
Aumann, H. H. and Ruzmaikin, A.: Frequency of deep convective clouds in the tropical zone from 10 years of AIRS data, Atmos. Chem. Phys., 13, 10795–10806, doi:10.5194/acp-13-10795-2013, 2013.
Barret, B., Williams, J. E., Bouarar, I., Yang, X., Josse, B., Law, K., Pham, M., Le Flochmoën, E., 10
Liousse, C., Peuch, V. H., Carver, G. D., Pyle, J. A., Sauvage, B., van Velthoven, P., Schlager, H., Mari, C., and Cammas, J.-P.: Impact of West African Monsoon convective trans-port and lightning NOx production upon the upper tropospheric composition: a multi-model study, Atmos. Chem. Phys., 10, 5719–5738, doi:10.5194/acp-10-5719-2010, 2010.
Barth, M. C., Lee, J., Hodzic, A., Pfister, G., Skamarock, W. C., Worden, J., Wong, J., and 15
Noone, D.: Thunderstorms and upper troposphere chemistry during the early stages of the 2006 North American Monsoon, Atmos. Chem. Phys., 12, 11003–11026, doi:10.5194/acp-12-11003-2012, 2012.
Bouarar, I., Law, K. S., Pham, M., Liousse, C., Schlager, H., Hamburger, T., Reeves, C. E., Cammas, J.-P., Nédéléc, P., Szopa, S., Ravegnani, F., Viciani, S., D’Amato, F., Ulanovsky, A., 20
and Richter, A.: Emission sources contributing to tropospheric ozone over Equatorial Africa during the summer monsoon, Atmos. Chem. Phys., 11, 13395–13419, doi:10.5194/acp-11-13395-2011, 2011.
CEC (Commission for Environmental Cooperation): Report on North American Power Plant Air Emissions, Montréal, Canada, 2011.
25
Chang Yihui Ding , C.-P., Lau, N.-C., Johnson, R. H., Wang, B., and Yasunari, T. (Eds.): The Global Monsoon System: Research and Forecast, 2nd Edn., World Scientific Publishing Co, Singapore, 2011.
Choi, Y., Kim, J., Eldering, A., Osterman, G., Yung, Y. L., Gu, Y., and Liou, K. N.: Light-ning and anthropogenic NOx sources over the United States and the western North At-30
ACPD
14, 20159–20195, 2014Transport pathways of peroxyacetyl nitrate in the upper
troposphere and lower stratosphere
S. Fadnavis et al.
Title Page
Abstract Introduction
Conclusions References
Tables Figures
◭ ◮
◭ ◮
Back Close
Full Screen / Esc
Printer-friendly Version
Interactive Discussion
Discussion
P
a
per
|
Discus
sion
P
a
per
|
Discussion
P
a
per
|
Discussion
P
a
per
|
Collier, J. C. and Zhang, G. J.: Simulation of the North American Monsoon by the NCAR CCM3 and its sensitivity to convection parameterization, J. Climate, 19, 2851–2866, 2006.
Cooper, O. R., Eckhardt, S., Crawford, J. H., Brown, C. C., Cohen, R. C., Bertram, T. H., Wooldridge, P., Perring, A., Brune, W. H., Ren, X., Brunner, D., and Baughcum, S. L.: Sum-mertime buildup and decay of lightning NOx and aged thunderstorm outflow above North 5
America, J. Geophys. Res., 114, D01101, doi:10.1029/2008JD010293, 2009.
Dickerson, R. R., Huffman, G. J., Luke, W. T., Nunnermacker, L. J., Pickering, K. E., Leslie, A., Lindsey, C., Slinn, W., Kelly, T., Daum, P., Delany, A., Grennberg, J., Zimmerman, P., Boat-man, J., Ray, J., and StedBoat-man, D.: Thunderstorms: an important mechanism in the transport of air pollutants, Science, 235, 460–465, 1987.
10
Dong, L. and Colucci, S. J.: The role of deformation and potential vorticity in Southern Hemi-sphere blocking onsets, J. Atmos. Sci., 62, 4043–4056, 2005.
Emmons, L. K., Hauglustaine, D. A., Muller, J.-F., Carroll, M. A., Brasseur, G. P., Brunner, D., Staehelin, J., Thouret, V., and Marenco, A.: Data composites of tropospheric ozone and its precursors from aircraft measurements, J. Geophys. Res., 105, 20497–20538, 2000. 15
Evett, R. R., Mohrle, C. R., Hall, B. L., Brownb, T. J., and Stephens, S. L.: The effect of mon-soonal atmospheric moisture on lightning fire ignitions in southwestern North America, Agr. Forest Meteorol., 148, 1478–1487, 2008.
Fadnavis, S., Semeniuk, K., Pozzoli, L., Schultz, M. G., Ghude, S. D., Das, S., and Kakatkar, R.: Transport of aerosols into the UTLS and their impact on the Asian monsoon region as seen in 20
a global model simulation, Atmos. Chem. Phys., 13, 8771–8786, doi:10.5194/acp-13-8771-2013, 2013.
Fiore, A. M., Horowitz, L. W., Purves, D. W., Levy II, H., Evans, M. J., Wang, Y., Li, Q., and Yantosca, R. M.: Evaluating the contribution of changes in isoprene emissions to surface ozone trends over the eastern United States, J. Geophys. Res., 110, D12303, 25
doi:10.1029/2004JD005485, 2005.
Fischer, E. V., Jacob, D. J., Yantosca, R. M., Sulprizio, M. P., Millet, D. B., Mao, J., Paulot, F., Singh, H. B., Roiger, A., Ries, L., Talbot, R.W., Dzepina, K., and Pandey Deolal, S.: Atmo-spheric peroxyacetyl nitrate (PAN): a global budget and source attribution, Atmos. Chem. Phys., 14, 2679–2698, doi:10.5194/acp-14-2679-2014, 2014.
30
ACPD
14, 20159–20195, 2014Transport pathways of peroxyacetyl nitrate in the upper
troposphere and lower stratosphere
S. Fadnavis et al.
Title Page
Abstract Introduction
Conclusions References
Tables Figures
◭ ◮
◭ ◮
Back Close
Full Screen / Esc
Printer-friendly Version
Interactive Discussion
Discussion
P
a
per
|
Discus
sion
P
a
per
|
Discussion
P
a
per
|
Discussion
P
a
per
|
Fischer, H., Birk, M., Blom, C., Carli, B., Carlotti, M., von Clarmann, T., Delbouille, L., Dud-hia, A., Ehhalt, D., Endemann, M., Flaud, J. M., Gessner, R., Kleinert, A., Koopman, R., Langen, J., López-Puertas, M., Mosner, P., Nett, H., Oelhaf, H., Perron, G., Remedios, J., Ridolfi, M., Stiller, G., and Zander, R.: MIPAS: an instrument for atmospheric and climate research, Atmos. Chem. Phys., 8, 2151–2188, doi:10.5194/acp-8-2151-2008, 2008.
5
Fu, R., Hu, Y., Wright, J. S., Jiang, J. H., Dickinson, R. E., Chen, M., Filipiak, M., Read, W. G., Waters, J. W., and Wu, D. L.: Short circuit of water vapour and polluted air to the global stratosphere by convective transport over the Tibetan Plateau, P. Natl. Acad. Sci. USA, 103, 5664–5669, 2006.
Ganzeveld, L. and Lelieveld, J.: Dry deposition parameterization in a chemistry general circu-10
lation model and its influence on the distribution of reactive trace gases, J. Geophys. Res., 100, 20999–21012, doi:10.1029/95JD02266, 1995.
Garny, H. and Randel, W. J.: Dynamic variability of the Asian monsoon anticyclone observed in potential vorticity and correlations with tracer distributions, J. Geophys. Res.-Atmos., 118, 13421–13433, doi:10.1002/2013JD020908, 2013.
15
Gettelman, A., Salby, M. L., and Sassi, F.: Distribution and influence of convection in the tropical tropopause region, J. Geophys. Res., 107, 4080, doi:10.1029/2001JD001048, 2002.
Glatthor, N., von Clarmann, T., Fischer, H., Funke, B., Grabowski, U., Höpfner, M., Kellmann, S., Kiefer, M., Linden, A., Milz, M., Steck, T., and Stiller, G. P.: Global peroxyacetyl nitrate (PAN) retrieval in the upper troposphere from limb emission spectra of the Michelson Interfer-20
ometer for Passive Atmospheric Sounding (MIPAS), Atmos. Chem. Phys., 7, 2775–2787, doi:10.5194/acp-7-2775-2007, 2007.
Grewe, V., Brunner, D., Dameris, M., Grenfell, J. L., Hein, R., Shindell, D., and Staehelin, J.: Ori-gin and variability of upper tropospheric nitrogen oxides and ozone at northern mid-latitudes, Atmos. Environ., 35, 3421–3433, 2001.
25
Hassim, M. E. E., Lane, T. P., and May, P. T.: Ground-based observations of overshooting con-vection during the Tropical Warm Pool-International Cloud Experiment, J. Geophys. Res.-Atmos., 119, 880–905, doi:10.1002/2013JD020673, 2014.
Horowitz, L. W., Walters, S., Mauzerall, D. L., Emmons, L. K., Rasch, P. J., Granier, C., Tie, X., Lamarque, J., Schultz, M. G., Tyndall, G. S., Orlando, J. J., and Brasseur, G. P.: A global 30
ACPD
14, 20159–20195, 2014Transport pathways of peroxyacetyl nitrate in the upper
troposphere and lower stratosphere
S. Fadnavis et al.
Title Page
Abstract Introduction
Conclusions References
Tables Figures
◭ ◮
◭ ◮
Back Close
Full Screen / Esc
Printer-friendly Version
Interactive Discussion
Discussion
P
a
per
|
Discus
sion
P
a
per
|
Discussion
P
a
per
|
Discussion
P
a
per
|
Hudman, R. C., Jacob, D. J., Cooper, O. R., Evans, M. J., Heald, C. L., Park, R. J., Fehsen-feld, F., Flocke, F., Holloway, J., Hübler, G., Kita, K., Koike, M., Kondo, Y., Neuman, A., Nowak, J., Oltmans, S., Parrish, D., Roberts, J. M., and Ryerson, T.: Ozone production in transpacific Asian pollution plumes and implica tions for ozone air quality in California, J. Geophys. Res., 109, D23S10, doi:10.1029/2004jd004974, 2004.
5
Hudman, R. C., Jacob, D. J., Turquety, S., Leibensperger, E. M., Murray, L. T., Wu, S., Gilliland, A. B., Avery, M., Bertram, T. H., Brune, W., Cohen, R. C., Dibb, J. E., Flocke, F. M., Fried, A., Holloway, J., Neuman, J. A., Orville, R., Perring, A., Ren, X., Ryerson, T. B., Sachse, G. W., Singh, H. B., Swanson, A., and Wooldridge, P. J.: Surface and lightning sources of nitrogen oxides over the United States: magnitudes, chemical evolution, and out-10
flow, J. Geophys. Res., 112, D12S05, doi:10.1029/2006JD007912, 2007.
Keim, C., Liu, G. Y., Blom, C. E., Fischer, H., Gulde, T., Höpfner, M., Piesch, C., Ravegnani, F., Roiger, A., Schlager, H., and Sitnikov, N.: Vertical profile of peroxyacetyl nitrate (PAN) from MIPAS-STR measurements over Brazil in February 2005 and its contribution to tropical UT NOypartitioning, Atmos. Chem. Phys., 8, 4891–4902, doi:10.5194/acp-8-4891-2008, 2008. 15
Khaykin, S., Pommereau, J.-P., Korshunov, L., Yushkov, V., Nielsen, J., Larsen, N., Chris-tensen, T., Garnier, A., Lukyanov, A., and Williams, E.: Hydration of the lower stratosphere by ice crystal geysers over land convective systems, Atmos. Chem. Phys., 9, 2275–2287, doi:10.5194/acp-9-2275-2009, 2009.
Labrador, L. J., von Kuhlmann, R., and Lawrence, M. G.: The effects of lightning-produced NOx 20
and its vertical distribution on atmospheric chemistry: sensitivity simulations with MATCH-MPIC, Atmos. Chem. Phys., 5, 1815–1834, doi:10.5194/acp-5-1815-2005, 2005.
Lamsal, L. N., Martin, R. V., Padmanabhan, A., van Donkelaar, A., Zhang, Q., Sioris, C. E., Chance, K., Kurosu, T. P., and Newchurch, M. J.: Application of satellite observations for timely updates to global anthropogenic NOx emission inventories, Geophys. Res. Lett., 38, 25
L05810, doi:10.1029/2010GL046476, 2011.
Li, Q., Jiang, J. H., Wu, D. L., Read, W. G., Livesey, N. J., Waters, J. W., Zhang, Y., Wang, B., Filipiak, M. J., Davis, C. P., Turquety, S., Wu, S., Park, R. J., Yantosca, R. M., and Jacob, D. J.: Convective outflow of South Asian pollution: a global CTM simulation compared with EOS MLS observations, Geophys. Res. Lett., 32, L14826, doi:10.1029/2005GL022762, 2005. 30
ACPD
14, 20159–20195, 2014Transport pathways of peroxyacetyl nitrate in the upper
troposphere and lower stratosphere
S. Fadnavis et al.
Title Page
Abstract Introduction
Conclusions References
Tables Figures
◭ ◮
◭ ◮
Back Close
Full Screen / Esc
Printer-friendly Version
Interactive Discussion
Discussion
P
a
per
|
Discus
sion
P
a
per
|
Discussion
P
a
per
|
Discussion
P
a
per
|
Martin, R. V., Sauvage, B., Folkins, I., Sioris, C. E., Boone, C., Bernath, P., and Ziemke, J.: Space-based constraints on the production of nitric oxide by lightning, J. Geophys. Res., 112, D09309, doi:10.1029/2006JD007831, 2007.
Miyazaki, K., Eskes, H. J., and Sudo, K.: Global NOx emission estimates derived from an assimilation of OMI tropospheric NO2 columns, Atmos. Chem. Phys., 12, 2263–2288, 5
doi:10.5194/acp-12-2263-2012, 2012.
Murray, L. T., Jacob, D. J., Logan, J. A., Hudman, R. C., and Koshak, W. J.: Optimized regional and interannual variability of lightning in a global chemical transport model constrained by LIS/OTD satellite data, J. Geophys. Res., 117, D20307, doi:10.1029/2012JD017934, 2012. Park, M., Randel, W. J., Kinnison, D. E., Garcia, R. R., and Choi, W.: Seasonal variation of 10
methane, water vapour, and nitrogen oxides near the tropopause: satellite observations and model simulations, J. Geophys. Res., doi:10.1029/2003JD003706, 109, D03302, 2004. Park, M., Randel, W. J., Getteleman, A., Massie, S. T., and Jiang, J. H.: Transport above the
Asian summer monsoon anticyclone inferred from Aura Microwave Limb Sounder tracers, J. Geophys. Res., 112, D16309, doi:10.1029/2006JD008294, 2007.
15
Park, M., Randel, W. J., Emmons, L. K., and Livesey, N. J.: Transport pathways of carbon monoxide in the Asian summer monsoon diagnosed from Model of Ozone and Related Trac-ers (MOZART), J. Geophys. Res., 114, D08303, doi:10.1029/2008JD010621, 2009.
Penki, R. K. and Kamra, A. K.: Lightning distribution with respect to the monsoon trough position during the Indian summer monsoon season, J. Geophys. Res., 118, 4780–4787, 20
doi:10.1002/jgrd.50382, 2013.
Pozzoli, L., Bey, I., Rast, J. S., Schultz, M. G., Stier, P., and Feichter, J.: Trace gas and aerosol interactions in the fully coupled model of aerosol–chemistry–climate ECHAM5–HAMMOZ: 1. Model description and insights from the spring 2001 TRACE-P experiment, J. Geophys. Res., 113, D07308, doi:10.1029/2007JD009007, 2008a.
25
Pozzoli, L., Bey, I., Rast, J. S., Schultz, M. G., Stier, P., and Feichter, J.: Trace gas and aerosol interactions in the fully coupled model of aerosol-chemistry-climate ECHAM5–HAMMOZ: 2. Impact of heterogeneous chemistry on the global aerosol distributions, J. Geophys. Res., 113, D07309, doi:10.1029/2007JD009008, 2008b.
Pozzoli, L., Janssens-Maenhout, G., Diehl, T., Bey, I., Schultz, M. G., Feichter, J., Vignati, E., 30
ACPD
14, 20159–20195, 2014Transport pathways of peroxyacetyl nitrate in the upper
troposphere and lower stratosphere
S. Fadnavis et al.
Title Page
Abstract Introduction
Conclusions References
Tables Figures
◭ ◮
◭ ◮
Back Close
Full Screen / Esc
Printer-friendly Version
Interactive Discussion
Discussion
P
a
per
|
Discus
sion
P
a
per
|
Discussion
P
a
per
|
Discussion
P
a
per
|
Price, C. and Asfur, M.: Inferred long term trends in lightning activity over Africa, Earth Planets Space, 58, 1197–1201, 2006.
Ranalkar, M. R. and Chaudhari, H. S.: Seasonal variation of lightning activity over the Indian subcontinent, Meteorol. Atmos. Phys., 104, 125–134, 2009.
Randel, W. J. and Park, M.: Deep convective influence on the Asian summer monsoon an-5
ticyclone and associated tracer variability observed with Atmospheric Infrared Sounder (AIRS), J. Geophys. Res., 111, D12314, doi:10.1029/2005JD006490, 2006.
Randel, W. J., Park, M., Emmons, L., Kinnison, D., Bernath, P., Walker, K. A., Boone, C., and Pumphrey, H.: Asian monsoon transport of pollution to the stratosphere, Science, 328, 611– 613, 2010.
10
Randel, W. J., Moyer, E., Park, M., Jensen, E., Bernath, P., Walker, K., and Boone, C.: Global variations of HDO and HDO/H2O ratios in the upper troposphere and lower strato-sphere derived from ACE-FTS satellite measurements, J. Geophys. Res., 117, D06303, doi:10.1029/2011JD016632, 2012.
Real, E., Orlandi, E., Law, K. S., Fierli, F., Josset, D., Cairo, F., Schlager, H., Borrmann, S., 15
Kunkel, D., Volk, C. M., McQuaid, J. B., Stewart, D. J., Lee, J., Lewis, A. C., Hopkins, J. R., Ravegnani, F., Ulanovski, A., and Liousse, C.: Cross-hemispheric transport of central African biomass burning pollutants: implications for downwind ozone production, Atmos. Chem. Phys., 10, 3027–3046, doi:10.5194/acp-10-3027-2010, 2010.
Ridley, B. A., Madronich, S., Chatfield, R. B., Walega, J. G., Shetter, R. E., Carroll, M. A., 20
and Montzka, D. D.: Measurements and model simulations of the photostationary state dur-ing the Mauna Loa Observatory Photochemistry Experiment: implications for radical con-centrations and ozone production and loss rates, J. Geophys. Res., 97, 10375–10388, doi:10.1029/91JD02287, 1992.
Roeckner, E., Bauml, G., Bonaventura, L., Brokopf, R., Esch, M., Giorgetta, M., Hagemann, S., 25
Kirchner, I., Kornblueh, L., Manzini, E., Rhodin, A., Schlese, U., Schulzweida, U., and Tomp-kins, A.: The Atmospehric General Circulation Model ECHAM5: Part 1, Tech. Rep. 349, Max Planck Institute for Meteorology, Hamburg, 2003.
Sander, S. P., Ravishankara, A. R., Golden, D. M., Kolb, C. E., Kurylo, M. J., Huie, R. E., Orkin, V. L., Molina, M. J., Moortgat, G. K., and Finlayson-Pitts, B. J.: Chemical kinetics 30